Pronob K. Ghosh* | Soumesh Chatterjee | Anik Tahabilder
© 2020 IIETA. This article is published by IIETA and is licensed under the CC BY 4.0 license (http://creativecommons.org/licenses/by/4.0/).
OPEN ACCESS
Continuous monitoring is the prerequisite for secure operation and efficient control of power system. This paper presents a new and straightforward approach to monitor the system efficiently. Optimal PMU placement (OPP) deals with the complete system observability with a minimum number of PMU. The Modified Graph theoretic configuration has been presented here to select some strategic locations for PMU installation. Initially, a new technique has been used here to form spanning tree from its system graph. Some standard bus systems i.e. IEEE 7-bus, IEEE 14-bus, and 30-bus have been used to test the effectiveness of the applied approach. The proposed approach has been carried out for normal operating conditions (NOC) as well as considering Zero Injection Bus (ZIB) effects. The simulation result of this efficient and state forward approach has been compared with some other established approaches.
Phasor Measurement Unit (PMU), Optimal PMU placement, Zero Injection Bus (ZIB), System observability
Phasor Measurement Unit (PMU) has called forth a revolution in power system monitoring, control and security study after being invented in mid-1980’s by Professor Arun G. Phadke. This measuring device is very efficient and accurate to provide the time synchronized measurements of voltage, current, frequency and rate of change of frequency of a particular location using signals from Global Positioning System (GPS). Wide Area Monitoring System (WAMS) based PMU is used to monitor systems for Supervisory Control and Data Acquisition (SCADA) because of its reliability and accuracy [1, 2].
Modern power grid needs to monitor ceaselessly. The value of electrical quantities should lie between the accepted limits to ensure the secure and normal operation of electric power systems. This is done by state estimator tool on a completely observable power system. For a completely observable system, all the bus voltage phasors and current phasors are assessable. PMU based complete monitoring system provides fast and accurate measurements of the system elements. A single PMU can observe several buses. Hence, to achieve the complete observability the required number of PMUs are less than the number of buses. As the PMU is an expensive device, the wise placement of this measuring as well as monitoring device can help to minimize the overall power system monitoring cost [3].
From the previous decade, a substantial amount of research on Optimal PMU Placement (OPP) problem solution has been done in literature. Multi-objective PMU placement has been carried to monitor the electric transmission grid by Mazhari et al. [4]. An optimization technique named Cellular Learning Automata (CLA) has been used to solve the problem. A modified edition of another optimization technique named Binary Cuckoo Optimization Algorithm (BCOA) has been used by Dalali et al. [5]. A common Integer Linear Programming (ILP) by Xu et al. [6] and Binary Particle Swarm Optimization (BPSO) was used to solve the OPP problem [7]. These optimization techniques provided better solutions than that of other contemporary methods. However, optimization techniques take significant amount memory space and lots of iterations are involved, and consequently, these techniques are time consuming.
A heuristic approach is used by Roy et al. [8] where the connectivity information of the complete system configuration directs the optimal PMU locations. A Multi-Criteria Decision Making (MCDM) approach to solve OPP problem has been used by Sodhi et al. [9]. The combination of graph theory and Analytical Hierarchy Process (AHP) has been used for the first time to solve this problem [10]. Coherent generator groups are selected to monitor the system by Rios et al. [11]. Graph theory has been used here by the authors. However, graph theory which has not been used in this area extensively. Typically, a graphical representation of an electrical network helps to analyze it deeply [12, 13]. In this paper, some important graph-theoretic terms have been used to identify the strategic PMU placement locations.
The complete organization of the paper has been depicted as follows. Section 2 describes the power system observability types and bus wise observability rules. Then the next section deals with the detailed description of the proposed method. Section 4 analyses the results, and finally, the section 5 concludes the paper.
According to the literature, typically three types of observability analysis such as numerical, topological, and hybrid observability analysis are available. Numerically observed system consists of a full ranked measurement matrix. On the contrary, topologically observed system consists of a full ranked spanning tree. Finally, the hybrid observability is combination of numerical as well as topological observability, where the complete system forms spanning tree whose measurement matrix is full ranked.
The proposed method follows topological observability where a full ranked spanning tree is formed. When all the bus voltage phasors are known then the complete system is said as completely observed system.
2.1 Observability rules for normal operating conditions
In this research, the bus wise phasor voltage has been assessed as follows-
Rule 1: The line current phasor of a connected line between two buses can be assessed if the voltage phasor of these two buses are known.
Rule 2: The voltage phasor of a bus can be calculated if voltage of one of its adjacent bus and current of their connected line is known.
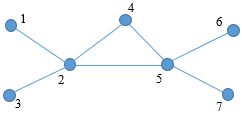
For instance, in Figure 1, current of the line 2-5 can be assessed if PMU can observe buses 2 and 5. Furthermore, the voltage of bus 1 can be calculated if the voltage of bus 2 and current of line 1-2 is known.
Figure 1. IEEE 7-bus system configuration
2.2 Observability rules considering Zero Injection Buses (ZIB)
Zero Injection buses (ZIB) of a system denotes the buses which doesn’t have generation or load facilities. If any given system consists of ZIBs the observability achievement becomes somewhat complex, however the required number of PMUs can be reduced. The observability assessment considering the effects of ZIBs has been conducted as follows-
Rule 1: If n-1 buses of Figure 1 are known, the remaining bus voltage can be assessed.
Rule 2: Two of the inner buses can be calculated if remaining bus voltages are known.
Graph theory is very useful tool to analyze the power system networks. To achieve the complete the complete observability, the initial target of the method is to form a superior spanning tree containing all the buses of the system. Then the strategic places for installing PMUs throughout the system either for normal operating condition or for considering the effects of Zero Injection Buses. The complete proposed method has been described below-
3.1 Spanning tree formation
Spanning tree formation is the essential part of the proposed method. Only the proper and efficient spanning tree leads the identification of strategic locations for PMU placement. Steps which are followed to form the spanning tree are given below.
Step 1: Selection process starts from bus number 1.
Step 2: The next bus will be selected through the branch of having the lowest valued already selected bus.
Step 3: Stop if all the buses are selected, otherwise go step 2.
Now, the modified configuration of a system contains N number of branches, where N is the number of buses of the test system.
3.2 Optimal PMU placement for normal operating condition from spanning tree
The objective of the proposed method is to achieve the complete observability using the minimum number of PMUs. Optimal PMU placement for complete observability is done as follows-
$B_{i}=\sum_{i=1}^{N} S_{i j} \cdot D_{i}$ (1)
where, the objective is-
$\operatorname{minimum} \sum_{i=1}^{N} D_{i}$ (2)
$D_{i}=\left\{\begin{array}{l}
1, \text { if PMU device is installed at bus } i \\
0, \text { otherwise }
\end{array}\right.$ (3)
and $S_{i j}$ is the network connectivity matrix of the spanning tree whose entries are defined as-
$S_{i j}=\left\{\begin{array}{l}
1, \text { if } i^{\text {th }} \text { node is connected to } j^{\text {th }} \text { node } \\
1, \text { if } i=j \\
0, \text { otherwise }
\end{array}\right.$ (4)
For i, j=1, 2 …… N.
For normal operating condition of the given power system network the strategic locations of the PMUs from the previously formed spanning has been conducted through the following steps-
Step 1: Select the radial buses of the modified configuration of the system.
Step 2: Select the buses which connected to the radial bus and include in a set S. Sort the elements in ascending order according to the number of radial bus connectivity.
Step 3: According to rule 2, install PMU at the buses of set S.
Step 4: Declare the final selected buses for PMU installation are the final solution.
3.3 Optimal PMU placement considering ZIB
Considering the ZIB effects helps further to minimize the required number of PMUs.
ZIBs are removed from the set S and included in a new set Z.
Step 1: Install PMU at the bus elements of S and check the extra observability of the system using rule 2.
Step 2: Check complete observability of the system. If the system is completely observable declare the selected buses as OPP set. Otherwise, select the first element of set Z for PMU placement.
3.4 Percentage of PMU equipped buses
n this section, the percentage of PMU equipped buses has been calculated and checked what percentage of PMU buses is required to make the system completely observable.
$\text { PMU equipped buses }=\frac{\text {Required number PMUs}}{\text {Total number of buses}} \times 100 \%$
The proposed technique is applied to some standard test systems to test its effectiveness. The detailed data of these test cases are available at MATLAB Directories [14]. IEEE 14-bus system diagram is shown in Figure 2. This system consists of 14 buses connected through 20 lines. Here, bus 7 is a ZIB.
Figure 2. IEEE 14-bus system
Figure 3. IEEE 14-bus spanning tree
As it has been mentioned in the spanning tree formation section that bus number 1 is a preselected bus. The complete spanning formation starts from this preselected bus. Then, bus 2 is selected which is connected to the preselected bus 1 through the line 2-1. Bus 3 is connected to the already selected part by branch 3-2. Now, bus 4 is connected to the already selected part through multiple branches 4-2 and 4-3. However, according to proposed method only the branch of having lowest valued bus will be selected. Hence, here branch 4-2 is selected. Similarly, for bus 5, only the branch 5-1 is counted. By this way the selected branches are 1-2, 2-3, 2-4, 1-5, 5-6, 4-7, 7-8, 4-9, 9-10, 6-11, 6-12, 6-13, and 9-14 sequentially to select the 14 buses. The total 13 selected branches form a spanning tree which is shown in Figure 3.
Now the spanning tree has been prepared from the system configuration. Then the strategic PMU placement locations have identified-
The radial buses of the spanning tree configuration are 3, 8, 10, 11, 12, 13 and 14. These radial buses are connected to buses 2, 6, 7 and 9. Now, these four buses are included in set S in ascending order according to the number of connected radial buses. So, the set S= {6, 9, 2, 7}. To observe the radial buses 4 PMUs are placed at those buses which are connected to the radial buses.
The percentage of PMU equipped buses has been calculated as follow- this system contains 4 PMU buses. Hence according to the equation mentioned in section 3.4, the percentage of PMU equipped buses is 28.6%. This value indicates that PMUs installing at 28.6% of the total number of buses can achieve the complete observability of the system.
Now for PMU placement considering ZIBs, the ZIB buses are removed from set S. Then the PMUs are installed at the element buses 2, 6, and 9 of set S. Now, it is checked that only bus 8 is not being observed by any of the installed PMUs. However, bus 8 is connected to the ZIB 7. The ZIB based observability rules have been mentioned in 2.2. As buses 4, 7 and 9 are being observed, the voltage phasor of bus 8 is calculated from these observed values. Hence, the final PMUs buses are 2, 6 and 9. Now, percentage of PMU equipped buses is calculated as 21.4%.
Similarly, the PMU locations have been identified for IEEE 30 bus system for normal operating condition and considering ZIB effects. The spanning tree has been shown in Figure 4.
Figure 4. IEEE 30-bus spanning tree
Table 1 and 2 show the required number of PMUs, their respective locations and percentage of PMU equipped buses for normal operating conditions and considering ZIB respectively.
Table 1. Optimal PMU placement for normal operation
|
Test system |
No. of PMUs |
PMU Locations |
PMU equipped buses (%) |
|
7-bus |
2 |
2,4 |
28.6 |
|
14-bus |
4 |
2,6,7,9 |
28.6 |
|
30-bus |
10 |
1,5,6,9,10,12,15,18,25,27 |
33.3 |
Table 2. Optimal PMU placement considering ZIB
|
Test system |
No. of PMUs |
Locations |
PMU equipped bus (%) |
|
7-bus |
2 |
2,4 |
28.6 |
|
14-bus |
3 |
2,6,9 |
21.4 |
|
30-bus |
7 |
1,5,10,12,15,18,27 |
23.3 |
The output of the proposed technique has been compared with some established techniques, such as Integer linear programming [6] and heuristic approach [8] to verify the effectiveness which is shown in Table 3 and 4. Proposed approach for normal operating condition has been compared to these two methods. The proposed method has also been compared with Modified binary COA algorithm and a heuristic method for considering ZIB effects.
Table 3. Comparison table for normal operation
|
Methods |
7-bus |
14-bus |
30-bus |
|
Xu [6]- ILP Optimization |
NR* |
4 |
10 |
|
Roy [8]- Heuristic Approach |
NR* |
4 |
10 |
|
Proposed Approach |
2 |
4 |
10 |
*NR=Not Reported
Table 4. Comparison table considering ZIB effects
|
Methods |
7-bus |
14-bus |
30-bus |
|
Dalali [5]- MBCOA Optimization |
NR* |
3 |
7 |
|
Roy [8]- Heuristic Approach |
NR* |
3 |
7 |
|
Proposed Approach |
2 |
3 |
7 |
*NR=Not Reported
In this paper, a new concept has been proposed to solve the OPP problem for continuous monitoring of a power system. Some important graph-theoretic terms have been used to model the spanning tree configuration of the test cases. Strategic PMU placement location has been pointed in the modified configuration. The proposed technique has been applied to some standard test system to verify the fruitfulness of it. The verification has been carried out for NOC as well as considering ZIB. The output of this simple technique has been compared with some well-established techniques.
[1] Phadke, A.G. (1993). Synchronized phasor measurements in power systems. IEEE Computer Applications in Power, 6(2): 10-15. https://doi.org/10.1109/67.207465
[2] Kezunovic, M., Sakis, M., Vaithianathan, V., Vijay, V.L. (2014). Application of Time-Synchronized Measurements in Power System Transmission Networks. Power Electronics and Power Systems. Springer International Publishing.
[3] PHADKE, A.G., Tianshu, B.I. (2018). Phasor measurement units, WAMS, and their applications in protection and control of power systems. Journal of Modern Power Systems and Clean Energy, 6(4): 619-629. https://doi.org/10.1007/s40565-018-0423-3
[4] Mazhari, S.M., Monsef, H., Lesani, H., Fereidunian, A. (2013). A multi-objective PMU placement method considering measurement redundancy and observability value under contingencies. IEEE Transactions on Power Systems, 28(3): 2136-2146. https://doi.org/10.1109/TPWRS.2012.2234147
[5] Dalali, M., Hossein, K.K. (2016). Optimal PMU placement for full observability of the power network with maximum redundancy using modified binary cuckoo optimisation algorithm. Transmission Distribution IET Generation, 10(11): 2817-2824. https://doi.org/10.1049/iet-gtd.2016.0287
[6] Xu, B., Abur, A. (2004). Observability analysis and measurement placement for systems with PMUs. In IEEE PES Power Systems Conference and Exposition, NY, USA, pp. 943-946. https://doi.org/10.1109/PSCE.2004.1397683
[7] Rahman, N.H.A., Zobaa, A.F. (2017). Integrated mutation strategy with modified binary PSO algorithm for optimal PMUs placement. IEEE Transactions on Industrial Informatics, 13(6): 3124-3133. https://doi.org/10.1109/TII.2017.2708724
[8] Saha Roy, B.K., Sinha, A.K., Pradhan, A.K. (2012). An optimal PMU placement technique for power system observability. International Journal of Electrical Power & Energy Systems, 42(1): 71-77. https://doi.org/10.1016/j.ijepes.2012.03.011
[9] Sodhi, R., Srivastava, S.C., Singh, S.N. (2011). Multi-criteria decision-making approach for multistage optimal placement of phasor measurement units. Transmission Distribution IET Generation, 5(2): 181-190. https://doi.org/10.1049/iet-gtd.2009.0709
[10] Ghosh, P.K., Chatterjee, S., Saha Roy, B.K. (2017). Optimal PMU placement solution: graph theory and MCDM-based approach. Transmission Distribution IET Generation, 11(13): 3371-3380. https://doi.org/10.1049/iet-gtd.2017.0155
[11] Rios, M.A., Gómez, O. (2011). Identification of coherent groups and PMU placement for inter-area monitoring based on graph theory. 2011 IEEE PES Conference on Innovative Smart Grid Technologies Latin America (ISGT LA), Medellin, Colombia. https://doi.org/10.1109/ISGT-LA.2011.6083180
[12] Chen, W.K. (1997). Graph Theory and Its Engineering Applications. World Scientific.
[13] Bondy, J.A., Murty, U.S.R. (1976). Graph Theory with Applications. New York: Elsevier Science Ltd/North-Holland.
[14] Matpower Directories [Online]. Available: http://www.pserc.cornell.edu/matpower/docs/ref/matpower5.0/menu5.0.html, accessed on Feb. 15, 2020.