Md Sarfaraz Alam* | Arunachalam Muthiah | Urmi Ravindra Salve
© 2020 IIETA. This article is published by IIETA and is licensed under the CC BY 4.0 license (http://creativecommons.org/licenses/by/4.0/).
OPEN ACCESS
Plenty of research studies in thermal comfort have been conducted in varied areas viz. schoolrooms and houses, industrial workplaces. However, limited studies have been witnessed in areas of commercial kitchens such as hotels, restaurants, and hostel mess kitchen. Current studies pertaining to thermal comfort have been organized into two different types of railway pantry cars kitchen available in India, between August and September 2018. The chef's activities are almost identical in these two pantry cars, but the insulation value of the clothing is slightly different, then it is a curiosity to know that their comfort temperature is the same or different. A little different sum of chefs (respondents) comfort in the research of each pantry car kitchens. In both pantry car kitchen, similar monitoring equipment was used. An implication of this study demonstrates that chef’s comfort temperatures and comfort range of temperature were found to be similar in both the pantry car kitchen. While it has also been found that the comfort temperature value of both types of pantry car kitchen chef's is slightly less than the value of the comfort temperature on the comfort study in different areas.
thermal comfort, comfort temperature, comfort range, air temperature, clothing insulation, India, rail
A thermal comfort studies are generally done in permanent, or semi-permanent buildings, captured the same person, such as housing, office and classrooms. And few thermal comfort studies have also focused on the comfort temperature above the natural ventilated building and climatic area. However, some thermal comfort studies have been done especially in commercial kitchens such as hotels, restaurants and home kitchens in a developed country. While in India, the study of thermal comfort is also mentioned in a few articles in the kitchen environment. Globally, studies related to thermal comfort has not been yet conducted in the railway pantry kitchen. Therefore, in this research, the study of thermal comfort is presented in relation to the railway pantry care chefs working primarily in the Indian Railway pantry car's kitchen and its comfort temperature is reported.
In addition, consecutive thermal comfort research studies had occurred in two different types of pantry car kitchen, such as non-air-conditioned and air-conditioned. The cooking process is almost equal in both of these types of railway pantry car kitchens, but the cooking installation height is different [1].
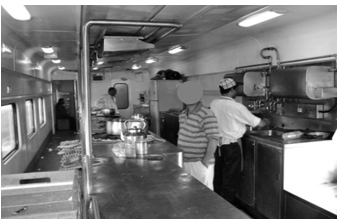
Figure 1 demonstrate the non-air-conditioned pantry car kitchen. In India, this type of coach was established in 1952 and production started on 2 October 1955. Most of this type of non-air-conditioned pantry car coach is being used in every medium and long-distance trains in India [2]. There are 4 to 5 cooking chefs and 1 or 2 pantry car staff. The dimensions of non-air-conditioned types of pantry car models are; length over buffer-22.3 (m), length over head stock (body)-21.336 (m), width-3.245 (m), and height of the coach body-3.111 (m). Corten steel and mild steel material are consumed to fabricate these types of pantry car models [1, 3, 4]. There is a difference in the weight of the bogies "general coaches are lighter than sleepers and A/C coaches" [3].
Figure 1. Non-air-conditioned pantry car kitchen
Figure 2 demonstrate the air-conditioned pantry car kitchen. This type of coach was established with the help of Germany in 1998, in Indian Railways and it was first introduced in some trains in 2000. At present, the number of pantry car coaches of this type is very low; it is available in only a few trains [2]. The worst problem in this type of pantry car kitchen is that it takes a lot of time to cook. And it does not make much food in it because it has an air-conditioned facility and it does not maintain its temperature. There are also 4 to 5 cooking chefs and 1 or 2 pantry car staff in this. The dimensions of air-conditioned types of pantry car models are; length over buffer-24.0 (m), length over head-stock (body)-23.54 (m), width-3.24 (m), and height of the coach body-2.941 (m). Stainless steel material is consumed to fabricate these types of pantry car models [1, 4]. The carrying capacity of this type of coach model is 10% higher than other models. Models of this type of coach compartments are lighter than non-air-conditioned compartments [1].
Figure 2. Air-conditioned pantry car kitchen
Essentially reasons for comparing these two pantry cars are, at first, both are different in terms of design and structure; Secondly, indoor thermal environment is quite different during the cooking process because they use different heating appliances and cooking equipment; Thirdly, there is almost the same type of activity during cooking process in a both pantry cars but the chefs wear slightly dissimilar insulations of cloth. The research questions are (1) whether chefs participating in the thermal comfort research of the two pantry cars kitchen would have different and equal comfort temperatures; (2) What is the chef’s comfort temperatures and comfort range of temperature? The following literature review explains the previous researcher findings and results which are relative to thermal comfort temperatures and comfort range of temperature in different countries.
There are several reported thermal comfort studies having been conducted in different climates have shown that the respondent comfort temperature in naturally ventilated office block (NV) was higher than air-conditioned office block (AC). In a hot weather, individuals who are wide-open to NV office block with high indoor temperature perceived more contented than people living in AC office block with low temperatures. A thermal comfort study was conducted on respondents from Singapore De Dear et al. [5] in which respondents inside the NV office block were contented at working temperature (28.5℃ To), whereas respondents inside the AC office block were contented at a lower level of temperature (24.2℃ To). Another study was done by Bush [6], in Thailand at which respondents in NV office block were contented at an effective temperature (28.5℃ ET) which was more than the respondents in AC office block, who were contented at an effective temperature (24.5℃ ET). The thermal comfort studies conducted by Yang and Zhang [7] have shown that respondents were felt contented at temperature 28.3℃ in NV edifices, while people living in AC edifices were feeling contented at temperature 27.7℃, which was lower by 0.6℃ as compared to air temperature. Another thermal comfort study conducted by De Vecchi et al. [8] has confirmed; respondents outside the AC coverage area were more bigoted to upper temperatures as compared to those who are not accustomed to AC environment. It recommended; through entity uncovered to AC edifices with an inferior temperature, individuals to be contented in an inferior temperature than those who are unexposed to AC edifices. In 1979, Ballantyne [9] conducted his research in Port Moresby; he presented that; local tropical individuals who had lived in a tropical climate for a long time were feeling comfortable at the temperature of 26.7℃ Ta, however; his fellow researcher Caucasian was feeling comfortable at air temperatures below 25℃ Ta. And a research conducted in 2012 by Arsandrie et al. [10] in Indonesia with little revenue groups, has been stated that the average comfort temperature observed was 32.5℃ Ta, being much higher than apart cities located in Asia.
In this research regarding investigation of the thermal comfort estimation; it was established that the comfort group width ranges between 30 to 35℃ Ta. But, the majority of the individuals have the liking for the small range values varying between 33-34℃ Ta.
The ASHRAE standards as developed by prominent researcher viz. De Dear et al. [11] and Breger & de Dear [12], built on the reassessed information on the thermal comfort research around the global. In which depicts that the comfort temperature is in the association with the regular monthly temperature at any specified position. Those individuals who live in high ambient temperature have great comfort temperature than people living in low ambient temperature. The comfort temperature equation was first exposed in the research of Humphreys [13]. It has proved that the comfort temperature can be acquired from the average outdoor temperature:
Tc = 0.534 .To + 11.9 (1)
Legend, Tc - comfort temperature and To - average outdoor temperature.
However, the comfort equation demonstrates that the comfort temperature of the respondent will also be higher as a result of the high average outdoor temperature.
The same study conducted by Auliciems and Szokolay [14] had proposed an equation for comfort temperatures, which was for the NV and AC edifices:
Tc = 0.31 .To + 17.6 (2)
Similarly, Nicole et al. [15] have showed many studies under various climatic circumstances in Pakistan, they recognized a relationship amid comfort temperature and outdoor temperature:
Tc = 0.38 .To + 17.0 (3)
In pursuance to all the previous comfort studies, there is a common feature in proposed equations. In the normal thermal comfort study, all four physical variables like; Ta - air temperature, Tg - globe temperature, RH - relative humidity, and Va - air velocity are taken into consideration, which is more responsible for thermal sensation [16-18]. Therefore, all the four physical variables have been taken into the present study.
The purpose of this work is to compare the indoor working conditions between the kitchens of two different types of railway pantry cars in Indian Railways.
2.1 Sample, period and location
In this study, a random sample of size had been estimated as ~29 from a confidence level of 95%, confidence interval of 20%, total chef population found to be 1360 from 338 trains (which includes both types of trains). Present work, a total of six "non-air-conditioned-N-AC" and "air-conditioned-AC" railway pantry cars were taken, in which 29 chefs participated. There were 19 chefs from four Non-AC and 10 chefs from two AC trains. All the chefs were from different states. Because of safety and security intentions, the duration of this study was fixed for only sixteen days. Therefore, the period of study was carefully chosen in the last two weeks of the August month and the first week of September month, 2018 during the summer session, including some of the warmest days of the month. Two climate zones: humid and sub-tropical, tropical wet and dry were taken in this study as per the different climatic zones in India based on the Koppen classification system which is illustrated in Figure 3. In humid and subtropical climate zone, a total of 4 railway pantry cars were taken in which 14 chefs from 3 "N-AC" and 5 chefs from 1 "AC" trains. However, in a tropical wet and dry climate zone, a total of 2 railway pantry cars were taken in which 5 chefs from 1 "N-AC" and 5 chefs from 1 "AC" trains.
Figure 3. Different climatic zone in India
2.2 Description of physical measurement
According to previous thermal comfort studies, there are four environmental factors for thermal comfort [18]. In this study, all four environmental parameters were also recorded such as: Tg - globe temperature, Ta - air temperature, RH - relative humidity, and Va - air velocity.
The study comprises environmental parameters like (Ta, RH, Va) that were measured with the help of a handheld anemometer: kestrel weather meter 3000 model. Although Tg was recorded with the help of a "6-inch black globe thermometer". A description of the equipment used in this study such as "range and accuracy" is illustrated in Table 1.
The data of environmental parameters like Ta, RH, and Va were measured according to ASHRAE 55 standard [19] and Simone & Olesen [20], which measured at 0.3 meters near the workstation and 1.1 meters above the workstation floor in the commercial kitchen. While Tg was recorded at the center of the cooking area, through which the mean radiant temperature was estimated. As per the Mishra and Ramgopal [21] mean radiant temperature (tmrt) was estimated from the combination of the tg - globe temperature, ta - air temperature, and va - air velocity using Eq. (4).
$t_{\text {mrt}}=\left[\left(t_{g}+273\right)^{4}+\frac{1.1 \cdot 10^{8} v_{a}^{0.6}}{\varepsilon \cdot D^{0.4}} \cdot \times\left(t_{g}-t_{a}\right)\right]^{1 / 4}-273$ (4)
where, D - Globe diameter and ε - Emissivity of the globe surface (has taken as 0.95).
All these physical measurements were recorded during the meal preparation time like; morning (breakfast-7:00 am), day (lunch-11:30 am), evening (snacks-4:00 pm), and night (dinner-6:30 pm). Due to the dynamic nature of the trains and very harsh working conditions in the pantry car, the data were measured inside the kitchen of the railway pantry car 10-15 minutes with an interval of 5s to 10s. These measurements were recorded as much as possible without troubling the respondent’s activities.
In this study, we are not reporting the different time of the cooking period's impact with the seasonal and climatic variations inside the kitchen of the pantry cars. We have analyzed this in another study [18], according to this study there is no difference inside the pantry car during climate and seasonal changes during the different cooking period. Present study, the average values of the environmental parameters of all cooking periods have been analyzed simultaneously, which are shown in Table 3.
Table 1. Measuring equipment’s and its descriptions
|
Equipment’s |
Variables |
Accuracy (ranges) |
|
Kestrel anemometer-3000 |
Ta (℃) |
-5° to +95℃ (-29.0℃ to +70.0℃ |
|
Va (m/s) |
± 0.1 m/s (0.4 m/s to 60 m/s) |
|
|
RH (%) |
±3% (5% to 95%) |
|
|
6"-black-globe thermometer |
Tg (℃) |
N.A (-5° to +95℃) |
2.3 Description of subjective measurement
For the assessment of the thermal comfort in the working environment, the occupant's perceptual responses are very necessities [18]. This study standard checklist was adopted to elicit feedback from workers working in the kitchen of pantry cars which is illustrated in Table 2.
Table 2. Checklist used for thermal comfort survey
|
Demographic details |
Current activity level (met) |
ASHRAE 7- point TSV |
|
Age (years) |
Sitting |
Cold (-3) |
|
Weight (kg) |
Standing |
Cool (-2) |
|
Height (ft) |
Walking |
Slightly cool (-1) |
|
Clothing (clo) |
Medium |
Neutral (0) |
|
|
Moderate |
Slightly warm (+1) |
|
|
Heavy movement |
Warm (+2) |
|
|
|
Hot (+3) |
The first part of this checklist was the demographic details of the chefs like; age, weight, height, and clothing insulation values. In the second part, metabolic rates or activity levels values were noted. In the third part, the ASHRAE seven-point thermal sensation scale (TSV): -3 "cold" to +3 "hot" was adopted as required to predict the comfort temperature of the chefs.
Several other scales are also available for predicting thermal comfort, which is not reported here. This is shown in the next study.
3.1 Analysis of statistical data of respondents in both types of pantry cars
In this study, both pantry cars (Non-AC and AC) have been taken in those workers who were involved in the cooking process activity. At the Non-AC and AC pantry cars, all of the respondents were standing during the interview. During the cooking process activity in both types of railway pantry car kitchen, metabolic rate was estimated to be 2.0 met (116 w/m2, standing, medium activity) [22].
Entirely data was tabularized and investigated Microsoft Office Excel 2013, whereas statistical testing was accompanied for “Statistical Package for the Social Sciences (SPSS)” version 23.
In Non-AC and AC Pantry cars, there were 19 and 10 cooking workers respectively. In which all the chefs were men who participated in this study because only the male chef works in Indian Railway's pantry car.
In this study, subjective data of the chefs have been combined with the duration of all the cooking times, and considering the average values have been done. This study has been completed only in the summer season. Whereas the division of climatic and seasonal changes is not illustrated in the outcomes of this study. It has been analysed in a separate study as discussed above. Table 3 demonstrated the numerical data of chefs who take part in this research.
Table 3. Numerical data of the respondents in both Indian Railway (IR) pantry cars
|
Pantry cars |
Stats value |
Stature (ft) |
Mass (kg) |
Age (year) |
Clothing (clo) |
|
Non-A.C |
n |
19 |
19 |
19 |
19 |
|
Min |
5.5 |
55 |
27 |
0.3 |
|
|
Mean |
5.6 |
67 |
37 |
0.5 |
|
|
Max |
6 |
84 |
51 |
0.61 |
|
|
SD |
0.2 |
7 |
6.7 |
0.11 |
|
|
A.C |
n |
10 |
10 |
10 |
10 |
|
Min |
5.8 |
58 |
28 |
0.65 |
|
|
Mean |
5.5 |
67 |
34 |
0.77 |
|
|
Max |
5.11 |
77 |
43 |
0.99 |
|
|
SD |
0.3 |
6 |
5.3 |
0.11 |
In the Non-AC pantry car kitchen, the chef’s masses were between 55 and 84 kg, with a mean of 67 kg and a Standard Deviation of 7 kg. In terms of height in the Non-AC pantry car, the smallest chef was 5.5 ft and the longest was 6 ft, with averaging 5.6 ft and a standard deviation of 0.2 ft (SD). And the age ranged was between 27 years and 51 years, with an average of 37 years and an SD of 6.7 years. The assessed clothing insulation value of the chefs was ranged from 0.3 to 0.61 clo, with an average of 0.5 clo and an SD of 0.11 clo, where (1 clo = 0.155 K. m2. W-1). Because most of the chefs usually wear shirts, normal trousers, and slippers in Non-AC pantry cars, while others wear lungi’s and vest, only in the hot season. While in this type of pantry car, only a few chefs make use of apron during the cooking process. For this reason, the value of the 'clo' was low estimated in this type of pantry car.
In the AC pantry car kitchen, the chef’s weights were between 58 and 77 kg, with an average of 67 kg and an SD of 6 kg. In terms of height in the AC pantry car, the smallest chef was 5.8 ft and the longest was 5.11 ft, with averaging 5.5 ft and a standard deviation of 0.3 ft (SD). And the age ranged was between 28 years and 43 years, with an average of 34 years and an SD of 5.3years. The estimated clothing insulation value of the AC pantry car kitchen chefs was between 0.65 and 0.90 clo, with an average 0.77 clo and an SD of 0.11 clo. The 'clo' value of this pantry car kitchen chef was estimated more. Because in this type of pantry car chefs wear an appropriate dress such as full trousers, full sleeve shirt, cap, shoe, and apron. In this pantry car, due to being air-conditioned the chef wears the same type of dress in every season which is provided by the railway authority. Therefore, the clothing value is slightly different in both types of pantry cars. But we have to see what its comfort temperature is in both which is shown in the next result.
3.2 Data of indoor thermal comfort parameters and the distribution of respondents’ thermal sensation
In Table 4, AC and Non-AC pantry car, exhibit the data of measured indoor thermal comfort parameters, while Table 5 displays the distribution of thermal sensation votes (TSV) in Non-AC and AC pantry cars.
Table 4. Measured data of indoor thermal comfort parameters of pantry car
|
Pantry car |
Statistical parameter |
Ta (℃) |
RH (%) |
Va (m/s) |
tmrt (℃) |
|
Non-A.C |
Min |
29 |
71 |
0 |
30 |
|
Mean |
34 |
76 |
0.03 |
34 |
|
|
Max |
37 |
80 |
0.20 |
37 |
|
|
SD |
2 |
2 |
0.06 |
2 |
|
|
A.C |
Min |
26.1 |
69 |
0.00 |
28 |
|
Mean |
29 |
75.27 |
0.01 |
29.5 |
|
|
Max |
31.3 |
87 |
0.10 |
31 |
|
|
SD |
6.3 |
13.9 |
0.06 |
6.1 |
As depicted in the above Table 4 environmental parameters of thermal comfort like; mean radiant temperature, air temperature, relative humidity, air velocity does not comply with ASHRAE 55 standards in both types’ kitchen of railway pantry car in Indian Railway. According to ASHRAE 55 standard, the recommended range of the comfort temperature should be for the summer season "24.5-27.0ºC" and for the winter season "19.5-22.5ºC". Similarly, the percentage of relative humidity ranges should be 30% to 60% for comfortable, 40% to 60% for optimum, and 50% for the ideal. While the suitable air velocity range recommended for thermal comfort conditions in the "summer season <0.25 m/s and winter season <0.15 m/s" [18].
Table 5 illustrates the frequencies count of thermal sensation votes (TSV) in both "Non-AC and AC" pantry cars on the Indian Railway (IR).
In the Non-AC pantry car, from the frequencies count, it was observed that out of 19 respondents, 6 (31.57%) felt warm thermal sensation and 13 (68.48%) of respondents voted to feel the hot thermal sensation. It meaning that on average, respondents felt uncomfortably hot during the working period.
Similarly, in the AC pantry car, from the frequencies count, it was found that out of 10 respondents, 6 (60%) were felt slightly warm thermal sensation, and 4 (40%) of respondents voted were on the feel warm thermal sensation sides. For a comfortable working environment, according to ASHRAE 55 standard, the thermal perception votes of the occupants should be followed the recommended central three categories vote like "slightly cool (-1), neutral (0), slightly warm +1) [18]. In the present research, the thermal sensation vote of the pantry car chefs did not follow the recommended limit.
Hence, it could be an incident that respondents felt uncomfortably warm working environment. Therefore, it could be inferred as there is no difference between Non-AC and AC pantry car kitchen based on the thermal comfort perceiver’s point of view.
Table 5. Frequencies count of TSV in the two different Indian Railway (IR) pantry cars
|
Thermal sensation votes (TSV) |
Non-A.C pantry car |
A.C Pantry car |
|
Cold (-3) |
0 |
0 |
|
Cool (-2) |
0 |
0 |
|
Slightly cool (-1) |
0 |
0 |
|
Neutral (0) |
0 |
0 |
|
Slightly warm (+1) |
0 |
6 |
|
Warm (+2) |
6 |
4 |
|
Hot (+3) |
13 |
0 |
|
Mean vote |
2.6 |
1.4 |
|
Number of respondents |
19 |
10 |
3.3 Neutral temperature (Tn) and comfort range (Tcr) of respondents in the Non-AC and AC pantry cars
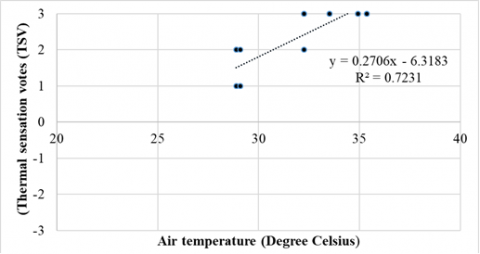
In this explication, Figure 4 demonstrates the regression line of TSV on Ta in the kitchen of Non-AC and AC pantry cars on IR. This regression derived an Eq. (5) of:
TSV = 0.2706 . Ta – 6.3183 (5)
As shown in Table 6 demonstrates the neutral (comfort) temperature (Tn) and comfort temperature range (Tcr) of respondents in Non-AC and AC pantry cars. A comfort temperature was estimated rooted in 95% of respondent’s contentment with the thermal environment, whereas the comfort temperature range was rooted in 90% of respondent’s contentment with the thermal environment. In both “Non-AC and AC” pantry cars, the respondent’s Tn was 23.5℃ Ta, whereas the Tcr was 20 – 27.02℃ Ta. However, in the kitchen of both types of railway pantry cars, the estimated R-square value was 0.72 as can be seen in Table 6. From this, it is inferred that both pantry car kitchen chefs have the same comfort temperature. While considering the study of thermal comfort in many NV buildings environments R-squared is usually quite low. Above-mentioned as in the study of Rijal et al. [23] in Japan, in which out of the majority of studies R2 was less than 0.5, and similarly, a study was done by Feriadi and Wong [24] in Indonesia, in which the value of R2 was found to be < 0.2. Although, in the present research, the R-squared value in both the railway pantry car kitchen was comparatively high, higher by 0.52 as compared to the findings of other researchers reporting on thermal comfort. In a few studies, in India and various countries, some work has been done to compare the comfort temperature of the respondents. The comfort temperature range (20 – 27.02℃ Ta) of this study is being compared to any other study.With an R-squared of 0.7231, the association between “TSV” and “Ta” is found significant at a 99% confidence level.
Figure 4. Regression model of TSV and Ta in Non-AC and AC railway pantry cars
Table 6. Neutral temperature (Tn) and comfort temperature range (Tcr) in terms of air temperature
|
Non-AC/AC pantry car |
Statistics |
|
Neutral temperature (Tn) |
23.5 ℃ Ta |
|
Comfort temperature range (Tcr) |
20 – 27.02 ℃ Ta |
|
Linear regression model |
TSV = 0.2706 Ta – 6.3183 |
|
Coefficient of Correlation (r) |
0.72 |
|
Significant |
p < 0.05 |
In the research of Chandel and Agarwal [25] in Himachal Pradesh, the minimum comfort temperature in Manali was 18.46℃ and the maximum comfort temperature was found at 29.05 in July. Based on the adaptive approach, a study organized by Indraganti [26] was shown in the NV flats of Hyderabad throughout the summer-time and rainy season. Comfort temperatures of respondents in this study (23.5 ℃ Ta) were found to be lower than respondents’ Tn than in the earlier comfort study in Himachal Pradesh, India (29.23℃ Ta), Which has less ambient temperature than Himachal Pradesh. It seems that the outcome provides an indication of research that people are not comfortable in warmer environments, which is lower in comparison to those with high temperatures. The Tn of the respondents in this study (23.5℃ Ta) is found to be below the Tcr, grounded on earlier comfort research carried out in the south-east Asian countries (24.1℃ to 30.0℃ Ta).
The investigation recommenced a comfort band of 26 - 32.5℃ and the comfort temperature of 29 to 23℃, and the relative humidity range of 17% - 78%. Karyono et al. [27] conducted research on thermal comfort studies in NV edifices in Indonesia. This study revealed the comfort temperatures of the respondents (27.7℃, and 27.3℃) were found to be within the Tcr, founded on earlier thermal comfort research carried out in Asian cities (Ta ranges 24.1℃ to 30.0℃). A research conducted by Arsandrie et al. [10] a low-income group in Surakarta, Indonesia, reported that the average Tn established as 32.5 ° C, which has been found to be more in Asian cities. Although the thermal comfort estimation in this investigation established that the comfort band has a width of 30 to 35 ℃. However, the maximum people preferred a small range, ranging between 33-34℃ [28].
The present study illustrated a typical thermal comfort assessment on the kitchen of the railway pantry car using physical and subjective measurements. In this study comfort temperature “23.5℃ Ta” and comfort temperature range (20 - 27.02℃ Ta) of respondents was found the same for both "Non-AC and AC" types of the pantry car with a 95% of confidence level. Also, it was predicted that there is no difference in thermal perception votes of chefs on Non-AC and AC pantry car kitchen. In addition, the variables such as the height, weight, and age of the occupants in the pantry cars were almost identical. Although differences have found in insulation values of clothing, such as in the Non-AC pantry car, the estimated value of clothing was 0.5 clo, and similarly, in the AC pantry car, it was 0.77 clo. Whereas it has no effect on the comfort temperature of the respondents in both types of pantry cars.
In this study determined only summer season data because it was sufficient to achieve the goal of the study. Simultaneous data of summer and winter seasons can contribute to design intervention like; ventilation, air supply system, and exhaust hood inside the kitchen of pantry car. The outcomes of present research will help to implement the HVAC "heating, ventilation, and air conditioning" concept of the vehicle and the built environment while designing the indoor space of the pantry car kitchen. Further to investigate the applicability of various thermal comfort indices during meal preparation time on the pantry car kitchen.
|
D |
globe diameter, m |
|
clo |
clothing insulation, K. m2. W-1 |
|
Ta |
air temperature, ℃ |
|
Tg |
globe temperature, ℃ |
|
Tmrt |
mean radiant temperature, ℃ |
|
TSV |
Thermal sensation votes, (-3, +3) |
|
RH |
relative humidity, % |
|
Va |
air velocity, m/s |
|
Tn |
neutral temperature, ℃ |
|
Tcr |
comfort temperature range, ℃ |
|
To |
outdoor temperature, ℃ |
|
ET |
effective temperature, ℃ |
|
Greek symbols |
|
|
ε |
emissivity of the globe surface |
[1] Patil, P., Mukul, S., Mathur, S. (2012). How to improve catering services in Indian railways. International Union of Railways, 7-52.
[2] Mane, S.D. (2017). Indian railways passenger coaches: safety features and technologies adopted. International Journal of Engineering Technology Science and Research, 4(4): 323-327.
[3] Kaushik, J., Agarwal, A., Sarda, M., Sanjay, V., Das, A. K. (2016). Study of fire propagation and soot flow in a pantry car of railway locomotive. International Journal of Computer and Systems Engineering, 10(9): 1703-1708. https://doi.org/10.5281/zenodo.1127174
[4] Raut, A.A., De, J. (2018). Ergonomic Design and Development of Material Handling Equipment for Pantry Car Personnel. In: Ray P., Maiti J. (eds) Ergonomic Design of Products and Worksystems - 21st Century Perspectives of Asia. Managing the Asian Century. Springer, Singapore. https://doi.org/10.1007/978-981-10-5457-0_9
[5] De Dear, R.J., Leow, K.G., Foo, S.C. (1991). Thermal comfort in the humid tropics: Field experiments in air conditioned and naturally ventilated buildings in Singapore. International Journal of Biometeorology, 34(4): 259-265. https://doi.org/10.1007/BF01041840
[6] Busch, J. (1992). Thermal responses to the Thai office environment. ASHRAE Transactions, 96(1): 859-872.
[7] Yang, W., Zhang, G. (2008). Thermal comfort in naturally ventilated and air-conditioned buildings in humid subtropical climate zone in China. International Journal of Biometeorology, 52(5): 385-398. https://doi.org/10.1007/s00484-007-0133-4
[8] De Vecchi, R., Candido, C., Lamberts, R. (2012). Thermal history and its influence on occupants’ thermal acceptability and cooling preferences in warm humid climates: A new desire for comfort. In: Proceedings of the 7th Windsor Conference: The Changing Context of Comfort in an Unpredictable World Cumberland Lodge, Windsor, UK.
[9] Ballantyne, E.R., Hill, R.K., Spencer, J.W., Bartlett, N.R. (1979). A survey of thermal sensation in Port Moresby, Papua New Guinea. Commonwealth Scientific and Industrial Research Organization: Canberra, Australia.
[10] Arsandrie, Y., Kurvers, S.R., Bokel, R.M.J., Van der Linden, A.C. (2012). Comfort Temperatures for the Low-Income Group in a Hot-Humid Climate. In Proceedings of the 7th Windsor Conference: The Changing Context of Comfort in an Unpredictable World, Windsor, UK.
[11] De Dear, R., Brager, G.S. (1998). Developing an adaptive model of thermal comfort and preference. American Society of Heating, Refrigerating and Air-Conditioning Engineers (ASHRAE): Atlanta, GA, USA.
[12] Brager, G.S., De Dear, R. (2001). Climate, comfort, & natural ventilation: a new adaptive comfort standard for ASHRAE standard 55. In: Proceedings of Windsor Conference: Moving Thermal Comfort Standards into the 21st Century, Windsor, UK.
[13] Humphreys, M. (1978). Outdoor temperatures and comfort indoors. Batiment International, Building Research and Practice, 6(2): 92-92. https://doi.org/10.1080/09613217808550656
[14] Auliciems, A., Szokolay, S.V. (1997). Thermal Comfort: PLEA Note 3. Passive and Low Energy Architecture International in association with Department of Architecture. The University of Queensland, Brisbane, Qld, Australia.
[15] Nicol, F., Jamy, G.N., Sykes, O., Humphreys, M., Roaf, S., Hancock, M. (1994). A survey of thermal comfort in Pakistan toward new indoor temperature standards. Final Report to the Overseas Development, Administration Published by Oxford Brookes University, School of Architecture, UK.
[16] ISO, E. (2006). 14505-2. Ergonomics of the thermal environment-Evaluation of thermal environments in vehicles-Part 2: Determination of equivalent temperature. Geneva (Switzerland).
[17] ISO, E. (2004). 5265. Ergonomics of the thermal environment. Risk assessment strategy for the prevention of stress or discomfort in thermal working conditions.
[18] Alam, M.S., Arunachalam, M., Salve, U.R. (2019). A pilot study on thermal comfort in Indian Railway pantry car chefs. Journal of Physics: Conference Series, 1240(1): 012033. https://doi.org/10.1088/1742-6596/1240/1/012033
[19] American Society of Heating, Refrigerating and Air-Conditioning Engineers. (2010). Thermal Environmental Conditions for Human Occupancy. Atlanta: ASHRAE Standard-55.
[20] Simone, A., Olesen, B.W. (2013). Thermal environment evaluation in commercial kitchens of United States. Clima 2013, Prague, Czech Republic.
[21] Mishra, A.K., Ramgopal, M. (2014). Thermal comfort in undergraduate laboratories—A field study in Kharagpur, India. Building and environment, 71: 223-232. https://doi.org/10.1016/j.buildenv.2013.10.006
[22] Ainsworth, B.E., Haskell, W.L., Whitt, M.C., Irwin, M.L., Swartz, A.M., Strath, S.J., Jacobs, D.R. (2000). Compendium of physical activities: an update of activity codes and MET intensities. Medicine and Science in Sports and Exercise, 32(9 Supp1): S498-S504. https://doi.org/10.1097/00005768-200009001-00009
[23] Rijal, H.B., Humphreys, M., Nicol, F. (2015). Adaptive thermal comfort in Japanese houses during the summer season: Behavioral adaptation and the effect of humidity. Buildings, 5(3): 1037-1054. https://doi.org/10.3390/buildings5031037
[24] Feriadi, H., Wong, N.H. (2004). Thermal comfort for naturally ventilated houses in Indonesia. Energy and Buildings, 36(7): 614-626. https://doi.org/10.1016/j.enbuild.2004.01.011
[25] Chandel, S.S., Aggarwal, R.K. (2012). Thermal comfort temperature standards for cold regions. Innovative Energy Policies, 2: 1-5. https://doi.org/10.4303/iep/E110201
[26] Indraganti, M. (2010). Thermal adaption and impediments: Findings from a field study in Hyderabad, India. Adapting to Change: New Thinking on Comfort, Cumberland Lodge, Windsor, UK, 9-11.
[27] Karyono, T.H., Sri, E., Sulistiawan, J.G., Triswanti, Y. (2015). Thermal comfort studies in naturally ventilated buildings in Jakarta, Indonesia. Buildings, 5(3): 917-932. https://doi.org/10.3390/buildings5030917
[28] Camaraza-Medina, Y. (2020). Current trends in Cuba on the environmental impact and sustainable development. TECNICA ITALIANA-Italian Journal of Engineering Science, 64(1): 103-108. https://doi.org/10.18280/ti-ijes.640116