Abdelkarim El Khantach* | Mohamed Hamlich | Noureddine Belbounaguia
OPEN ACCESS
False measurements pose a major challenge to the stable operation of the smart grid. This paper aims to develop a real-time detection method for false measurements in the smart grid, especially when the error is in the function of Jacobean matrix. Considering its high robustness and excellent short-term prediction effect, the fuzzy time series was selected as the basis for our model. The detection is realized in three steps: fuzzification, fuzzy relationship determination and defuzzification. The established model was tested on a 30-node network using the PSSE. The results show that our model can accurately detect the false measurement that are inputted in the Jacobian matrix, which are not detectable by conventional systems.
false data detection, state estimation, fuzzy time series, smart grid
The smart grid is an electrical system improvement based on advances in information technology, with the aim to provide more efficient and reliable electricity through a demand response and a complete monitoring and control capability [1], Regarded as an evolution of the current power grid, the Smart Grid is a perfect example of a complex system. Specifically, it refers to an optimized power grid integrating the behavior and actions of all users (producers, consumers, consumers, etc.).
The power system became more developed and highly sophisticated through its combination between a physical and a communication system that collects information at various points on the power grid at the right time for the network to operate continuously, safely and reliably. As a result, power systems were increasingly subject more and more to physical cyber-attacks, a situation not seriously approached before such an energetic Internet was developed.
The smart grid infrastructure essentially consists of two-way communication between suppliers and consumers and the SCADA system, which includes a variety of devices (remote terminal units (RTUs) and control centers), communication protocols (DNP 3, Modbus, Profibus, etc.), computers, electrical devices and human-supervised manual processes. This system improved the control and monitoring of processes and ensured a reliable supply of electricity [2].
However, rapid progress in information and communication technologies (SCADA) in the field has created a large area for cyber-physical attacks, both in the communications network and in the metering devices. Especially with the progression of smart meters that are significantly increased, and consequently have produced a high number of network access points, as a result of this, a high flow of false data has been generated through the power system, which compromises the state estimation process, while the frequency of attack threats are supported by protection, detection or mitigation strategies, some types of threats identified have not yet been addressed.
The deployment of a smart grid in an unsafe environment could cause serious consequences such as instability of the grid, fraud in public utilities and energy losses, which consist mainly of energy dissipation. All this requires the establishment of a fault detection and identification system, which can quickly detect faults to avoid cascading events [3, 4].
The measurements are transmitted from the metering devices or the remote terminal unit (RTU) and collected by the SCADA data acquisition monitoring and control system [3, 5], the measurement data (voltage amplitudes and phase angles of the different buses) are evaluated before being communicated to the central office. As well as being a management system for the electrical energy flowing through the electrical grid, the SE provides a conventional method for detecting attacks and can manage a fraction of the aberrant values [6].
The false data measurement injection in the power grid has raised serious concerns for researchers as well as professionals, due to the crucial impact that this can have on the security and efficient management of energy resources. The false measurement attack by injection mainly affects the state variables of the system, such as voltage measurements and associated phase angles; therefore, a secure access to the parameters and topology of the power grid is necessary, as well as the use of more robust new detection algorithms.
We are concerned about the evolution over time of our database in order to predict false and correct measurements. We chose fuzzy time series prediction methods because of their robustness compared to the most commonly used methods in the industry based on the fuzzy time series prediction method using hesitant fuzzy sets [7], as well as their lower computation time requirements that make them the most adaptable for a real time system [8, 9].
The Progress of Smart Grids has led to an effective and reliable improvement of the grid. However, it has created new vulnerabilities related to grid security. Various studies have addressed the subject of smart grid security in two main areas; the first focuses on the cyber-security of the electrical system with regard to the security of means of communication [10-13].
The second component addresses vulnerabilities in electrical infrastructure which are not accompanied by security measures whose access to the Jacobean topological matrix can cause serious damage. Liu et al. [6] have showed how knowledge of the electrical system configuration can be used to introduce bad data into certain state variables and bypass existing techniques for detecting bad measurements.
Studies have shown how to divert the system from state estimation to inject false measurements. Hug et al. [14] in their paper have determined the types and number of signals that can be attacked based on graph theory to determine areas vulnerable to security. Rahman et al. [15] addressed the possibility of implementing a false attack by data injection when the operator uses non-linear state estimation. Sun et al. [16] discussed how to avoid the traditional method of detecting bad data that does not need the input value of the transmission line, but only the topology of the local network. To address the problem of false injections, while Giani et al. [17] have examined the safety of estimating the state of the fully distributed electrical system by increasing the mean square error at the state estimator beyond a predetermined objective. Dan et al. [10] have offered two algorithms for placing encrypted devices in the system to maximize their utility in terms of the increased system security. Liu et al. [18] in their papers have considered the problem of detecting false data as a matrix separation problem. They propose a new mechanism for detecting false data based on the separation of nominal states and anomalies from the electricity grid.
Tang et al. [19] have shown that the conventional approach with the Gaussian noise hypothesis is a particular case of the proposed method; then, by modelling noise with an autoregressive process and selecting a number of subsets of safe counter measurements they examined the problems of state estimation and detection of false injection data into the smart grid when measurements are corrupted by colored Gaussian noise. Bi et al. [20] use the graphical methods for defense strategies of the state variable set.
Other studies have used the automatic learning method to address this subject, where Shavhaug et al. [21] have worked with the Support Vector Machine "SVM" to label false and to correct measurement data, thus the system can identify false measurements after learning its data. However, Esmalifalak et al. [22] have developed two techniques based on machine learning for detecting stealth attacks. The first method uses supervised learning on labelled data and forms a carrier vector machine. The second method does not require training data and detects the measurement deviation. EL-khantach et al. [23] have applied trees algorithm in order to detect the false data measurements according to the Jacobean matrix.
The security of the electricity grid occupies a primordial place in the energy system, the challenge takes a major position in a real-time process. To maintain a harmonious functioning in electrical load management, control, supervision and forecasting, the process is equipped with essential tools that provide accurate measurements.
Figure 1. False data detection process
Real-time power grid monitoring applications are equipped with the state estimator which is designed to resist the effect of measurement errors, the type, position and the accuracy of measurements, as well as the time failure of the smart meter communication system.
By acting on the network topology and the available measurements; algorithms determine the most likely state of the system. The process is described by its state variables, such as voltage at network nodes or currents flowing through network branches. It must comply with physical constraints such as Kirchhoff's laws and the law that connects the primary and the secondary currents of each transformer or voltage regulator [24].
The following equations show the link between the state variables (voltage magnitude and phase angle) and the active powers and the reactive powers.
$\mathrm { P } _ { \mathrm { i } } = \mathrm { V } _ { \mathrm { i } } \sum _ { \mathrm { i } } ^ { \mathrm { N } } \mathrm { V } _ { \mathrm { j } } \left( \mathrm { G } _ { \mathrm { ij } } \cos \theta _ { \mathrm { ij } } + \mathrm { B } _ { \mathrm { ij } } \sin \theta _ { \mathrm { ij } } \right)$ (1)
$\mathrm { Q } _ { \mathrm { i } } = \mathrm { V } _ { \mathrm { i } } \sum _ { \mathrm { i } } ^ { \mathrm { N } } \mathrm { V } _ { \mathrm { j } } \left( \mathrm { G } _ { \mathrm { ij } } \sin \theta _ { \mathrm { ij } } - \mathrm { B } _ { \mathrm { ij } } \cos \theta _ { \mathrm { ij } } \right)$ (2)
$\mathrm { P } _ { \mathrm { ij } } = \mathrm { V } _ { \mathrm { i } } ^ { 2 } \mathrm { G } _ { \mathrm { ij } } - \mathrm { V } _ { \mathrm { i } } \mathrm { V } _ { \mathrm { j } } \left[ \mathrm { G } _ { \mathrm { ij } } \cos \left( \theta _ { \mathrm { i } } - \theta _ { \mathrm { j } } \right) + \mathrm { B } _ { \mathrm { ij } } \sin \left( \theta _ { \mathrm { i } } - \theta _ { \mathrm { j } } \right) \right]$ (3)
$\begin{aligned} \mathrm { Q } _ { \mathrm { ij } } = & - \mathrm { V } _ { \mathrm { i } } ^ { 2 } \left( \mathrm { B } _ { \mathrm { ij } } - \mathrm { B } _ { \mathrm { cij } } \right) \mathrm { G } _ { \mathrm { ij } } - \mathrm { V } _ { \mathrm { i } } \mathrm { V } _ { \mathrm { j } } \left[ \mathrm { G } _ { \mathrm { ij } } \sin \left( \theta _ { \mathrm { i } } - \theta _ { \mathrm { j } } \right) - \right.\\ & \mathrm { B } _ { \mathrm { ij } } \cos \left( \theta _ { \mathrm { i } } - \theta _ { \mathrm { j } } \right) \end{aligned}$ (4)
where,
$\mathrm { P } _ { \mathrm { i } } \quad$ Active puissance at bus i
$\mathrm { Q } _ { \mathrm { i } } \quad$ Reactive puissance at bus i
$\mathrm { P } _ { \mathrm { ij } } \quad$ Active puissance between bus i and j
$\mathrm { Q } _ { \mathrm { ij } } \quad$ Reactive puissance between bus i and $\mathrm { j }$
$\mathrm { V } _ { \mathrm { i } } \quad$ Voltage magnitude in node i
$\theta _ { \mathrm { i } } \quad$ Phase angle in node i
$\theta _ { \mathrm { j } } \quad$ Phase angle in node $\mathrm { j }$
$\theta _ { \mathrm { ij } } \quad$ Phase angle between node i and $j$
$\mathrm { G } _ { \mathrm { ij } } + \mathrm { j } \mathrm { B } _ { \mathrm { ij } }$ Line admittance between bus I and $\mathrm { j }$
The state vector of the measured values is given by X:
$\mathrm { X } = \left( \theta _ { 2 } , \ldots , \theta _ { \mathrm { N } } , \mathrm { V } _ { 2 } , \ldots , \mathrm { V } _ { \mathrm { N } } \right) ^ { \mathrm { T } }$ (5)
where, $\theta _ { \mathrm { k } }$ and $\mathrm { V } _ { \mathrm { k } }$ denote the voltage magnitude and the phase angle at bus $\mathrm { k } \in \{ 1,2 , \ldots , \mathrm { N } \}$ and the first bus (k=1) is chosen as a reference bus and N is the total number of buses.
The state estimator is a main function of the smart grid that has been found to be vulnerable to a large number of attack plans. State estimator is the input function that processes raw measurements of system topology and dynamics to obtain an accurate estimation of state variables, the fundamental state estimator problem can be written as
$\mathrm { z } = \mathrm { h } ( \mathrm { x } ) + \mathrm { r }$ (6)
where, $h ( x ) = \left( h _ { 1 } ( x ) , \ldots , h _ { m } ( x ) \right) ^ { T }$ is the vector of m function linking the measurement and the state variable, and z designates the vector of measurements taken simultaneously by the meters devices and the pseudo-metric, and $r = \left( r _ { 1 } , \dots , r _ { m } \right) ^ { T }$ representing the vector of error measurement that is a random and independent Gaussian variable with zero mean and covariance matrix $\mathrm { h } ( \mathrm { x } ) = \left( \sigma 2 _ { 1 } , \ldots , \sigma 2 _ { \mathrm { m } } \right)$.
The function objective is given as follow:
$\mathrm { J } ( \mathrm { x } ) = \frac { 1 } { 2 } \sum _ { \mathrm { i } = 1 } ^ { \mathrm { m } } \left( \mathrm { z } _ { \mathrm { i } } - \mathrm { h } _ { \mathrm { i } } ( \mathrm { x } ) \right) ^ { 2 } / \mathrm { R } _ { \mathrm { ii } }$ (7)
$\mathrm { J } ( \mathrm { x } ) = \frac { 1 } { 2 } [ \mathrm { z } - \mathrm { h } ( \mathrm { x } ) ] ^ { \mathrm { T } } \mathrm { R } ^ { - 1 } [ \mathrm { z } - \mathrm { h } ( \mathrm { x } ) ]$ (8)
Different algorithms have been proposed to solve the state estimation problem in the power grid [25, 26]. The purpose of state estimation is to solve a system of non-linear equations with, among them, the unconstrained weighted least squares (WLS) method. The weighted least squares approach is formulated on the base of some assumptions made about measurement errors. These errors are considered as independent and distributed random variables; according to a normal distribution of zero mean and known variance [27].
The state estimation is generally calculated by using the weighted Least Square (WLS) methods [25]. The conditions of the first order of optimality are given by:
$\mathrm { g } ( \mathrm { x } ) = \frac { \partial \mathrm { J } ( \mathrm { x } ) } { \partial \mathrm { x } } = \frac { 1 } { 2 } \left\{ - \mathrm { H } ^ { - 1 } ( \mathrm { x } ) \mathrm { R } ^ { - 1 } [ \mathrm { z } - \mathrm { h } ( \mathrm { x } ) ] [ \mathrm { z } - \mathrm { h } ( \mathrm { x } ) ] ^ { \mathrm { T } } \mathrm { R } ^ { - 1 } \mathrm { H } \right\}$ (9)
where, the Jacobean H is given by:
$\mathrm { H } ( \mathrm { x } ) = \frac { \partial \mathrm { h } ( \mathrm { x } ) } { \partial \mathrm { x } }$ (10)
Solve the WLS estimation and obtain the elements of the measurement residual vector: ${ r } = { z } - { H } \hat { { x } }$.
Where, $\hat { { X } }$ is the estimated state vector of the dimension n, H is the jacobian, z is the state vector of the measurement values.
The bad data will be detected when the difference between the estimated measurements $\hat { z } = \mathrm { H } \widehat { \theta }$ and the actual measurements z exceeds the tolerance threshold τ.
$r = | | z - H \hat { \theta } | | > \tau$ (11)
If the residuals of the measurements are unchanged, the injections of the bad data measurement can circumvent the usual systems of the detection of the false data. The false data injection of the power grid can be expressed by:
$\mathrm { z } _ { \mathrm { a } } = \mathrm { z } + \mathrm { a }$ (12)
where, a is false data injection to vector measurement z
| |$z _ { \mathrm { a } } - \mathrm { H } \hat { \mathrm { x } } _ { \mathrm { a } } | | = | | \mathrm { z } + \mathrm { a } - \mathrm { H } ( \hat { \mathrm { x } } + \mathrm { c } ) | |$ (13)
where, $\hat { \mathrm { x } } _ { \mathrm { a } } = \hat { \mathrm { x } } + \mathrm { c }$
| |$z _ { \mathrm { a } } - \mathrm { H } \hat { \mathrm { x } } _ { \mathrm { a } } | | = | | \mathrm { z } - \mathrm { H } \hat { \mathrm { x } } + ( \mathrm { a } - \mathrm { Hc } ) | |$ (14)
| |$z _ { \mathrm { a } } - \mathrm { H } \hat { \mathrm { x } } _ { \mathrm { a } } | | = | | \mathrm { z } - \mathrm { H } \widehat { \mathrm { x } } | |$ (15)
Fuzzy time series were first introduced by Song and Chissom [28, 29], is based on the notion of a delimited boundary between the member and non-member elements of a particular set, they modelled fuzzy relationships between observations by max-min composition operations in order to propose the forecast in three steps: fuzzification, fuzzy relationship determination and defuzzification. The model was improved by Chen [30] who proposed a method applies simplified arithmetic operations to the forecast algorithm, including the Conventional time series which refer to real values, but fuzzy time series are structured by fuzzy sets.
Let U be the universe of discourse, such that $U =$ $\left\{ u _ { 1 } , u _ { 2 } , \ldots , u _ { n } \right\} .$ A fuzzy set $\mathrm { A }$ of $\mathrm { U }$ is defined as $A =$ $f _ { A } \left( u _ { 1 } \right) / u _ { 1 } + f _ { A } \left( u _ { 2 } \right) / u _ { 2 } + \ldots + f _ { A } \left( u _ { n } \right) / u _ { n } ,$ where, $f _ { A }$ is the membership function of A. Let $f _ { A }: \mathrm { U } \rightarrow [ 0,1 ] . f _ { A } \left( u _ { i } \right)$ Is the degree of membership of $u _ { i }$ in $\mathrm { A } ,$ where $f _ { A } \left( u _ { i } \right) \in [ 0,1 ]$ and 1$\leq _ { 1 } \leq n .$ Let $Y ( t ) ( t = \ldots , 0,1,2 , \ldots ) ,$ a subset of a real number, be the universe of discourse on which fuzzy sets, $f _ { i } ( t ) ( i = 1 ,$ $2 , \ldots )$ are defined and $F ( t )$ is a collection of $f _ { 1 } ( t ) , f _ { 2 } ( t ) , \ldots$. $F ( t )$ is referred to as a fuzzy time series on $Y ( t ) .$
Here, $F ( t )$ is viewed as a linguistic variable and $f _ { i } ( t )$ represents possible linguistic values of $F ( t ) .$ If $F ( t )$ is caused by $F ( t - 1 ) ,$ the relationship can be expressed as: $F ( t - 1 ) \rightarrow$ $F ( t ) .$ To compute this fuzzy relationship, various operations can be applied; if the maximum degree of membership of $F ( t ):$ Belongs to $A _ { i } , F ( t )$ is considered to be $A _ { i } ;$ then $F ( t - 1 ) \rightarrow$ $F ( t )$ becomes $A _ { i } \rightarrow A _ { j } .$
The method for forecasting the enrollments is briefly reviewed as follow [30]:
Step 1: Define the universe of discourse within which fuzzy sets are defined.
Step 2: Partition the universe of discourse U into several even and equal length intervals.
Step 3: Define the linguistic values represented by fuzzy sets of intervals in the discourse universe.
Step 4: Fuzzify the historical enrolment data.
Step 5: Establish fuzzy logical relationships (FLRs) which define the relationship between the former states and the state to be provided for.
The objective of this paper is to design a system for detecting false measurements in the electricity grid, by applying short-term forecasting methods based on fuzzy time series.
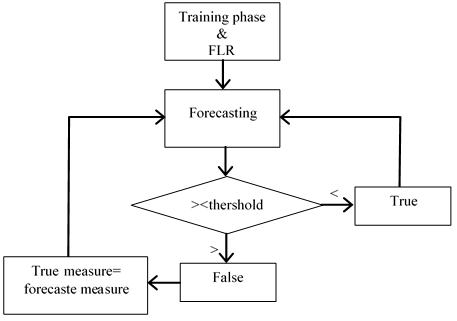
Our test algorithm is programmed in java, of which we have worked on 3 methods [30-32]. The results are taken by vote between these three programmed methods. The processes of our approach are mentioned in Figure 2 and listed according to the following steps:
As
Step 1:
Half of the correct data is taken for the recognition phase, these data are partitioned into 7 intervals, then we assigned each measurement group to the corresponding interval, we established the Relationship function (FLR) for these data by referring to the methods used [30-32].
Step 2
The secondary half of the test data is taken for prediction. We have calculated the data forecast for now t+1 based on the data of the first group that are taken as historical data.
Step3
We calculated the difference between the predicted and the actual data; if the difference is less than an experimentally chosen threshold; the measurement is taken as the correct measurement, otherwise the measurement is taken as false. For step t+2, if the detected measurement is false, it will be replaced by the planned measurement, and the calculation is restarted from "step 1", then the calculation is restarted
for the rest of the data.
The following algorithm gives the real-time detection process
For i = t: t+n
Forecasting (t+1)
If threshold > forecasting (t+1)-real (t+1)
Real (t+1) = true; Forecasting (t+2)
Else real (t+1) =Forecasting (t+1)
Forecasting (t+2)
End
Figure 2. Real time false data detection algorithm
In our studies we use the contingency matrix (confusion matrix) which allows us to gather the expected data in order to evaluate the performance of the detection. Table 1 presents the contingency matrix used to evaluate the detection performance of our model in terms of accuracy and recall [33].
Table 1. Detection evaluation
|
|
|
Observed measures |
|
|
|
|
True |
False |
|
Predictive |
True |
True positive (TP) |
False Positive (FP) |
|
False |
False Negative (FN) |
True Negative (TN) |
|
Accuracy $= ( \mathrm { TP } + \mathrm { TN } ) / ( \mathrm { TP } + \mathrm { FP } + \mathrm { TN } + \mathrm { FN } )$ (17)
Several experimentations have been conducted for all algorithms with different configurations under a compatible Thinkpad, Intel (R) Core (TM) i5-520M CPU 2.40 GHz, and 4 GB of RAM through Java language.
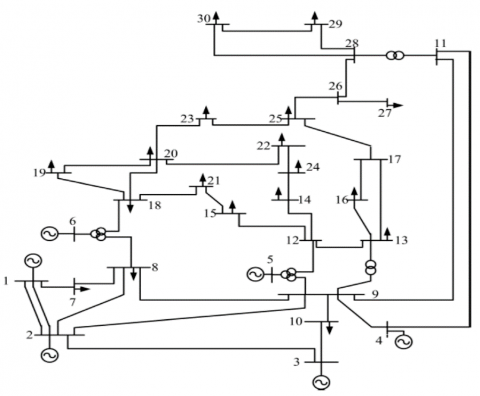
First, we worked on the collection of test data which are only the voltage measurements and the phase angles of our test network (Figure 3), for this purpose, we worked with a test network of 32 nodes.
Figure 3. IEEE-30 Bus
We have developed our network in the network analysis software "PSSE", it is a Siemens PTI software package widely adopted by industry and education for calculation load flow and dynamic simulation. We have varied several times the measurements of the means of production "generating nodes" and collected the measurements obtained based on the algorithm Newton-Raphson.
We then worked on the falsification of certain measures. In order to test the robustness of our model, we worked with false measurements according to the Jacobean, from which they can escape for the usual detection systems. To do this, we have calculated the Jacobean matrix for 82 groups of measurements by implementing the WLS algorithm on Matlab, then we introduced false measurements based on the calculated Jacobean values. All the measures collected are shown in Table 2.
Table 2. Data set
|
|
Total true data |
Total false data |
Total data |
|
Angle phase |
2281 |
179 |
2460 |
|
Voltage magnitude |
2259 |
201 |
240 |
Table 3. Results for angle phase
|
|
Total true data |
Total false data |
|
Chen |
93.701 |
0,986 |
|
Jilany & burnay |
94.541 |
0,991 |
|
stevensen |
94.768 |
0,982 |
|
|
Total true data |
Total false data |
|
Chen |
92.589 |
0,972 |
|
Jilany & burnay |
93.679 |
0,992 |
|
stevensen |
94.2653 |
0,991 |
In this paper we discussed the detection of false measurements in the electrical grid especially when the error is in the function of Jacobean matrix. In our study we worked on a 30 nodes network using PSSE and we have established a database of 2460 for each element (voltage and phase angle). We have also worked by the predictive approach particularly the fuzzy time series which are known by the robustness of their notoriously short-term prediction, the experimental studies that we have conducted have shown that this approach gives good detection results, as well as it is well adapted to be put in real time.
[1] Fang, X., Misra, S., Xue, G., Yang, D. (2011). Smart grid-the new and improved power grid: A survey. IEEE Communications Surveys & Tutorials, 14(4): 944-980. https://doi.org/10.1109/SURV.2011.101911.00087
[2] Colak, I., Sagiroglu, S., Fulli, G., Yesilbudak, M. (2016). A survey on the critical issues in smart grid technologies. Renewable and Sustainable Energy Reviews, 54: 396-405. http://dx.doi.org/10.1016/j.rser.2015.10.036
[3] Colbert, E.J.M. (2016). Cyber-security of SCADA and other industrial control systems. Part of the Advances in Information Security, book series (ADIS, volume 66). http://link.springer.com/10.1007/978-3-319-32125-7
[4] Fan, X., Gong, G., Locke, G. (2013). Security challenges in smart-grid metering and control systems. Technology Innovation Management Review, 42-49. https://doi.org/10.22215/timreview702
[5] Igure, V.M., Laughter, S.A., Williams, R.D. (2006). Security issues in SCADA networks. Computers & Security, 25(7): 498-506. https://doi.org/10.1016/j.cose.2006.03.001
[6] Liu, Y., Ning, P., Reiter, M.K. (2009). False data injection attacks against state estimation in electric power grids. ACM Transactions on Information and System Security (TISSEC), 14(1): 1-33. https://doi.org/10.1145/1952982.1952995
[7] Bisht, K., Kumar, S. (2016). Fuzzy time series forecasting method based on hesitant fuzzy sets. Expert Systems with Applications, 64: 557-568. http://dx.doi.org/10.1016/j.eswa.2016.07.044
[8] Tsaur, R.C., Yang, J.C.O., Wang, H.F. (2005). Fuzzy relation analysis in fuzzy time series model. Computers & Mathematics with Applications, 49(4): 539-548. https://doi.org/10.1016/j.camwa.2004.07.014
[9] Huarng, K. (2001). Heuristic models of fuzzy time series for forecasting. Fuzzy Sets and Systems, 123(3): 369-386. https://doi.org/10.1016/S0165-0114(00)00093-2
[10] Dán, G., Sandberg, H. (2010). Stealth attacks and protection schemes for state estimators in power systems. 2010 First IEEE International Conference on Smart Grid Communications, Gaithersburg, MD, USA, pp. 214-219. https://doi.org/10.1109/SMARTGRID.2010.5622046
[11] Kosut, O., Jia, L.Y., Thomas, R.J., Tong, L. (2010). Malicious data attacks on smart grid state estimation: attack strategies and countermeasures. 2010 First IEEE International Conference on Smart Grid Communications, Gaithersburg, MD, USA, pp. 1-6. https://doi.org/10.1109/SMARTGRID.2010.5622045
[12] Teixeira, A., Amin, S., Sandberg, H., Johansson, K.H., Sastry, S.S. (2010). Cyber security analysis of state estimators in electric power systems. 49th IEEE Conference on Decision and Control (CDC), Atlanta, GA, USA, pp. 5991-5998. https://doi.org/10.1109/CDC.2010.5717318
[13] Teixeira, A., Dán, G., Sandberg, H., Johansson, K.H. (2011). A cyber security study of a SCADA energy management system: Stealthy deception attacks on the state estimator. IFAC Proc., 18(PART 1): 11271-11277.
[14] Hug, G., Giampapa, J.A. (2012). Vulnerability assessment of AC state estimation with respect to false data injection cyber-attacks. IEEE Trans. Smart Grid, 3(3): 1362-1370. https://doi.org/10.1109/TSG.2012.2195338
[15] Rahman, A., Mohsenian-rad, H. (2013). False data injection attacks against nonlinear state estimation in smart power grids. 2013 IEEE Power & Energy Society General Meeting, Vancouver, BC, Canada. https://doi.org/10.1109/PESMG.2013.6672638
[16] Sun, Y., Li, W.T., Song, W., Yuen, C. (2016). False data injection attacks with local topology information against linear state estimation. 2015 IEEE Innovative Smart Grid Technologies - Asia (ISGT ASIA), Bangkok, Thailand. https://doi.org/10.1109/ISGT-Asia.2015.7387159
[17] Giani, A., Bitar, E., Garcia, M., McQueen, M., Khargonekar, P., Poolla, K. (2013). Smart grid data integrity attacks. IEEE Transactions on Smart Grid, 4(3): 1244-1253. https://doi.org/10.1109/TSG.2013.2245155
[18] Liu, L., Esmalifalak, M., Ding, Q., Emesih, V.A., Han, Z. (2014). Detecting false data injection attacks on power grid by sparse optimization. IEEE Trans. Smart Grid, 5(2): 612-621. http://arxiv.org/abs/1607.06015
[19] Tang, B., Yan, J., Kay, S., He, H. (2016). Detection of false data injection attacks in smart grid under colored gaussian noise. 2016 IEEE Conference on Communications and Network Security (CNS), Philadelphia, PA, USA, pp. 1395-1402. http://doi.org/10.1109/CNS.2016.7860483
[20] Bi, S.Z., Zhang, Y.J. (2013). Graphical methods for defense against false-data injection attacks on power system state estimation. IEEE Transactions on Smart Grid, 5(3): 1216-1227. http://doi.org/10.1109/TSG.2013.2294966
[21] Skavhaug, A., Guiochet, J., Schoitsch, E., Bitsch, F. (2016). Computer safety, reliability, and security. Part of the Lecture Notes in Computer Science, book series (LNCS, volume 9923), 226-237. https://doi.org/10.1007/978-3-319-45480-1
[22] Esmalifalak, M., Nguyen, N.T., Zheng, R., Han, Z. Detecting stealthy false data injection using machine learning in smart grid. 2013 IEEE Global Communications Conference (GLOBECOM), Atlanta, GA, USA. https://doi.org/10.1109/GLOCOM.2013.6831172
[23] El Khantach, A., Hamlich, M., Eddine Belbounaguia, N. (2018). A robust false data detection in smart grid using trees decision algorithm. Smart Application and Data Analysis for Smart Cities (SADASC'18).
[24] Abur, A., Exposito, A.G.A. (2004). Power System State Estimation Theory and Implementation. CRC Press, Boca Raton. https://doi.org/10.1201/9780203913673
[25] Wu, F.F. (1990). Power system state estimation: A survey. International Journal of Electrical Power & Energy Systems, 12(2): 80-87. https://doi.org/10.1016/0142-0615(90)90003-T
[26] Wang, H., Schulz, N.N. (2004). A revised branch current-based distribution system state estimation algorithm and meter placement impact. IEEE Transactions on Power Systems, 19(1): 207-213. https://doi.org/10.1109/TPWRS.2003.821426
[27] Jabr, R.A., Pal, B.C., Singh, R. (2009). Choice of estimator for distribution system state estimation. IET Generation, Transmission & Distribution, 3(7): 666-678. https://doi.org/10.1049/iet-gtd.2008.0485
[28] Song, Q., Chissom, B.S. (1993). Forecasting enrollments with fuzzy time series - Part I. Fuzzy Sets and Systems, 54(1): 1-9. https://doi.org/10.1016/0165-0114(93)90355-L
[29] Song, Q., Chissorn, B.S. (1994). Forecasting enrollments with fuzzy time series-part II. Fuzzy Sets and Systems, 62(1): 1-8. https://doi.org/10.1016/0165-0114(94)90067-1
[30] Chen, S.M. (1996). Forecasting enrollments based on fuzzy time series. Fuzzy Sets and Systems, 81(3): 311-319. https://doi.org/10.1016/0165-0114(95)00220-0