Pengfei Fan* | Zheng Shang
OPEN ACCESS
This paper explores the real-time monitoring of weapon production equipment with advanced wireless sensor network (WSN) technology and computer measurement & control technique. First, a monitoring system for weapon production equipment was established based on the WSN and Ethernet. Following Zigbee protocol, a self-organizing WSN was constructed and its routing algorithm was implemented. Next, the author depicted the implementation of batch estimation fusion algorithm based on weighted mean and data fusion algorithm based on Haar wavelet transform. The validity and rationality of the two algorithms were verified through simulation experiment.
wireless sensor network (WSN), weapon production equipment, data fusion, Zigbee protocol
Weapon production [1-2] requires intricate process equipment that contains various large and medium compressors, pumps, pressure vessels, motors, etc. The production environment is featured by high temperature, pressure, flammability, explosibility and toxicity. The process equipment must be monitored effectively to prevent accidents, reduce downtime rate, extend service life and control maintenance cost.
The operating condition of weapon production equipment is traditionally monitored by wired sensor control system. However, this traditional system cannot cover a wide area without the deployment of numerous sensors in different types. This defect greatly constrains the application of wired sensor control system in the process industry.
The wired sensor control system is gradually being replaced with wireless sensor network (WSN) [3-4], an emerging tool for information acquisition and processing. Focusing on data processing, the WSN can effectively overcome the defect of wired sensor control system and achieve real-time monitoring of the operating condition of weapon production equipment.
The monitoring of the operating condition needs to capture various operating parameters of the equipment, including but not limited to temperature, pressure and vibration. The analysis on these parameters helps to acquire, analyze and evaluate the status of the equipment, laying the basis for correct judgement of abnormalities. Suffice it to say that operating condition monitoring is the prerequisite for equipment monitoring and fault diagnosis.
There are three ways to monitor the operating condition, namely, offline periodic detection, online monitoring and offline analysis, and automatic online monitoring and analysis [5]. Over the years, the equipment monitoring technology has been improved constantly towards automation, networking and virtualization. The scale and applicable range of the monitoring systems are expanding continuously, forming intelligent computer network monitoring systems with such abilities as rapid data acquisition, real-time online analysis, and distributed hierarchical distributed structure.
To solve the defect of traditional wired sensor control system, this paper designs a data acquisition and monitoring system for the operating condition of weapon production equipment based on the WSN, and proves through experiment that the proposed system outperforms the traditional system in acquiring the data and monitoring the operation of weapon production equipment.
As shown in Figure 1, the basic principle of equipment monitoring and fault diagnosis involves equipment signal detection, signal feature extraction, status detection, fault prediction and decision-making, as well as establishment of status information base and knowledge base.
Specifically, signal detection measures the operating status parameters of the weapon production equipment, and provides the basic data for fault analysis. Feature extraction and status detection determines the presence of abnormal signals through the analysis of various monitoring signals. Fault diagnosis evaluates the abnormal signals that affect the equipment, finds the cause of the fault, and determines the fault location. The information base and knowledge base support the abnormality judgement and fault diagnosis through continuous learning of knowledge.
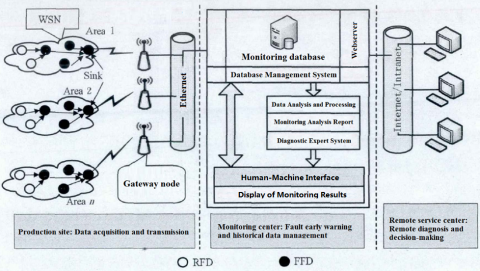
Based on the process of equipment monitoring and fault diagnosis in Figure 1, the author designed a data acquisition and monitoring system for the operating condition of weapon production equipment based on the WSN. The system consists of five parts: field data acquisition, wireless data transmission, wired data transmission, computer monitoring and remote data service. The structure of the proposed system is shown in Figure 2 below.
Figure 1. Process of equipment monitoring and fault diagnosis
Figure 2. The structure of the proposed system
In this system, the sensor nodes have radio frequency function and follow Zigbee wireless communication protocol based on IEEE802.1 standard. The data collected by sensors are transmitted wirelessly to the sink node through the wireless data transmission part. The wireless transmission is realized through the self-organizing WSN.
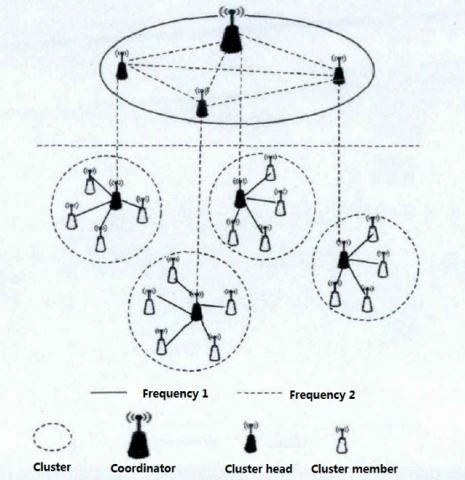
Considering the shear number, diverse types and wide distribution of weapon production equipment, the WSN was divided into several cluster networks by the hierarchical network topology. Each cluster network is responsible for acquiring the operating condition parameters of the equipment within its coverage.
Figure 3 presents the structure of a typical WSN, which contains multiple sensor nodes and a sink node.
Figure 3. Structure of a typical WSN
The Zigbee-based WSN is a low-rate wireless network. There are two types of devices in the network: full-function device (FFD) and reduced function device (RFD). These devices serve as coordinator, router, gateway and terminal of the network.
The WSN nodes only support short-range wireless communication. The communication ability of each node depends on the factors of production environment, such as vibration, noise, obstacles and internodal distance. The influence of these factors can be described by the path loss in wireless transmission:
PL=20 logf+20 logd-26 , where PL is path loss; f is working frequency; d is the internodal distance. To ensure reliable communication between nodes, it is necessary to deploy the nodes and select the working frequency in a rational manner.
In this paper, the operating condition of weapon production equipment is acquired and monitored at the production site using field wireless sensor nodes. According to the classification criteria of field wireless sensor nodes, the WSN in our research consists of cluster member nodes, cluster head nodes and sink nodes. By logical structure of the network, the routing protocols can be divided into plane routing and hierarchical routing. With little topological changes, the hierarchical cluster tree routing protocol [6] is the best choice for the monitoring of weapon production equipment. The structure of hierarchical routing is shown in Figure 4.
Figure 4. The structure of hierarchical routing
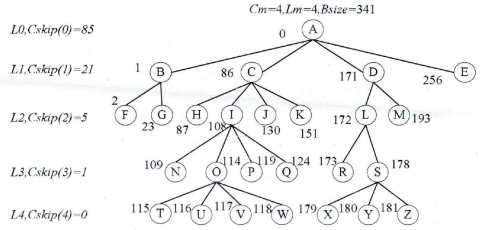
In Zigbee protocol, the cluster head, located at the top of the cluster, manages all nodes and sub-trees. The network address is allocated based on three parameters: the maximal child (Cm), the maximal level (Lm) and the maximal route (Rm). The CM refers to the maximum number of sub-nodes that each node can accommodate, the Lm stands for the maximum level of each sub-tree, and the Rm means each coordinator or router has several routing sub-nodes. Note that Rm< Cm.
The cluster head is located in the 0-th layer of the cluster tree network. Let Li be the i-th layer of the network. Then, the address offset of the children of sub-nodes in the i-th layer, denoted as CSkip(Li), can be expressed as:
$\begin{cases}CSkip(L_i )=1+Cm*(Lm-Li-1) & Rm=1\\\frac{1+Cm-Rm-Cm*Rm^{Lm-Li-1}}{1-Rm} & Rm≠1\end{cases}$
where Li =1, 2, …, Lm.
Then, the block size (Bsize), i.e. the maximum capacity of each tree, can be described as:
$Bsize=\begin{cases}Lm+1 & Cm=1\\1+\sum_{i=1}^{Lm}(Cm*Rm^{i-1}) & Cm≠1\end{cases}$
For a cluster tree network, Cm=Lm=Rm=1, and the network can accommodate up to 341 nodes. The intranet address allocation is depicted in Figure 5.
Figure 5. The intranet address allocation in cluster tree network
Real-time monitoring is essential to the stable and safe operation of weapon production equipment. To meet the real-time requirement, it is necessary to continuously capture and transit the feature signals of the equipment operating condition. Due to the diversity of equipment, the data acquisition will inevitably produce a large number of sensor data. This calls for the fusion of multi-sensor data without reducing the real-time performance, such as to reduce the computing and transmission load and improve the network utilization. The purpose of data fusion is to eliminate the measurement uncertainty according to a limited amount of collected data. The fused operating parameters can reflect the equipment condition more accurately.
3.1 Batch estimation fusion algorithm based on weighted mean
In general, the sensor parameters change slowly and obey normal distribution, while the measured data are theoretically unequal in precision. Thus, the traditional normalization method of taking the arithmetic mean is insufficient to ensure the data accuracy. Here, the batch estimation based on weighted mean is introduced to normalize the measured data [7].
To prevent node failure and enhance data reliability, two or more homogeneous sensor nodes were considered to monitor an equipment. After all, a single sensor node has a limited energy. Let n be the number of consistent data collected by the multiple sensors in a period of time. Then, the measured data can be expressed as x1, x2,…,xn. The n measured data were divided randomly into two groups, and the mean value of each group was computed. Next, a batch estimation algorithm was introduced to determine the fusion value Xp according to the computed mean value, making it close to the measured true value. The process can also be considered as two sets of consistency measured data collected by two homogeneous sensors in the same time period.
Assuming that m+k=n, the first and second sets of consistency data series can be denoted as X21, X22,…, X2kand X11, X12,…, X1m, respectively. Then, the arithmetic mean and standard variance of the two groups of measured data can be respectively defined as:
$\overline{X}_{(1)}=\frac{1}{m} \sum_{i=1}^{m} X_{1 i}$;
$\sigma_{(1)}=\sqrt{\frac{1}{m-1} \sum_{i=1}^{m}\left(X_{1 i}-\overline{X}_{(1)}\right)^{2}}$;
$\overline{X}_{(2)}=\frac{1}{k} \sum_{j=1}^{k} X_{2 j}$;
$\sigma_{(2)}=\sqrt{\frac{1}{k-1} \sum_{j=1}^{k}\left(X_{2 j}-\overline{X}_{(2)}\right)^{2}}$.
The variance estimates of means $\overline{X}_{(1)}$ and $\overline{X}_{(2)}$ are:
$\sigma_{\overline{X}_{(1)}}^{2}=\frac{1}{m} \sigma_{(1)}^{2}$;
$\sigma_{\overline{X}_{(2)}}^{2}=\frac{1}{k} \sigma_{(2)}^{2}$.
The weight ratios of the two sets of data are:
$\frac{p_{(1)}}{p_{(2)}}=\frac{\sigma_{\overline{X}_{(1)}}^{2}}{\sigma_{\overline{X}_{(2)}}^{2}}$.
Thus,
$\overline{X}_{p}=\frac{\sigma_{\overline{X}(2)}^{2}}{\sigma_{X_{(1)}}^{2}+\sigma_{\overline{X}_{(2)}}^{2}} \overline{X}_{(1)}+\frac{\sigma_{\overline{X}_{(1)}}^{2}}{\sigma_{\overline{X}_{(1)}}^{2}+\sigma_{\overline{X}_{(2)}}^{2}} \overline{X}_{(2)}$.
The corresponding variance estimates are:
$\sigma_{\overline{X}_{p}}^{2}=\frac{\sum_{i=1}^{2} p_{(i)}\left(\overline{X}_{(i)}-\overline{X}_{p}\right)^{2}}{\sum_{i=1}^{2} p_{(i)}}$.
The operating parameters and measured noise of the sensors in our system can be considered as normally distributed, which are suitable for the batch estimation fusion algorithm based on weighted mean.
3.2 Data fusion algorithm based on Haar wavelet transform
The Haar wavelet transform aims to reduce the communication data of sensor nodes. The data fusion algorithm can be established based on Harr wavelet transform in the following manner.
To begin with, the sensor nodes sampling is regarded as a data flow pipeline, the length of which is 2j units. One of these units is the space needed to store the data structure of a real-time sampled data. It is assumed that the length of the pipe is 23, and can be treated as a vector space of V3. Then, V3=V2⊕W2. Thus, the data volume can be reduced by continuously reducing the dimensions of vector space.
The data of a sensor node can be fused with the vector space of V3through the following steps:
Step 1: Through linear combination of Haar functions, the vector space V3 is represented as $I(x)=α_0^3 φ_0^3 (x)+α_1^3 φ_1^3 (x)+α_2^3 φ_2^3 (x)+…+α_7^3 φ_7^3 (x)$, where $α_0^3$, $α_1^3$, …, $α_7^3$ are sensor sampling values at the fusion degree of 8.
Step 2: The dimension of V3 is reduced to V2. Here, V3 is expressed as a linear combination of the basis functions of V2 and W2:
$I(x)=α_0^2 φ_0^2 (x)+α_1^2 φ_1^2 (x)+α_2^2 φ_2^2 (x)+α_3^2 φ_3^2 (x)+β_0^2 ϑ_0^2 (x)+β_1^2 ϑ_1^2 (x)+β_2^2 ϑ_2^2 (x)+β_3^2 ϑ_3^2 (x)$;
V2: $I(x)=α_0^2 φ_0^2 (x)+α_1^2 φ_1^2 (x)+α_2^2 φ_2^2 (x)+α_3^2 φ_3^2 (x)$;
W2: $I(x)=β_0^2 ϑ_0^2 (x)+β_1^2 ϑ_1^2 (x)+β_2^2 ϑ_2^2 (x)+β_3^2 ϑ_3^2 (x)$;
where $α_0^2$, $α_1^2$, $α_2^2$ and $α_3^2$ are sensor sampling values at the fusion degree of 4; $β_0^2$, $β_1^2$, $β_2^2$ and $β_3^2$ are detail coefficients.
By this fusion algorithm, the vector space of V3 can be described by function $φ_0^0$, $ϑ_0^0$, $ϑ_0^1$, $ϑ_1^1$, $ϑ_0^2$, $ϑ_1^2$ and $ϑ_3^2$.
This section carries out a simulation experiment to verify the effectiveness of the proposed system. According to the record results and alarm data, eight alarm temperature values in 30s were extracted from the weapon production equipment monitoring system and divided into two groups. The extracted values are listed in Table 1 below.
Table 1. Simulated alarm temperature values
|
|
1 |
2 |
3 |
4 |
|
X1 |
16.38 |
15.57 |
15.56 |
15.52 |
|
X2 |
16.21 |
15.55 |
15.51 |
15.52 |
Using the batch estimation fusion algorithm based on weighted mean, the arithmetic mean and variance of the eight values were computed as: $\overline{\mathrm{S}}_{(1)}=15.71$, $\sigma_{(1)}=0.42$, $\overline{\mathrm{S}}_{(2)}=15.52$, $\sigma_{(2)}=0.02$, the weighted mean fusion value as 15.54, and the fusion difference as 0.55.
It takes four steps to fuse the eight value by the data fusion algorithm based on Haar wavelet transform. In each step, the mean values of samples with fusion granularity of 8, 4, 2 and 1 were calculated and recorded in Table 2 below.
Table 2. Data fusion of nodes
|
Fusion granularity |
Fusion result |
Detail coefficient |
|
8 |
[16.38, 15.57, 15.56, 15.52, 16.21, 15.55, 15.51, 15.52] |
|
|
4 |
[15.93, 15.52, 15.55, 15.54] |
[0.40, 0.03, 0.03] |
|
2 |
[15.73, 15.54] |
[0.21, 0] |
|
1 |
[15.63] |
[0.1] |
Developed from arithmetic mean and batch estimation theory, the batch estimation algorithm based on weighted mean is suitable for the fusion of network data. The two sets of reliable measured data were processed by the weighted function according to their variances. In this way, the uncertainty of the network data was reduced or eliminated, making the data much more reliable.
The data fusion algorithm based on Haar wavelet transform is suitable for fusing the data collected by sensor nodes in a period of time. The fusion result will be sent to the upper computer or the user. The energy consumption of sensor nodes mainly attributes to sensor module, processor module and wireless communication module [8-9]. Among them, the wireless communication module is the leading consumer.
Let k be the energy consumed by a sensor node to send 1bit data to the distance of d. If each of the eight values occupies 1bit of space, then the total energy consumed to send the eight values amounts to 8k. The data fusion algorithm based on Haar wavelet transform fused the eight temperature values to get data with granularity of 1. The energy consumed to send the fused data to d distance is 1/8 of d distance. Therefore, this algorithm can effectively reduce the transmission load without sacrificing data reliability, thus saving the energy of sensor nodes.
This paper applies the WSN technology in data acquisition and monitoring of weapon production equipment. The WSN was adopted to replace the traditional wired sensor system, and used to collect and monitor the operating condition of the equipment. The structure of cluster tree network and the implementation of its routing algorithm were described according to the framework of the monitoring system. Based on Zigbee technology, the self-organizing network was set up to achieve the purpose of collecting network data. Next, the author depicted the implementation of batch estimation fusion algorithm based on weighted mean and data fusion algorithm based on Haar wavelet transform. The validity and rationality of the two algorithms were verified through simulation experiment.
[1] Lei YJ, Li XY. (2008). Model of weapon equipment extended manufacturing "super-network" chain. Journal of PLA University of Science & Technology 9(2): 165-171. https://doi.org/10.3969/j.issn.1009-3443.2008.02.013
[2] Jia WQ, Huang YF, Wang YZ. (2011). The system simulation assessment research on the supply chain performance of the aviation weapon equipment manufacturing. Applied Mechanics and Materials 66-68: 401-406. https://doi.org/10.4028/www.scientific.net/amm.66-68.401
[3] Cui S, Cao Y, Sun G. (2018). A new energy-aware wireless sensor network evolution model based on complex network. EURASIP Journal on Wireless Communications and Networking 218-226. https://doi.org/10.1186/s13638-018-1240-0
[4] Krishnamoorthy A, Vijayarajan V. (2017). Energy aware routing technique based on Markov model in wireless sensor network. International Journal of Computers & Applications 1-7. https://doi.org/10.1080/1206212X.2017.1396423
[5] Zhu YL, Li L, Song YQ, Wang LW. (2017). Storage and parallel processing of big data of power equipment condition monitoring on ODPS platform. Transactions of China Electrotechnical Society 32(9): 199-210.
[6] Tan Q, Yue XJ. (2014). Comparative performance analysis of flat and hierarchical routing in wireless sensor network. Applied Mechanics & Materials 685: 4-8. https://doi.org/10.4028/www.scientific.net/AMM.685.587
[7] Abadie A, Imbens GW. (2011). Bias-corrected matching estimators for average treatment effects. Journal of Business & Economic Statistics 29(1): 1-11. https://doi.org/10.1198/jbes.2009.07333
[8] Wang H, Chen QG, Wang P, Wang T. (2013). Research and implementation of the system manager based on android platform for wireless sensor network. Communications in Computer & Information Science 334: 424-437. https://doi.org/10.1007/978-3-642-36252-1_40
[9] Wang F, Zeng P, Yu H, Xiao Y. (2013). Random time source protocol in wireless sensor networks and synchronization in industrial environments. Wireless Communications & Mobile Computing 13(8): 798-808. https://doi.org/10.1002/wcm.1144