Zeynab Cherki* | Mohamed Nasser Tandjaoui | Mebrouk Sellam
© 2022 IIETA. This article is published by IIETA and is licensed under the CC BY 4.0 license (http://creativecommons.org/licenses/by/4.0/).
OPEN ACCESS
Algeria is a country rich in fossil fuels, we can say that the energy future in this country looks secure. On the other hand, this abundance is addictive, Algeria and the importance of its geographical location is one of the countries that absorbs the most solar radiation when the renewable energy and energy efficiency program was implemented in 2011. The windiest areas are located in the southern region of Algeria. Based on this, we will discuss in this article the geographical identification of the Kaberten region and present the qualifications that made it a suitable location for the establishment of the wind field. We will also discuss the type of wind turbine used in the station and display curves showing the electrical energy generated over a period of two years. Finally, we conclude to what extent this project contributes to sustainable development, if the expansion is known to increase the amount of energy generated from clean sources.
clean energy, renewable energy, wind potential, wind power
From clean and renewable sources, we find that the exploitation of wind energy to produce electricity began to know a recovery in Algeria, where this country occupies an important geographical location. Research in the field of renewable energies in general and wind energy especially has been carried out for nearly 30 years, where the results of the Atlas of Winds by Hamouche published a statistical assessment of 37 sites in WASP, in 1990. Kaspadji also published wind data from 64 wind power plants at a height of 10 meters in Algeria. The research helped identify the stormiest areas, most of which was found to be located in southwest Algeria of 1500 km from Algiers, in the extreme south of the country, Adrar is located in the southwest of Algeria, covers an area of 427,968 km2 [1-3].
The region is characterized by a relatively flat topography, as well as by a desert geomorphology. The wind potential in and around Adrar is characterized by a fort from the northeast. Therefore, the wind data, classify the Adrar region as the one with the best wind potential in Algeria [4].
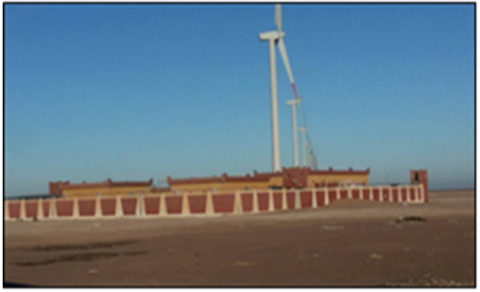
As part of the implementation of the renewable energy program '2011-2030', a first wind farm of 10 MW was installed and commissioned in 2014, in the region of Kaberten of the city of Adrar. This power plant, the first of its kind nationwide, consists of 12 Gamesa wind turbines with 850 kW of power, located on an area of 30 hectares (Figure 1). The realization of this pilot farm is a first step towards the realization of the 5 GW wind farms. Moreover, the instability of the price of a barrel of oil experienced by the oil market in recent years, and the fight against climate change must contribute to the integration of wind energy into the energy mix, perceived today as a major issue. Starting from the fact that the stages of realization of the wind farm require on average 12 months of recording of speed data on site, approximately 12 months for administrative authorizations and 18 to 24 months for the construction of wind farms [1].
Figure 1. Wind farm of Kaberten in southern Algeria
The goal of 2030 represents a rendezvous to be reached imperatively by the launch and the realization of the projects with very short deadlines to ensure the 5 GW of the envisaged energy mix. Indeed, the implementation of the renewable energy program, particularly the wind energy component, requires the construction of about twenty wind farms; each composed of a hundred large-capacity wind turbines (1.5 MW-3 MW) thus involving large-scale works [1].
Search background: Introducing the first power plant to produce electricity using wind energy in Algeria and encouraging this type of projects that did not develop rapidly in this country.
Purpose of research: This research was presented in order to support research units in wind energy, which are very few in Algeria.
Problem: What is the contribution of the Kaberten project to achieving sustainable development?
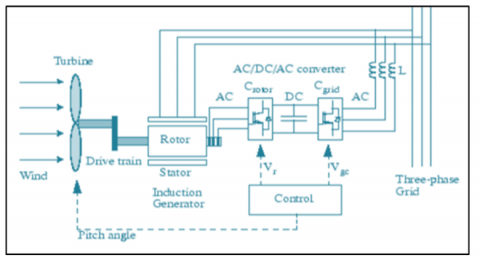
Wind turbines still use a synchronous or asynchronous squirrel cage generator as a generator, where two main processes are applied: - fixed speed, - variable speed. A wind turbine is constituted by a tower (carrying element). At the top, is located the nacelle (active element). The nacelle consists of a system of transformation of wind energy into electrical energy with its command. Figure 2 shows the components of the electromechanical chain. The tower of the wind turbine is conical. The cables for transporting electrical energy, the control and control elements, the switchgear for connection to the low-voltage distribution network are arranged inside the tower. Arranges everything for you in a user-friendly way [5].
Figure 2. Components of the electromechanical chain
A sustainable development of energy production means based on wind energy, will be feasible with a decrease in the cost of production, so that they can be integrated into the power generation market. Wind power generation using fixed or variable speed energy systems. The production of electricity from wind turbines in an isolated site requires the use of the electric machine assembly - static converter. We know that the wind turbine provides its wind energy. Therefore, there is a relationship between wind speed and rotational speed, torque and power of the rotor of a wind turbine. The mechanical power that can be extracted from the wind is determined by the following expression [5]:
$P_{v}=\frac{1}{2} \cdot \rho \cdot S \cdot V^{3}$ (1)
The following relation gives the power provided by the rotor of the wind turbine:
$P=C_{P} \cdot \frac{\rho \cdot S \cdot V^{3}}{2}$ (2)
$K=\omega \cdot \frac{R}{V}$ (3)
The coefficient values for wind turbines are shown in Table 1.
Table 1. Coefficient values for wind turbine
|
K |
0 |
1.3 |
2.1 |
2.7 |
3.4 |
5 |
5.8 |
6.3 |
|
CP |
0 |
0.1 |
0.2 |
0.3 |
0.4 |
0.3 |
0.2 |
0.1 |
We define the torque developed on the rotor of the wind turbine as follows:
$\mathrm{T}=\frac{P}{\omega}$ (4)
With:
$T=\frac{\rho \cdot S \cdot V^{3}}{2 \cdot \omega}=C_{P} \cdot \frac{R \cdot \rho \cdot S \cdot V^{2}}{2 \cdot K}$ (5)
As part of the insertion of decentralized units of production in electricity networks, it will be necessary to study means to implement these units for the compensation of reactive power and active power control, as well that the control of the effective value of the tension. The units of medium power production (generally less than 600 kVA) are generally equipped with asynchronous machines cage.
Indeed, the asynchronous cage generator is currently the most widely used electric machine in fixed speed wind power production. This generator can operate at variable speed, thanks to the use of power converters, and can generate an output of electric power over a wide range of wind speeds. Figure 3 shows the complete structure of the conversion chain with its controls [5].
Figure 3. Wind conversion chain
This site is located about 72 km north of the city of Adrar near a Sonelgaz substation, it is at an altitude of about 260 m and its geographical coordinates are 28°27'7.44N 0°02'59.08W. The decisive factors that led to the choice of the site that could contain the wind farm are:
Altitude;
Obstacles;
Location in relation to the wind direction;
Situation in relation to the electricity distribution network;
Available area;
Geography and geomorphology (soil quality, topography);
Access possibilities;
Road axis to the next port city;
Regulatory elements (sufficient distance from the city extension plan, sufficient distance to radar, airport, etc.).
These different points were analyzed in the choice of the site. The optimization is done by comparing both the wind potential of the selected site with the costs involved in the construction of the park on the same site [6, 7].
Wind turbines are a complex technology that includes several disciplines, including aerodynamics, mechanical, structure dynamics, meteorology, as well as electrical engineering that transmits, generates and integrates wind turbines into the power system. Wind turbine technology has stymied development over the years. By the beginning of the 1980s, wind turbines had a power of only a few kilowatts and became in megawatts today. As for the design, the wind turbine changed from being driven by mores to being driven in an optimal way in line with the operating system and the market environment, and the design has also evolved from constant leverage and passive control and drive trains with gearboxes to become variable speed and active control with or without gearboxes. The main controversy remains related to the concepts of wind turbines whose design has been developed over the years, and in this paper we present one of the types that were adopted in the construction of the KABERTEN [5, 8].
Quoting from the result of the research presented by Mustapha Merdaoui and al in 2010, when the Kabarten project was under study, the current arrangement of wind turbines at the Kaberten Man site after an in-depth study in order to improve the total production and limit the amount of energy losses, and this is what documents 5 and 7 show [6].
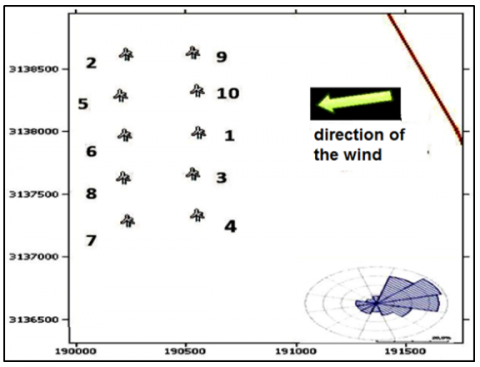
4.1 The wind turbines are arranged in two rows facing the direction of the wind
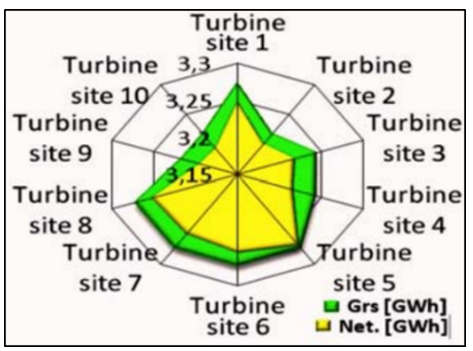
The arrangement of wind turbines (first position) as shown in Figure 4 resulted in a distribution of energy production as shown in Figure 5.
Figure 4. Arrangement of wind turbines at the Kaberten site (first position)
Figure 5. Distribution of energy production from the Kaberten farm (first position)
According to Figure 6, we note the following:
The wake effect in the first row of wind turbines was low.
The distance between the wind turbines is estimated at 8 R.
The wake effect in the second row of wind turbines was very effective.
Figure 6. Resulting wake losses (first position)
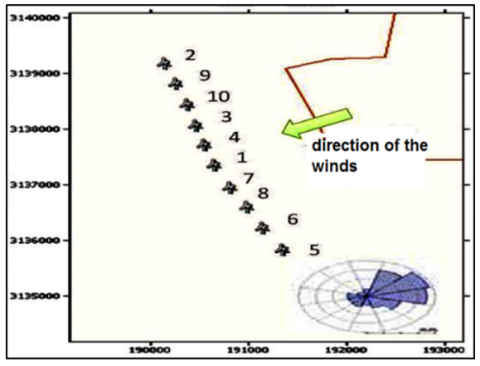
4.2 Wind turbines are arranged in the same row facing the direction of the wind
The arrangement of wind turbines (second position) as shown in Figure 7 resulted in a distribution of energy production as shown in Figure 8.
Figure 7. Arrangement of wind turbines on the Kaberten site (second position)
Figure 8. Distribution of energy production from the Kaberten farm (second position)
Figure 9. Resulting wake losses (second position)
According to Figure 9, we note the following:
In this situation, the losses through the wake effect were very low (10%).
This position depends on the direction of the wind turbines facing the prevailing winds [6].
The G58 wind turbine is product by Gamesa Corporation Technologies (Grupo Auxiliar MEtalurgico, SA) from Spain. Since 1994, Gamesa Corporación Tecnológica (Grupo Auxiliar MEtalurgico, SA) is no active. In 2017, this manufacturer was taken over by Siemens Gamesa Renewable Energy. Characters of this type are shown in the following Table 2.
Table 2. Characters of wind turbine (Gamesa G52-850 kW)
|
General data |
Masses |
Rotor |
|
Manufacturer: Gamesa (Spain) Name of the wind turbine: G52 / 850 Normal power: 850 kW Rotor diameter: 52 m Old model, not available for sale Wind class: IEC Ia Not compatible offshore Swept area: 2,124 m² Power density: 2.5 m² / kW Number of blades: 3 Power limitation: Pitch Commissioning: 2001 |
Nacelle: 23 tons Tower: 40 - 91 tons Rotor + hub: 10 tons Total: 73 - 124 tons |
Minimum rotation speed: 19.44 rpm Maximum rotation speed: 30.8 rpm Minimum wind: 4 m/s Nominal wind: 16 m/s Maximum wind: 25 m/s Manufacturer: Gamesa |
|
Gearbox |
Generator |
Tower |
|
Gearbox: yes Number of reports: 3 Ratio: 61.74 Manufacturer: Echesa, Fellar, Hansen, Lohman |
Type: ASYNC Number: 1 Maximum rotation speed: 1900 rpm Output voltage: 690 V. Manufacturer: Indar, Cantarey |
Minimum height of the platform: 44 m Maximum height of the platform: 65 m Manufacturer: Gamesa |
Table 3. The Measured values of the Adrar region during 2017 by URER/MS (MENA Meteorological Station)
|
GHI |
DNI |
DHI |
Tamb |
RH |
WS |
Wsgust |
WD |
WDStDev |
BP |
|
|
Jan |
759,8 |
60,74 |
766,45 |
18,82 |
50,06 |
6,34 |
8,69 |
251,07 |
46,29 |
991,85 |
|
Feb |
824,6 |
22,1 |
827,2 |
26,9 |
34,1 |
6,7 |
9,7 |
278,9 |
48,2 |
988,6 |
|
Mar |
262,36 |
0,704 |
227,85 |
22,641 |
21,314 |
3,086 |
4,628 |
121,07 |
16,731 |
984,51 |
|
Apr |
289,2 |
0,16 |
195,42 |
27,584 |
16,23 |
982,01 |
3,27 |
133,48 |
18,08 |
6,33 |
|
May |
296,82 |
0,139 |
196,56 |
33,893 |
14,062 |
979,99 |
3,299 |
153,99 |
16,096 |
4,915 |
|
June |
317,38 |
0,701 |
205,6 |
36,189 |
14,075 |
978,9 |
3,209 |
111,12 |
20,881 |
6,159 |
|
July |
211,23 |
0,093 |
211,23 |
37,404 |
11,786 |
978,82 |
3,878 |
108,51 |
20,881 |
7,267 |
|
August |
251318 |
296,36 |
0,066 |
209,964 |
38,062 |
11,565 |
978,82 |
3,283 |
111,65 |
20,43 |
|
September |
257,23 |
0,0262 |
232,46 |
34,54733 |
17,255 |
981,8 |
2,7911 |
108,37 |
18,409 |
5,4758 |
|
October |
246,37 |
0,2701 |
247,61 |
27,1129 |
26,323 |
3,439 |
5,1558 |
85,888 |
19,848 |
1036 |
|
November |
195,57 |
1,0714 |
196,5 |
20,65 |
22,579 |
2,35 |
3,6143 |
100 |
13,486 |
986,86 |
Remark
(1) In the table above (Table 3), there is an error in values related to the month of August, the proof of this is the value of the irrational temperature, which exceeded 209°C.
(2) The table above (Table 3) shows that there are no values for the month of December. This was because the visit was before the end of this month.
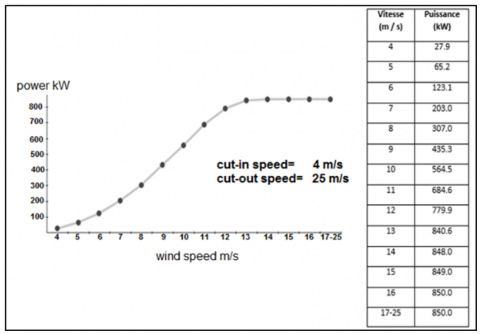
Figure 10. Power curve Gamesa G52-850 KW
The disparity between the value of the highest wind speed and the highest value of the resulting energy is subject to the characteristics of the turbine used and illustrated in Figure 10. The maximum speed in the characteristics table is 16 m/s. After this value, the output power is stabilized at 850.0 KW. The variations of the energy produced with respect to the variations of the wind speed are indicated in the following curve [9]:
Data on solar and wind energy in Adrar region measured during the year 2017 by High Precision Meteorological Station EnerMENA (Middle East and Northern Africa) which is activated on 27 September 2012 in Adrar. See APPENDIX (2).
The measuring station is located in URER/MS ADRAR, geographic coordinates are:
Latitude: 27.88° N,
Longitude: -0.27° E,
Altitude (amsl): 262 m,
Station: CSPS.MT.09.203,
Time Zone: one (UTC+1h).
A visit to Adrar, was made to obtain meteorological data for changes in solar and wind potential over the course of a year (2017). The available measurements are hourly measurements taken over this period.
In Table 3, measurements were recorded during 2017, where the maximum value of GHI was estimated at 824.6 W/m2 in August and the lowest value was estimated at 195.57 W/m2 in November. As for DNI, the maximum value was 60.74 W/m2 in August and 0.262 W/m2 as the lowest value in September. Ambient Temperature (Tamb), estimated at 37.404℃ in July as the maximum value and the lowest value was estimated at 18.82℃ in January. The maximum Relative humidity (RH) recorded in January was 50.06% and the lowest value was 11.786% in July. As for wind speed (WS), the maximum value was 982.01 m/s in April and the lowest value was estimated at 2.35 m/s in November. About WSgust the maximum value recorded in the month of February worth 9.7 m/s and the lowest value was estimated at 2.7911 m/s in September. As for WD, the maximum value was 278.9 m/s in February and 85.888 as the lowest value in October. WDStDev, estimated at 48.2 m/s in February as the maximum value and the lowest value was estimated at 13.486 m/s in November. We conclude this analysis with a maximum value of BP estimated at 1036 in October and the lowest value recorded in May estimated at 4,915.
Using the average wind speed data of KABERTEN city and obtained the active power values generated by a wind generator (Gamesa X8 G52-850KW). The wind potential is characterized by the determination of various quantities:
Mean Wind Speed, Wind Rose and Weibull Distribution;
Energy density, energy produced by the wind farm;
Estimation of the windy wake.
With a number and type of any wind turbine on a given area of the site (surface, height, no calculation) and the results parameters are given for the heights of wind turbines:
The average annual wind speed (m/s);
The two parameters of Weibull law A (scale parameter in m/s), and k (form parameter without unit);
Raw energy production [10, 11];
Peres by wake effect for the park and for each wind turbine.
We chose the Max power, generate each month, with a comparison of values recorded within two years, from (08- 2015 to 07 2016) and from (08-2016 to 07-2017). The results are represented in the following curves:
The region of KABERTEN (Adrar) is one of the most important sites as a wind energy resource. The wind speed in the Algerian desert in recent years has been estimated at more than 4 m / s and more than 6 m / s in the Adrar region [6, 12].
In the following curves, we summarize some changes in the KABERTEN region between (08-2015/07-2016) to (08- 2016/07-2017).
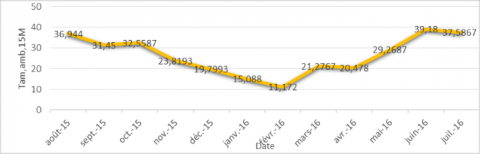
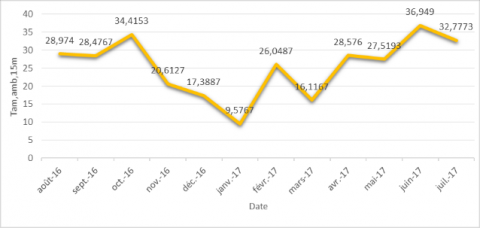
In Figure 11 we summarize changes in wind speed and in Figure 12 we summarize changes in temperature. Figure 13, the energy resulting from the changes in Figure 11 and Figure 12. Figure 11 and 12, the maximum temperature was recorded at 39.18℃ in June 2016. The lowest value recorded in February 2016 was estimated at 11.172℃. With regard to changes in wind speed during this period, the maximum value recorded in September (2015) was 18.2893 m/s, and the lowest value was in December (2015) by 11.7153 m/s.
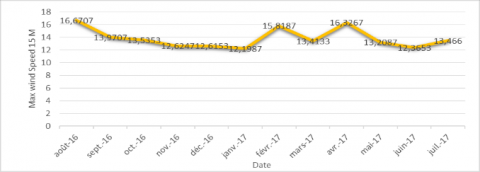
The resulting energy in Figure 13 was estimated at 850.25 KW in July 2016 as the maximum value and the lowest value in December 2015 estimated at 845.418 KW. Figures 14 and 15, the maximum temperature was recorded at 36.949℃ in June 2017. The lowest value recorded in January 2017 was estimated at 9.5767℃. With regard to changes in wind speed during this period, the maximum value recorded in April (2017) was 16.3267 m/s, and the lowest value was in January (2017) by 12.1987 m/s.
The resulting energy in Figure 16 was estimated at 850.4373 KW in April 2017 as the maximum value and the lowest value in October 2016 estimated at 849.596 KW. Comparison of the results between the two years we note that the seasonal variation in wind speed provides information on the availability of wind speed in different months of the year, which facilitates the planning of operation of existing plants in coordination with the wind farm.
In the Algerian desert, wind speed is affected mainly by temperature more than other factors such as terrain, and this was confirmed in the work carried out by chellali and all on a similar location in the desert. This is confirmed by what we obtained from the analysis of these results, as we noticed an increase in wind speed during the summer and spring seasons, compared to the winter and autumn seasons [13].
Figure 11. The changes of the wind speed in the KABERTEN region between (08-2015 to 07-2016)
Figure 12. The changes of the temperature in the KABERTEN region between (08-2015 to 07-2016)
Figure 13. The energy resulting from the changes of wind speed and temperature between (08-2015 to 07-2016)
Figure 14. The changes of the wind speed in the KABERTEN region between (08- 2016 to 07-2017)
Figure 15. The changes of the temperature in the KABERTEN region between (08- 2016 to 07-2017)
Figure 16. The energy resulting from the changes of wind speed and temperature between (08-2015 to 07-2016)
Wind energy is inexpensive compared to other types of renewable energy.
Wind turbines can operate 24 hours non-stop and maintenance of these turbines is not expensive.
The investment of foreigners and private individuals in this field helps to advance the country's economy.
By supporting the activities of local units for generating wind energy, this helps Algeria in investing its energy from wind, as it is expected, according to experts, to return to Algeria with profits of more than two billion euros annually. In addition to the ability of this sector to create thousands of jobs, to provide clean energy [14].
In this manuscript, and to highlight the potential of wind energy in the region of KABERTEN, we analyzed wind speed data where it was reached:
• The average wind speed ranges between 13 m / s and 14 m/s during the years 2015-2016 and 2016-2017.
• In 2016, the highest wind speed values were recorded in April and August, reaching 17.4793 m/s and 16.6707 m/s, respectively. The wind speed is between 12 m/s and 15 m/s throughout the year.
This work is only an estimate of the energy generated by the wind turbines, which have the highest capacity to produce 850 kW. After this study, we can conclude that the wind season coincides with the season of high temperature in this desert region, which makes the increase in demand for electricity consistent with the availability of wind energy that we are using in this study to support stations that depend on fuel to produce electricity. We consider the latter a positive point from an economic point of view.
This work is based on a case study of the wind power plant located in the south of Algeria, in order to continue to shed light on this natural and free energy, which is limited to an area that has a good deposit, so that there are some researches ending on the impossibility of exploiting wind energy in this area. However, the idea that we reached with the research team specialized in this field is a component of the opposite of that research. Adrar is one of the most essential regions to encourage as for exploiting the wind energy projects to generate the power electric.
[1] Daaou Nedjari, H. (2018). L’énergie éolienne en Algérie. Division Energie Eolienne - CDER, Bulletin des Energies Renouvelables N°46-2018. https://www.cder.dz/vlib/bulletin/pdf/ber46_07_09.pdf, accessed on Sep. 18, 2021.
[2] Hamouche, R. (1990). Atlas Vent de Algeria. Publication interne de l’ONM, (Office National de Météologie), Alger.
[3] Merzouk, N.K. (2000). Wind energy potential of Algeria. Renewable Energy, 21(3-4): 553-562. https://doi.org/10.1016/S0960-1481(00)00090-2
[4] Miloud, F.S.B., Aissaoui, R. (2010). Etude du potentiel éolien d’Adrar Sélection de sites pour la ferme éolienne de 10 MW. Séminaire Méditerranéen En Energie Eolienne, 13: 295-300.
[5] Nasser, T.M., Chellali, B., Ali, H. (2016). Impact du vent sur le Comportement électro-énergétique d’un système Hybride à base des énergies renouvelables. The 4th International Seminar on New and Renewable Energies Unité de Recherche Appliquée en Energies Renouvelables, Ghardaïa – Algeria.
[6] Merdaoui, M., Houha, A., Smaïli, A. (2010). Etude et dimensionnement du futur parc éolien de Kaberten situé dans la région d’Adrar. Rev Energ Renouv, 10: 269-274.
[7] Himri, Y., Rehman, S., Himri, S., Mohammadi, K., Sahin, B., Malik, A.S. (2016). Investigation of wind resources in Timimoun region, Algeria. Wind Engineering, 40(3): 250-260. https://doi.org/10.1177%2F0309524X16645483
[8] Rachid, M., Said, D., Boumediene, B. (2012). Wind characteristics analysis for selected site in Algeria. International Journal of Computer Applications, 56(5): 39-46.
[9] Hansen, A.D. (2017). Wind turbine technologies. In Wind Energy Engineering, pp. 145-160.
[10] Himri, Y., Draoui, B., Himri, S. (2008). Wind characteristics of Algeria. Clean Technology. www.ct-si.org.
[11] Dahbi, M., Benatiallah, A., Sellam, M. (2013). The analysis of wind power potential in Sahara site of Algeria-an estimation using the ‘Weibull’ density function. Energy Procedia, 36: 179-188. https://doi.org/10.1016/j.egypro.2013.07.021
[12] Merzouk, N.K. (1999). Carte des Vents de l’Algérie-Résultats Préliminaires. Revue Energ. Ren.: Valorisation, 209-214.
[13] Chellali, F., Khellaf, A., Belouchrani, A. (2010). Wavelet spectral analysis of the temperature and wind speed data at Adrar, Algeria. Renewable Energy, 35(6): 1214-1219. https://doi.org/10.1016/j.renene.2009.10.010
[14] Charrouf, O., Betka, A., Becherif, M., Tabanjat, A. (2018). Techno-economic analysis of wind turbines in Algeria. International Journal of Emerging Electric Power Systems, 19(1): 20170178. https://doi.org/10.1515/ijeeps-2017-0178