Ouadfel Ghania* | Houassine Hamza | Gacemi Abderzak | Bensaid Samir
© 2021 IIETA. This article is published by IIETA and is licensed under the CC BY 4.0 license (http://creativecommons.org/licenses/by/4.0/).
OPEN ACCESS
The work proposed in this paper concerns the study of short circuit faults in a single-phase inverter dedicated to a photovoltaic application by applying the frequency response analysis (FRA) technique on this IGBT-based inverter controlled by a 18F2550 microcontroller, a prototype inverter was designed in the laboratory to be able to apply off-line short-circuit faults using an LRC meter. The FRA technique is based on the comparison of amplitude-frequency and phase-frequency signatures of healthy cases and fault situations. The experimental results also led to the conclusion that frequency response analysis can be used as an effective tool to detect faults in power electronic devices. This method allows for efficient detection and classification of faults with ease of implementation. For fault location, the fault branch is determined according to its position relative to its healthy state.
short-circuit fault, single-phase inverter, frequency response analysis FRA, inverter HF model
The industrial applications of static converters are constantly growing in different fields such as the transport, robotics, the electric traction, the wind and water power production, photovoltaic, and it is thanks to the technological developments in power electronics that have allowed the design of high-performance power converters [1, 2]. In addition, technological advances in digital electronics and the development of increasingly powerful digital calculation processors (DSP, FPGA, etc.) now make it possible to implement modern control algorithms of increasing a complexity at a lower cost [3, 4].
Electrical systems were powered by power converters are exposed to various failures during the operation whose consequences depend significantly on their location [5, 6]. A fault in any component of a power conversion chain can result in a partial or total loss of system control and an unplanned maintenance leading to significant production losses. In other situations, these faults can lead to disastrous consequences and risks for personnel, facilities, and the environment, especially when the systems are integrated into safety-relevant facilities such as transport, health, power grids, robotics, or nuclear power plants [7].
Thus, is essential to monitor the operation of systems and to react to problems at the right time to improve and ensure the safety and reliability of processes. The development of reliable methods of monitoring and quickly detecting faults have received increasing attention in both research and an industry [8]. In the literature there are several methods of diagnosing faults in inverters are classified into model knowledge-based systems, model-based systems, internal methods, external methods, and methods based on signal processing [9, 10]. In this paper, the method used is based on signal processing and analysis. This method was previously applied for the diagnosis and detection of faults in many parts of transformers, especially the windings.
In this study, the most common types of faults in power converters are investigated, especially faults in IGBT components of a single-phase inverter.
Statistical studies show that 38% of all faults that occur in the inverter is related to the switching cells. Different causes are responsible for these failures [9-11], namely thermal aging which has the most impact on the reliability of power electronic components and systems with a percentage of 55%. Other factors such as humidity and the mechanical vibration are closely related to the failure of power components.
All these faults cause a degradation of the converter's performance and even a total or partial shutdown of the drive system. The faults of the power switch in a static converter are the main interest and can classify into two types: short circuit faults and open circuit faults.
In this work, short-circuit faults are explored, it occurs when one of the two switches remain continuously under-voltage, or when the second switch is in turn controlled to close. This fault is due to a malfunction of the transistor driver (a control board fault, a connection problem between the control board and the driver) or a physical fault of the silicon chip resulting from exceeding the operating temperature [12-14].
Short circuit faults in power switches are difficult to handle due to the damaged a component being subjected to high current, a high voltage and excessive local temperatures [15]. In the absence of a protection mode, this fault can propagate and damage the other switch in the same leg in a very short time about few microseconds [16]. The period between the fault initiation and the total failure is very short. Therefore, most methods of diagnostic of short-circuit faults are based on hardware circuits for monitoring the transistors the collector emitter voltage or for tracking the cell current.
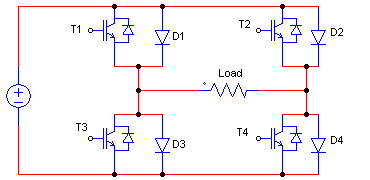
The Figure 1 shows a basic model of single-phase inverter based on semiconductors (T1, T2, T3, T4) that work like switching devices.
Figure 1. Basic configuration of single- phase inverter
It must be ensured that the switches of the inverter legs (T1 and T3, T4 and T2) cannot be activated simultaneously as this would result in a short circuit on the DC supply voltage.
FRA method relies on the collection and analysis of measurable inverter data to perform fault detection and identification, sometimes called "direct methods", based on the comparison between the faulty state and healthy state switches responses. This technique is currently widely used because of its proven reliability. Fault detection by applying the FRA technique is very recent in the field of power electronics, which results in the existence of few works in this field. Research is recommended to analyze and verify the application of this technique on power electronic converters, to show its importance and its ability to detect faults [17-20].
The paper is organized as follows: Section 2: explains the proposed model of the single-phase IGBT-based inverter controlled by an 18F2250 microcontroller. Section 3: gives a brief description of the FRA technique, short circuit faults are applied on the different components. Using the FRA analysis, the healthy components responses are compared to different responses of the faulty components in order to detect the differences between them, the obtained experimental results are discussed. Finally, the conclusions are represented in the last section.
2.1 Proposed model of the single-phase inverter
Figure 2. Microcontroller circuit with 18F2550 under Proteus
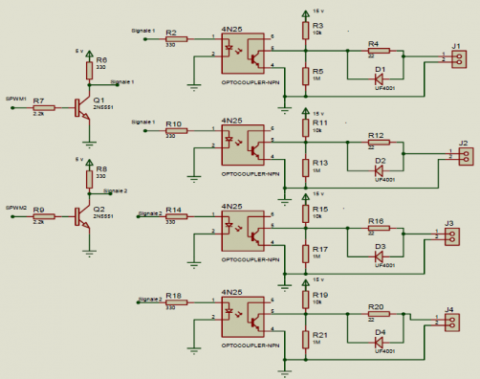
The block diagram of the proposed inverter is presented in Figures 2 and 3, the diagrams are made with the proteus 8 software. The inverter is made of an opto-coupler 4N25, the control part is a 18F2550 microcontroller. The power part consists of power IGBTs, with 4 free-wheeling diodes placed in anti-parallel with each IGBT. The input voltage is provided by a PV generator. The main component of the control part is the 18F2550 microcontroller. The role of the microcontroller is to produce a single-phase PWM waveform.
The power supply for the control part is provided by a 5 volt analogue power supply.
Figure 3. Isolation circuit with opto-copleur 4N25 under Proteus 8
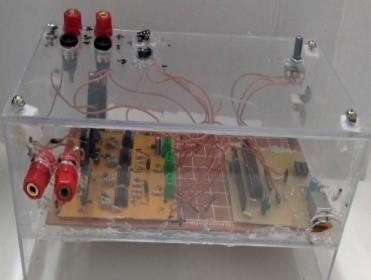
Figure 4 shows the final model of the single-phase inverter after the assembly of these different circuits.
Figure 4. Single-phase inverter realised
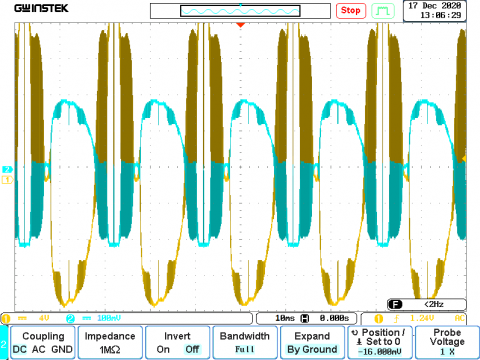
Figure 5. Waveform of the voltage and current at the terminals of a purely resistive load in the experimental test visualized with an oscilloscope
Figure 6. Waveform of the voltage and current at the terminals of a purely resistive load of the theoretical test visualized in Matlab software
To validate the correct operation of the inverter, a resistive load is connected to its output. Figure 5 shows the curve of the voltage and current at the terminals of the load, the voltage and current are in phase.
The current and voltage waveforms shown in Figures 5 and 6 are similar between theory and experiment. The insertion of the filter in the model made to improve the quality of the signal at the output of the inverter.
3.1 FRA principal
The principle of the FRA method is to measure the response of an electrical device over a wide frequency bandwidth. The FRA is non-destructive test is usually performed in off line state for the tested device, so the inverter is unpowered during the test [21]. In FRA test, the input voltage signal applied to device is 0.5 V sinusoidal wave, with 20 Hz to 5 MHz frequency range variation, the obtained frequency responses are the transfer functions of device, which can be the impedance/ frequency and phase/ frequency. these responses depend on the internal behavior of the inverter. Any physical change in the any component induces a modification of its frequency response [22, 23], which makes it possible to detect the presence or absence of the fault in the tested device.
3.2 Experimental test step
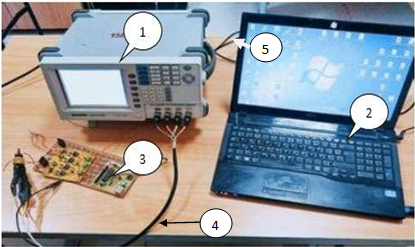
The FRA test measurements are made with an LCR meter 8101G, this LCR meter is capable of measuring a frequency range from 20 Hz to 5 MHz. It is connected between the two input terminals of the single-phase inverter. A program implemented using Matlab software on a PC controls the LCR meter to acquire the measured impedance values. The result of the impedance measurement and the phase of the different tests is automatically sent to a computer for the whole frequency range as shown in Figure 7.
Figure 7. FRA experimental test setup
1- LCR meter 8101G.
2- computer
3- Single-phase inverter
4- LCR metre connection to inverter
5- LCR metre connection to PC
Most existing frequency scan FRA tests exploit only the amplitude/frequency fingerprint information, while the phase/frequency signature is not considered, but it can be a very effective diagnostic tool. The excitation signal Vin(f) and the response signal Iin(f) for all frequency values are used to plot the amplitude/frequency and phase/frequency. as shown in Eqns. (1) and (2) [21].
$Z(f)=20 \log _{10}\left[\frac{V_{i n}(f)}{I_{i n}(f)}\right]$ (1)
$\emptyset(f)=\emptyset\left(V_{i n}(f)\right)-\emptyset\left(I_{i n}(f)\right)$ (2)
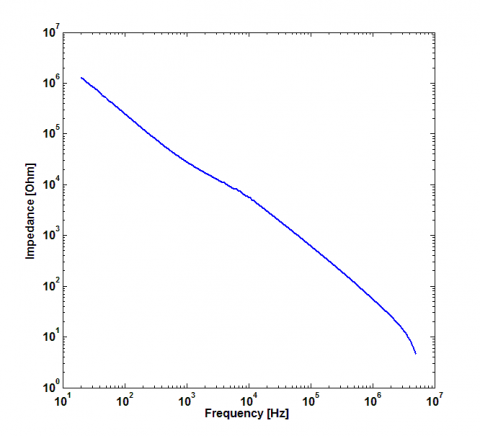
Z(f) is the amplitude-frequency characteristic signature, j(f) is the angle of signal, and f represents different frequency. Figures 8.a and 8.b show the FRA measurement of the single-phase inverter in its healthy state when the amplitude is in the linear and logarithmic scale respectively. Figure 8.c shows the FRA measurement phase of the inverter.
a. linear impedance
b. logarithmic impedance
c. phase
Figure 8. FRA measurement of reference response of the inverter (healthy state)
According to the results obtained from the FRA measurement on the inverter in the healthy state, the equivalent diagram showing the frequency behavior of the inverter can be easily deduced, the impedance model which is a capacitance in parallel with a resistor as shown in Figure 8 [24].
Eq. (3) represents the characteristic of the equivalent high frequency model of the inverter:
$Z(f)=\frac{R}{(2 \pi f R C)^{2}+1}-j \frac{R^{2} C 2 \pi f}{(2 \pi f R C)^{2}+1}$ (3)
From the frequency response curve of the healthy state and Eq. (3), the curve can be divided into three regions:
At low frequency f<102 KHz the comportment of the inverter is similar to a resistor Z(f)=R, at high frequency f<105 KHz, the inverter behavior is similar to a capacitor its impedance is defined as follows:
$Z(f)=\frac{1}{i C 2 \pi f}$ (4)
In zone 2 (medium frequencies) the resistance and the capacitance vary according to the frequency. Figure 10 shows the comparison between the impedance measured by the LCR meter and estimated by the proposed model.
The results from the model represented in Figure 9 are relatively similar to the experimental measured by the LCR meter results. The values of the capacitor and the resistor that ensured this similarity are respectively C=0.066 nF, R=17.7 MW. This value represents only the single-phase inverter used in this experiment; it cannot be considered as a general case of single-phase inverters because each inverter has its own characteristic.
Figure 9. High frequency model of the inverter
Figure 10. Comparison between the impedance measured by the LCR meter and estimated by the proposed model
This work focuses on the study of short-circuit applied to power switches as showing in Table 1.
Table 1. Inverter faults
|
Fault |
Description |
|
F1 |
short circuit fault of each switch alone T1, T2, T3 and T4. |
|
F2 |
short-circuit fault of simultaneously conducting switches T1+T4 and T2+T3. |
|
F3 |
short circuit fault of the cathode and common anode switches T1+T2 and T3+T4. |
|
F4 |
short circuit fault of switches in the same leg T1+T3 and T2+T4. |
The FRA experimental results obtained of all faults studied are presented in Figures 11, 12, 13, and 14.
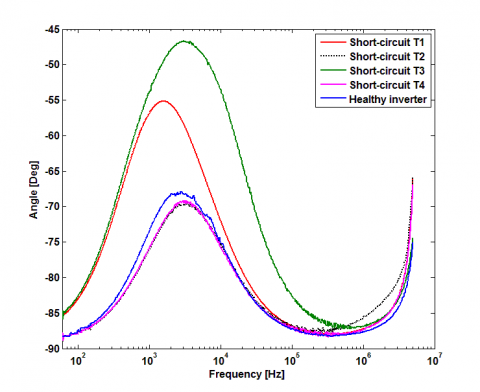
The short circuit fault occurs as a result of a failure in the IGBT driver (driver failure, control board failure, connection problem between control board and driver) or as a result of a physical failure of the silicon chip due to over temperature and is the most likely and common failure mode. The F1 faults that occur in different positions have different effects on the inverter. The experimental curve confirms that the impedance and even phase signatures are affected by the applied fault, as showing in Figures 11 and 12.
Figure 11. FRA measurement of the impedance of F1 short-circuit
Figure 12. FRA measurement of the phase of F1 short-circuit
We can note that:
- The short-circuit faults of (T1, T3) are below, (T4, T2) are above the healthy state characteristic as showing Figure 11. The impedance of the inverter which is given in equation (3) is used to plot Z(f) characteristic of the inverter as shown in Figure 10. It can be seen that at low frequencies the resistance R is very important in the order of Mega-Ohms, whereas the capacitance is null. However, at high frequencies the capacitive behavior is predominant. The determination of the phase:
$\emptyset=\arctan \left(\frac{I_{m}(Z)}{R_{e}(Z)}\right)=\frac{Z-\bar{Z}}{j(Z+\bar{Z})}$$=\frac{-4 \pi f C}{(2 \pi f C R)^{2}+1}$ (5)
From the Eq. (5) we can see that the phase is always negative. From the analysis of this equation, it can be seen that the evolution of the phase as a function of frequency is the inverse of that of the impedance, which can explain the inversion of the position of the curves of (T1, T3) and (T4, T2) in Figure 12 compared to Figure 11.
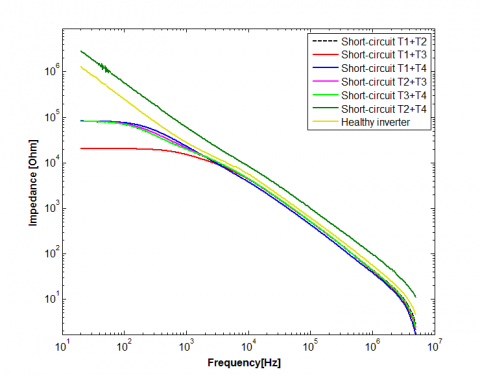
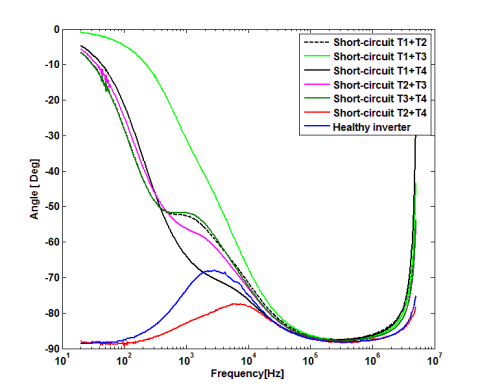
- The faults F2, F3 and F4 their characteristics from frequency 103 KHz are all above the healthy state as shown in the Figures 13 and 14.
Figure 13. FRA measurement of the impedance of F1, F3 and F4 short-circuit
Figure 14. FRA measurement the phase of F1, F3 and F4 short-circuit
IGBT has a complex structure, it contains several capacitors as shown in Figure 15.
Figure 15. IGBT parasitic capacitances [25]
These capacitances have an important effect on the dynamic behavior of the IGBT and even the inverter. A fault is caused by the degradation of one of these parasitic elements, which in turn will change the fingerprint of the inverter from its healthy state.
The application of short circuit fault between the emitter and collector of an inverter component leads to the cancellation of the capacitance Cce between collector and emitter, just the capacitances Ccg and Cge which will define the parameters of the shorted component. However, the proposed diagnostic method is implemented as a comparative method, it is of vital importance that the detected changes in the frequency range between the two systems are taken into account.
In other words, each fault creates a new internal architecture of the inverter, which explains the difference in impedances for each applied fault, as each fault has its own equivalent circuit.
Comparing the results of faults F1, F2 and F3, F4 with the FRA measurement in the healthy state, i.e. the transfer function Z(f) carries information on all parasitic elements including the control and isolation circuit elements, it is clear that each fault has its own transfer function and this is visible by the changes in amplitude and phase of the measured signals presented in Figures 11, 12 and 13, 14.
The FRA technique does not generalize the impedance values of each inverter, as these parameters change with each type of inverter, and in order to dimension them, measurements must be made each time.
This work treats the detection and diagnosis of faults of a power switch in a single-phase inverter controlled by a microcontroller. The technique of frequency response analysis has been proposed for fault detection and diagnosis. Semi-conductor components are the core of power electronics systems, they are fragile so monitoring their condition is critical phase. FRA testing can be a primitive test to ensure the good functioning of the power device. The FRA exploits the high frequency equivalent model of the devices; therefore, it is difficult to establish an accurate and universal equivalent model taking into account all internal parameters. The frequency response analysis method has proven to be reliable, simple and fast, economical and non-destructive diagnostic tool for fault diagnosis, but its major disadvantage is that it is very sensitive to measurement noise. FRA takes into consideration all internal and external factors, e.g. equipment cabling, parasitic impedance, noise, which requires experiences personnel, as there are no systematic or standard technique or codes for interpreting FRA tests at this time. It is evident that this technique could be an effective and fast means of diagnosis. In the future, the application of other faults could classify the FRA technique as an indispensable tool in the diagnosis of faults in power electrical devices.
We would like to thank the Materials and Sustainable Development Laboratory LM2D for providing the equipment to execute the FRA measurement.
|
FRA |
frequency response analysis |
|
IGBT |
insulated-gate bipolar transistor |
|
PWM Z |
Pulse Width Modulation Impedance, Ohms |
|
f |
Frequency , Hz |
|
Greek symbols |
|
|
$\varphi$ |
Phase, angle , deg |
[1] Iov, F., Blaabjerg, F. (2009). Power electronics for renewable energy systems. In 2009 International Conference on Power Engineering, Energy and Electrical Drives, pp. 9-12. https://doi.org/10.1109/powereng.2009.4915139
[2] Wu, Z., Liao, H., Lu, K., Zavadskas, E.K. (2021). Soft computing techniques and their applications in intelligent industrial control systems: A survey. International Journal of Computers Communications & Control, 16(1): 1-28. https://doi.org/10.15837/ijccc.2021.1.4142
[3] García, G.J., Jara, C.A., Pomares, J., Alabdo, A., Poggi, L.M., Torres, F. (2014). A survey on FPGA-based sensor systems: Towards intelligent and reconfigurable low-power sensors for computer vision, control and signal processing. Sensors, 14(4): 6247-6278. https://doi.org/10.3390/s140406247
[4] Shawahna, A., Sait, S.M., El-Maleh, A. (2018). FPGA-based accelerators of deep learning networks for learning and classification: A review. IEEE Access, 7: 7823-7859. https://doi.org/10.1109/access.2018.2890150
[5] Un-Noor, F., Padmanaban, S., Mihet-Popa, L., Mollah, M.N., Hossain, E. (2017). A comprehensive study of key electric vehicle (EV) components, technologies, challenges, impacts, and future direction of development. Energies, 10(8): 1217. https://doi.org/10.3390/en10081217
[6] Li, Q., Wang, L., Hou, S. (2018). Microgrid reliability evaluation based on condition-dependent failure models of power electronic devices. In 2018 2nd IEEE Conference on Energy Internet and Energy System Integration (EI2), pp. 1-6. https://doi.org/10.1109/ei2.2018.8582498
[7] Fischer, K., Pelka, K., Puls, S., Poech, M. H., Mertens, A., Bartschat, A., Wenske, J. (2019). Exploring the causes of power-converter failure in wind turbines based on comprehensive field-data and damage analysis. Energies, 12(4): 593. https://doi.org/10.3390/en120405930
[8] Elattar, H.M., Elminir, H.K., Riad, A.M. (2016). Prognostics: A literature review. Complex & Intelligent Systems, 2(2): 125-154. https://doi.org/10.1007/s40747-016-0019-3.
[9] Fuchs, F.W. (2003). Some diagnosis methods for voltage source inverters in variable speed drives with induction machines-a survey. In IECON'03. 29th Annual Conference of the IEEE Industrial Electronics Society (IEEE Cat. No. 03CH37468), 2: 1378-1385. https://doi.org/10.1109/IECON.2003.1280259
[10] Lu, B., Sharma, S.K. (2009). A literature review of IGBT fault diagnostic and protection methods for power inverters. IEEE Transactions on industry applications, 45(5): 1770-1777. https://doi.org/10.1109/TIA.2009.2027535
[11] Song, Y., Wang, B. (2013). Survey on reliability of power electronic systems. IEEE Transactions on Power Electronics, 28(1): 591-604. https://doi.org/10.1109/tpel.2012.2192503
[12] Gomathy, V., Selvaperumal, S. (2016). Fault detection and classification with optimization techniques for a three-phase single-inverter circuit. Journal of Power Electronics, 16(3): 1097-1109. https://doi.org/10.6113/JPE.2016.16.3.1097
[13] Kamel, T., Biletskiy, Y., Diduh, C.P., Chang, L. (2012). Fault diagnoses for all the stages of the power electronic converter. In 2012 25th IEEE Canadian Conference on Electrical and Computer Engineering (CCECE), pp. 1-4. https://doi.org/10.1109/ccece.2012.6334990
[14] Pei, X., Nie, S., Kang, Y. (2014). Switch short-circuit fault diagnosis and remedial strategy for full-bridge DC-DC converters. IEEE Transactions on Power Electronics, 30(2): 996-1004. https://doi.org/10.1109/tpel.2014.2310201
[15] Wang, B., Cai, J., Du, X., Zhou, L. (2017). Review of power semiconductor device reliability for power converters. CPSS Transactions on Power Electronics and Applications, 2(2): 101-117. https://doi.org/10.24295/cpsstpea.2017.00011
[16] Cheng, H., Chen, W., Wang, C., Deng, J. (2018). Open circuit fault diagnosis and fault tolerance of three-phase bridgeless rectifier. Electronics, 7(11): 291. https://doi.org/10.3390/electronics7110291
[17] Alsuhaibani, S., Khan, Y., Beroual, A., Malik, N.H. (2016). A review of frequency response analysis methods for power transformer diagnostics. Energies, 9(11): 879. https://doi.org/10.3390/en9110879
[18] Alawady, A.A., Yousof, M.F.M., Azis, N., Talib, M.A. (2020). Frequency response analysis technique for induction motor short circuit faults detection. International Journal of Power Electronics and Drive Systems, 11(3): 1653-1659. https://doi.org/10.11591/ijpeds.v11.i3.pp1653-1659
[19] Khalilisenobari, R., Sadeh, J. (2021). A novel numerical index for assessing results of Frequency Response Analysis (FRA): An experimental study on electrical machines. In 2020 52nd North American Power Symposium (NAPS), pp. 1-6. https://doi.org/10.1109/NAPS50074.2021.9449826
[20] Alsuhaibani, S., Khan, Y., Beroual, A., Malik, N.H. (2016). A review of frequency response analysis methods for power transformer diagnostics. Energies, 9(11): 879. https://doi.org/10.3390/en9110879
[21] Zhao, Z., Yao, C., Tang, C., Li, C., Yan, F., Islam, S. (2019). Diagnosing transformer winding deformation faults based on the analysis of binary image obtained from FRA signature. IEEE Access, 7: 40463-40474. https://doi.org/10.1109/access.2019.2907648
[22] Wang, B., Cai, J., Du, X., Zhou, L. (2017). Review of power semiconductor device reliability for power converters. CPSS Transactions on Power Electronics and Applications, 2(2): 101-117. https://doi.org/10.24295/cpsstpea.2017.00011
[23] Meisser, M., Schmenger, M., Blank, T. (2015). Parasitics in power electronic modules: How parasitic inductance influences switching and how it can be minimized. In Proceedings of PCIM Europe 2015-International Exhibition and Conference for Power Electronics, Intelligent Motion, Renewable Energy and Energy Management, pp. 1-8.
[24] Aprilia, E.C., Ćuk, V., Cobben, J.F.G., Ribeiro, P.F., Kling, W.L. (2012). Modeling the frequency response of photovoltaic inverters. In 2012 3rd IEEE PES Innovative Smart Grid Technologies Europe (ISGT Europe), pp. 1-5. https://doi.org/10.1109/isgteurope.2012.6465841
[25] Tan, J., Zhu, Y., Lu, S., Yu, Q. (2017). Modeling of input capacitance of IGBTs under dynamic conditions. International Journal of Circuits, Systems and Signal Processing, 11: 157-161.