Jose Oscullo* | Carlos Gallardo
© 2020 IIETA. This article is published by IIETA and is licensed under the CC BY 4.0 license (http://creativecommons.org/licenses/by/4.0/).
OPEN ACCESS
Nowadays, the operation of electrical systems presents technical challenges associated with the operational dynamics present in increasingly charged systems. Due to the low-frequency oscillations generated given the continuous change in demand and the exchange of power between the different areas of the system, under this context, it is interesting to analyze the incorporation into the power system stabilizer (PSS) of information received and processed in the wide-area measurement system (WAMS). To address the problems of small-signal stability; present in the electric power system of manner off-line to have a PSS tuning bank for a group of dispatch. Since the state variables in the power system are stochastic, this paper proposes a probabilistic method based on Monte Carlo that together with the heuristic algorithm of mean-variance mapping optimization (MVMO) allows determining the number of PSSs, their location and the tuning parameters of PSSs this guarantee stability of the system at the new operating point. The proposed methodology is applied in the New England 39 bus system. The results show that PSSs adjusted using the proposed method to improve the response of the small-signal stability.
monte Carlo, power system stabilizer, WAMS, heuristic algorithms, probabilistic modal analysis, small signal stability
Thanks to the viability of monitoring the dynamic behavior of an electrical power system, by means of synchrophasors of the AC voltage and current signals of node of system, a situation that has opened a new option for the evaluation of oscillatory stability in real time, through the PMU (phasor measurement unit) which has an update rate of between 10 to 60 phasors per second, and properly processed enables the obtaining of the frequency and damping of the oscillatory modes resulting from the operation of the system electric [1].
Nowadays, PMUs have become a requirement for input of new system installations, a reality that allows real-time monitoring of their dynamics; which, together with advanced algorithms of digital signal processing, allows to have distributed measurements in the power system through the WAMS system, through the same being able to have information on the real oscillatory behavior of the system, after a disturbance has occurred.
Understanding the stability of small-signal (SSS) as the ability of the power system to maintain synchronism under small disturbances, which allows the linearization of the system equations at the analyzed operating point and applying the linear state space technique. It is possible to analyze the stability of the system through the values of its state matrix. But many uncertainty factors affect SSS, for example; the dynamic deviation in the parameters of the generator and their respective controls, change in demand, modification of network parameters, power exchange between different areas of the system, etc. Thus, the uncertainty in the operation of the system generally must be considered by the probability of the event that allows analyzing the stability.
Therefore, stability analysis constitutes a probabilistic problem rather than a deterministic one, due to the factors of system disturbances in conjunction with the conditions of the system are stochastic. Field where probabilistic methods are suitable for analyzing uncertainties due to their mathematical nature that allow it to be analyzed more efficiently and robustly than considering a particular operating scenario as in deterministic methods [2, 3].
Considering the randomness of wind energy [2] a tuning scheme of PSSs is presented; through the establishment of a composition of the cumulative distribution functions related to the generation power of the generators with the highest waste and together with the exchange power between two selected areas, considering the behavior of Gaussian functions, the SSS is evaluated; by which the cumulative distribution function of the damping and frequency error of the mode of interest with respect to the operation without PSSs will have determined.
A probabilistic method [4] based on the combination of the analytical method and the differential evolution algorithm is used to adjust the PSSs considering the uncertainty of generation and load. While in the research [5] the coordination between the static var compensator (SVC) and the PSSs is analyzed to improve the stability of small signal considering a probabilistic analysis in conjunction with the bioinspired algorithm in the fruit fly, the controller parameters are determined of power oscillations damping (POD) of the SVC and PSSs for a system with high penetration of wind generation.
The expected value method (a.k.a expectation model) [6] of the system eigenvalues is used, through the probabilistic analysis of the time delay variable of the exchange power obtained in the PMUs, where it is shown that an adequate adjustment of the PSS gain allows limiting the effect of the time delay by improving the SSS.
The stability of small-signal has been evaluated through the cumulative probability method considering the stochasticity of the generation of an offshore wind farm and the connection strategies utilizing the HVDC topology as studied by Bu et al. [7]. The quasi Monte-Carlo method is applied in the study [8] for the analysis of small-signal stability considering both the hybrid vehicle connection and the wind generation input.
A combination of Monte Carlo and fuzzy c-means cluster has been applied to a wind-hydroelectric power system to improve the stability of small-signal, considering N-1 contingencies in the generator or exchanges between areas; where Monte Carlo allows to evaluate the SSS through indices, as shown in previous studies [9, 10].
An analysis of SSS [11] is presented considering the stochasticity in the time delay of PMU signals that feed the POD of the wind and/or solar generation units which are parameterized using swarm intelligence algorithm techniques through the accumulated probabilistic method.
The present work looking for to tune the PSSs in a multi-machine system through construction of a matrix that includes, on the one hand, the information of the WAMS system, such as frequency and damping ratio of mode of interest, and on the other hand, the electrical variables of the system operation; considering the modification of the demand and the N-1 contingency of the generators or transmission lines, obtained through Monte Carlo and clustered by k-means. This is organized as follows: Section 2 presents the different methodologies and tools considered for the modeling and control of electrical system. Section 3 contains the proposal methodological that allows achieving the damping of the oscillations for the multi-machine and multiescenario system. Section 4 presents the characteristic of the study system and the main results with its analysis. Finally, section 5 presents the conclusions of the study.
2.1 General description of the energy system with a wide area measurement system-WAMS
When a power system has two or more PMUs, distributed in different nodes of the system, and additionally it has the software for processing and analyzing the monitored data, it is called the wide-area measurement system. Therefore, every electrical system requires adequate handling of a large volume of synchronized measurements from PMUs [12].
Since WAMS system measurements are stored in spatial-temporal data sets, this information of the electrical system constitutes the data obtained in specific and regular instants through the operating time, that is, it is a series of time; either from the measurement of a physical variable or product of an optimization algorithm [13]. This sequence of data collected it allows the operator to monitor the system status. The signals of the WAMS system can contribute together with other variables of the system to analyze the stability and determine a signal that feeds a generator control equipment and thus improve the SSS.
2.2 Brief review of small signal stability of power system
The dynamics of a non-linear system constitute a response that depends, on the one hand, the parameters of the elements that store and transfer energy, and on the other on the magnitude of the disturbance. In electrical system the dynamics are represented by means of nonlinear differential-algebraic equations through which the oscillations present in the normal operation of the system are obtained due to the variation of the dispatch (operative scenario) to supply the changes of the demand, that is, the system has a characteristic quasi-stationary operating point that allows the linearization of nonlinear equations around the operating point [14]. A set of algebraic differential equations as Eq. (1).
$\begin{aligned}&\dot{x}=g(x, u)\\&y=h(x, u)\end{aligned}$ (1)
where, x represents the state variables, u is the vector of input algebraic variables and y is the vector of outputs while g the differential equations, and h algebraic equations.
In the equilibrium point is satisfying a Eq. (2).
$g\left(x_{o}, u_{o}\right)=0, y_{o}=h\left(x_{o}, u_{o}\right) $ (2)
For a small deviation from the equilibrium point the behavior of the system is $x=x_{o}+\Delta x$, $u=u_{o}+\Delta u$. It possible stableshing the linearized model as Eq. (3) [15].
$\Delta \dot{x}=A \Delta x+B \Delta u$ (3)
The matrices of modal analysis are $A_{n x n}$ is the state matrix, $B_{n x r}$ is the input or controllability matrix. The small-signal stability of the system is determined by the roots of the characteristic Eq. (4) of the state matrix A, which constitute the eigenvalues represented by λ.
$\operatorname{det}(\lambda I-A)=0$ (4)
where, $\lambda_{i} \in \mathbb{C}$ is the i-th eigenvalue of the matrix $A_{n x n}$, by which it is possible to determine the stability of the system it is stable, when the real part ($\sigma$) of all eigenvalues is negative, which represents a measure of the damping of each oscillation mode. While the imaginary part ($\gamma$) sets the natural frequency of the oscillation mode. With which the damping factor ($\xi$) and frequency swing (f) of the oscillation mode is determined through of Eq. (5) and for an electrical system it is considered sufficient to have a damping factor greater than or equal to 5% of all the eigenvalues of the system [16].
$\xi=\frac{-\sigma}{\sqrt{\sigma^{2}+\gamma^{2}}}$
$f=\frac{\gamma}{2 \pi}$ (5)
2.3 Monte Carlo simulation for small signal stability
The probabilistic evaluation of small-signal stability (PSSS) seeks to analyze stability under uncertainty. The PSSS determines the critical value based on uncertainty considering the probability distribution function (pdf), either from the generation resources (such as wind, solar) or from the load. The generally accepted simulation method is that of Monte Carlo (MC), which is a repetitive procedure where the system response is evaluated iteratively using a set of input variables that are generated randomly from its pdf. The PSSS can be carried out by evaluating all possible operating conditions due to the variation in demand [9, 16].
The probabilistic small signal stability procedure using the MC method is depicted in Figure 1.
Figure 1. MC method applied to the evaluation of small signal stability [9]
The procedure consists in interaction of three steps: 1) Generation operative scenario, 2) Modal analysis considering of simulation case y 3) Building of matrix of operation system.
2.3.1 Generation operative scenario
The simulation of MC starts from the dynamic model of a system for analysis of the stability of small-signal. For establishing of modelling of the system, it needs data of parameter of the electric network, event (N-1 contingency of generation or exit of an electric line), the parameter of generators and each load required for software DIgSILENT PowerFactory uses in this study. Additional, so demand consider as a stochastic variable utilizing the probability functions it allows to build new scenario.
Each scenario evaluates flow power and condition initials iteratively that permit generates different scenarios operating from stochastic load data (generated from their pdfs), for the study a uniformed distribution is used. More, it is possible to use others such as the normal distribution.
2.3.2 Modal analysis scenario
For each scenario, determine the modal analysis of Eqns. (1) to (5), which allows calculating the eigenvalues, damping ratio and the frequency of modes swing and together with others such as power and voltage in bus system. This data is saved for case up to the number of simulations established.
2.3.3 Building of matrix of operation system
Those stored data permits to construction the matrix which scenario saves in rows based on probabilistic results, which, for this type of stability study, the common number of simulations required for power system analysis is approximately 1000, through which a guaranteed mean sample error of 0.3% occurs with a 99% confidence interval [17].
2.4 Power system stabilizers
PSSs are elements that produce an additional signal to voltage regulator of generator (AVR), through to increase the limits of small-signal stability. It allows adding component to the electrical power $P_{ei}$ of i-th generator based on the deviation of the actual rotor speed ($\Delta \omega$) from the synchronous speed, as indicated in Eq. (6); where α represents the PSS response [18].
$\dot{\omega}_{i}=\frac{1}{2 H_{i}}\left(P_{m_{i}}-P_{e_{i}}-\alpha_{i} \Delta \omega_{i}\right)$ (6)
From Eq. (6), it is established that each generator connected, presents a constant of inertia $H_{i}$ before the rotation due mainly to the turbine which exerts a mechanical power $P_{m_{i}}$ at an angular velocity in opposition to electrical power $P_{e}$.
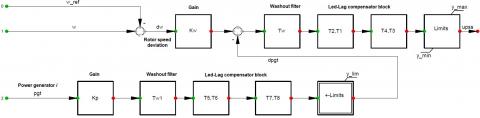
In Figure 2 shows the PSS model implemented in DIgSILENT PowerFactory. This work has been done in Digital Simulation Language (DSL) language and based on the Eq. (6).
By tuning PSS the gains (Kp, Kw), and time constants (T1 to T8) it is done with the residue of critical mode, using MVMO heuristic algorithm, in order to move the real part of the eigenvalue to the left (stable zone) of the complex plane; with which the limit of damping swings established is reached.
Figure 2. Structure of the PSS using in paper
2.5 Principal components analysis
The analysis of principal components (PCA) (a.k.a orthogonal empirical functions), it is a model reduction technique, whereby a set of variables (denominated originals) is transformed into a new set of variables (a.k.a principal components (PC)) where each component has the greatest variance that explains the variance of the data set.
In the case of the power system, the measured data of the WAMS system is constituted in a spatially distributed time series, that is, they can be grouped into spatial-temporal matrices of time series of a group of variables measured in different nodes of the system [1].
The description of the technique is presented below based on what is presented in the researches [1, 19, 20]. Each row of the data matrix represents the temporal evolution of the monitored measurements or data processed by WAMS system at time t. That is, the variables obtain operation level, and it is appropriately structured so operation matrix name X (instantaneous) of m x n dimensions, as shown in section 2.3.3. Where m is the selected sampling operation system and n number of load bus system plus damping ratio and frequency of critical swing mode of the analysis system for the case study system with 5000 simulation, the operation matrix is X5000x21.
We assume that each series has a zero mean (if this is not the case, the average is subtracted before the analysis). They seek to convert the correlated original data series x1; x2 … xm or an uncorrelated series c1; c2 … cm through linear transformation. Where the correlation matrix Ϲ of X is set to (7).
$c=\frac{1}{1-n} X X^{T}$ (7)
From matrix Ϲ the eigenvalues (λi) and eigenvectors ($\lambda{i}$) of the covariance matrix of the original data are determined.
Adding the eigenvalues (λi) of the PCs is equivalent to the total variance of the data matrix. Each eigenvalue shows the variability explained (EVi) by i-th PC. Thus, the number of selected PCs depends on the desired explained variability, as stated by (8) [20].
$E V_{i}=\frac{\lambda_{i}}{\sum_{j=1}^{p} \lambda_{j}} .100$ (8)
2.6 k-means clustering
The grouping of data seeks to form groups of data with similar characteristics. Although there are several methods, everyone seeks to determine the optimal number of groupings that guarantee that the data belonging to a group have sufficient similarity of characteristics and when selecting one allows to know the characteristics of the group. k-Means clustering algorithm is widely used and accepted due to its computational simplicity. However, the method is prone to noise and requires that the number of groups is determined before grouping [21].
To define the optimal number of groups, it is done by establishing several groupings where the best solution is determined based on the Silhouette index where it measures the tolerance of a data belonging to the group. The research [22] contains the detailed description of k-Means algorithm and formal index definitions.
The k-means algorithm allows obtaining k groups selected by the user. This situation adjusts in the determination of representative system operating scenarios for which there is a bank of tuning parameters of PSSs and allow to have the broadest range of damping of the oscillations with scenario number minimum possible.
2.7 PSS tuning using the MVMO optimization heuristic algorithm
Mean-variance mapping optimization (MVMO) is a meta-heuristic optimization technique based on mechanisms such as natural selection, natural genetics, evolution or statistical and offspring concepts, the latter, included in the special mapping function, based in the mean and the variance analyzed in each iteration, which allows achieving better convergence characteristics [23].
Each solution (particle) is evaluated m times in the objective function to establish a set of possible solutions, then among all the solutions of n particles, the global optimal solution is sought and thus discard both the other and the next solutions (employing the criterion of Euclidean distance). Moreover, using natural characteristics a new population (offspring) of the best solutions is generated where the mean and variance are analyzed to redefine the global optimum. In [24] The meta-heuristic optimization technique [24] can be analyzed with a wide explanation.
The use of information obtained through the WAMS system has allowed us to modify how operators can monitor the state of the system. In particular, with the possibility of obtaining fast and accurate information about the dynamics of the system.
Today, it uses of WAMS has reached widely utilization by several operators of electrical systems for offline studies and fault analysis. In the case of real-time, it has a developed of applications for analyzing phenomena that have not yet fully matured. The situation may be since operators do not trust the quality of information, as well as, all new technology requires a period to get used to performing. Therefore, it is necessary to continue with the development of operator friendly-applications, through which they allow analyzing the dynamic phenomenon of system.
We proposed methodology looks for taking advantage of a large amount of information in the WAMS system regarding system dynamics and extracting information from the frequency and damping of oscillatory modes of low-frequency. Which is established in three stages, as summarized in Figure 3.
How first, the power system has required necessary models they are defined that allow dynamic analyzing of the system with his limits of SSS like damping of oscillation. The probabilistic models of the input variables of system (generation or load) in this case of analysis is considered a probability function with normal distribution for the load it defines operating scenarios with the contingencies of elements in an electrical system has several impacts over SSS, which is because they are indispensable in analysis of PSSS [10].
Thus, a small group of N-1 contingencies (lines by exchange electricity into areas and generator) in each operating scenario through an optimal power flow, and then proceed to the modal analysis of the oscillatory behavior of the power system and determine the damping ratio, frequency, participation factors and residue of oscillation modes of interest properly stored in a matrix.
Matrix shows in (9) it is obtained as join variable modal analysis and variables to obtain simulated operating of a power system. The information related less damped oscillatory mode of the system is collected in each execution of modal analysis of different operating states of the power system and stored in the stability-operation matrix for use in the next stage.
$E_{e_{n}}=\left[\begin{array}{ccccccc}d_{1} & \xi_{1} & f_{1} & P_{1 j} & Q_{1 j} & V_{1 j} & \theta_{1 j} \\ d_{2} & \xi_{2} & f_{2} & P_{2 j} & Q_{2 j} & V_{2 j} & \theta_{2 j} \\ d_{3} & \xi_{3} & f_{3} & P_{3 j} & Q_{3 j} & V_{3 j} & \theta_{3 j} \\ & & & \vdots & \vdots & \vdots & \\ d_{t} & \xi_{t} & f_{t} & P_{t j} & Q_{t j} & V_{t j} & \theta_{t j} \\ &&& \vdots & \vdots & \vdots & & \\ d_{n} & \xi_{n} & f_{n} & P_{n j} & Q_{n j} & V_{n j} & \theta_{n j}\end{array}\right]$ (9)
where, di is the selected sampling operation system, Pnj active power of case n in the load j-bus system, Qnj reactive power of case n in the load j-bus system, Vnj voltage of case n in the load j-bus system, θnj angle voltage of case n in the load j-bus system. Each sampling of operation contains damping ratio (ξ), and frequency (f) of representative and determined critical mode swing by studying the information of the WAMS system, for each bus generator.
The system is considered to have sufficient damping when the critical modes have ξ³5% so in the study [24]. The specialized literature states that critical modes are classified into four groups based on their frequency and the distribution of dispatched generators: inter-area mode (0.05-0.5 Hz), intra-area mode (0.5-0.8 Hz), local mode (0.8-1.8 Hz) and interplant mode (1.8-3 Hz) [15, 17].
As the second step of the proposal, the operation matrix determined like it shows in (9) it is processed through PCA analysis to obtain principals components, and this is possible it had been done to cluster of dispatch by each oscillation modes through the k-means algorithm, and this allows to find representative dispatch (centroid) of frequency oscillation mode analyzing with PMU measurements.
For each dispatch centroid selected in the third step, the damping ratio of all oscillations modes of operation matrix is determined through modal analysis, as well as, eigenvalues, eigenvectors, and residue that properly store. This information and it has been using MVMO algorithm are tuned PSSs so that oscillation modes meet the reasoning limit raised in the objective function.
Figure 3. The proposed method to tune the PSSs under the probabilistic approach to the small-signal stability of the electrical system
The MVMO find out optimal tuning PSSs through of residue the coordination locates of PSSs, which properly parameterized and activated allow to achieve the damping of all scenarios for all oscillatory modes (OM), employing the following objective function proposed in (10):
$\begin{array}{l}\min F O=\left|\xi_{t h}-\xi_{s y s}\right| \\\xi_{s y s}=\min _{i=1 \ldots n}\left\{\min _{p=1 \ldots k}\left(\xi_{i p}\right)\right\}\\\end{array}$
Subject to:$S_{\min } \leq S \leq S_{\max }$ (10)
where, $\xi_{t h}$ is the minimum accepted damping (in this work it is considered ξ ≥ 10%), $\xi_{sys}$ is the minimum damping of the system for each scenario. The vector x represents the variables of interest, in this case, the different parameters of the PSS (gains and time constants).
4.1 Test system
The test system for the application proposal methodology it is a New England System contains 3 areas, 16 generators and 80 bus with a level voltage of 380 kV, 220 kV, and 110 kV. Generators connect at a level 15.75 kV, loads model as constant power. The power grid represents in Figure 4. It is widely used to studying small signal stability. It considers that each generator has PSSs.
Generation park performs as follows: all generators are thermal, except the generators A1, A2 and A3 that are model hydraulic this situation allows us to show the generality of production sources of an electrical system, the slack node is the bus of B3G generator.
Each generator has an IEEE type 1 excitation system, in which the signal of the PSS model proposed allows monitoring the speed and power of the generator, which seeks to improve the damping, of the low-frequency oscillations of a power system. The time constants TW, TW1, is considered a value of 10 seconds.
To define the activation of the PSSs in the study system, it is carried out by means of the calculation of the residues of the oscillation modes that do not meet the damping ratio, through which the stability of small is satisfactorily guaranteed signal in the system; 10% is considered for the study; which ensures adequate damping of low frequency oscillations.
Figure 4. New England 80-bus test system
4.2 Simulation results
Due to the non-linear characteristics of the power system, it is necessary to verify the success of the tuning of the PSSs through time-domain simulations. This system simulation performers in DIgSILENT PowerFactory version 15.1.7, software that allows studies of power flow, small-signal stability its simulations in time domain among others which, together with analysis tools such as Python it has allowed us to carry out the different steps of the methodology proposed in section 3.
By each topology of the power system in which considers N-1 contingency in each scenario, it establishes dispatch across optimal power flow and studying of small-signal stability without PSSs of system. The analysis has three different load scenarios (minimum, mean, and high). Table 1 shows modal analysis in each scenario without PSSs, so there is mode swing in region unstable (eigenvalues with the positive real part in red). All modes swings have a damping ratio of less than 10% establish for study. The study [25] has been discussed widely the need of installing a PSS in a power system in order to introduce additional damping to the rotor oscillations of generators.
For this study is obtained 5000 different operating scenarios through MC they consider modifying load and N-1 contingency of device grid in each scenario. In Figure 5, it shows the probability distribution function of the damping ratio of the critical oscillation mode in each scenario without considering the PSSs, where it observes that they have a behavior similar to the normal distribution, in which the average is less than or equal to zero, which indicates that the system is negatively damped.
Table 1. Oscillation modes of test system – without PSS
|
Scenario |
Mode |
Eigenvalue |
Frequency [Hz] |
Damping ratio [p.u] |
|
Low |
82 |
-0.202 ± 4.653 |
0.741 |
0.043 |
|
85 |
-0.466 ± 4.766 |
0.759 |
0.097 |
|
|
90 |
0.132 ± 3.660 |
0.584 |
-0.036 |
|
|
Mean |
104 |
-0.399 ± 5.269 |
0.839 |
0.075 |
|
113 |
0.091 ± 3.849 |
0.613 |
-0.024 |
|
|
115 |
-0.255 ± 3.400 |
0.541 |
0.075 |
|
|
High |
101 |
-0.373 ± 5.253 |
0.836 |
0.071 |
|
113 |
0.146 ± 3.576 |
0.569 |
-0.041 |
|
|
115 |
-0.232 ± 3.410 |
0.543 |
0.068 |
Figure 5. PDFs of damping ratio of representative mode by scenario of demand
So, the system is unstable and necessary look for an operation stable this must be improved through tuning of PSSs. Next, in Figure 6 signs modal analysis scenario of high demand without PSSs (unstable mode is stand out in red) and also in the case with PSSs (blue color). Due to the activation of PSSs, the system achieves that all modes swings are located in the stable zone.
In Figure 7 illustrates the impact of modification of variables on the modal analysis of the simulated operating states of the system, the variation of the frequency and the damping ratio associated with the less damped oscillatory mode for the case without and with PSSs. According to the frequency, it is an inter-area mode. In the case of not considering the PSSs, the frequency of the least damped oscillatory mode varies along the simulated operating conditions between 0.52 and 0.73 Hz, while when including the PSSs it varies between 0.93 and 2.34 Hz and it is possible to increase the damping ratio of the system, given the variation of the load or the contingencies considered.
Additional, frequency and damping ratio of least damping oscillation mode intrinsically each point in Figure 7 represents one dispatch of conditions operatives in each case the matrix of stability-operation is structured as stated in section 3.
This matrix is structured and it contains damping ratio and frequency of the least damping oscillation mode by dispatch and each variable operative could be obtained either from the information of the WAMS system or set variables of power system analysis.
Figure 6. Displacement of oscillation modes of system in high demand scenario
Figure 7. Damping ratio and frequency of the least damped oscillatory mode for the low demand scenario
Due to a large amount of information, it is necessary to carry out a clustering dispatch it determines centroids by each cluster. It is based in the matrix that contains modal properties and operating conditions. PCA method is applied for operation matrix where it is established that the first five PCs explain 98.09% as indicated in Figure 8, this uses for clustering.
Figure 8. EV of the stability-operation matrix
Then, k-means are used to defining a cluster of scenarios where the number of clusters is determined through the Silhouette index it measures the tolerance of data belonging cluster. In Figure 9 distribution of operative scenarios is showed for the first two principal components that explains the best variance. Black dots stand out centroid locations of each cluster, referred to as D1, D2, and D3 which can be considered as the three most representative dispatch among all dispatch analyzed in the scenario.
Figure 9. Determination of centroide dispatch of cluster
For each representative dispatch (centroid) is obtained tuning the PSSs actives. The convergence process of the objective function proposed in section 3 is indicated in Figure 10.
For comparing the stability of the power system when determining representative operating points of various scenarios and having a bank of tuned parameters of PSSs, the application of the methodology for the case of a single scenario is presented. Table 2 shows tuning parameters of PSSs are obtained it is considering the analysis in scenario high demand, in which it is observed that using the PSSs the modal analysis all oscillation modes are adequately damped.
Figure 10. MVMO optimizer convergence
In Figure 11 present the dynamic behavior active power of generator A1aG is presented in a high demand scenario it compares with the behavior of each centroid in every cluster. We remembered that in every cluster considers equal parameterization of activating PSS. The dynamics of the power system given three-phase short circuit in the transmission line, with this contingency allows exciting the oscillatory mode of interest is observe its behavior in the time domain a three-phase fault in the line that interconnects the areas BC applied in t=0 seconds and it clear in 1 cycle, that is at t=0.1 seconds.
Figure 11 shows that without PSS (green line) power system is unstable. However, activates and adequately tuning of PSS (red line) in scenario, it is possible damping the oscillatory modes. Applying to methodology proposed to scenario and considering three cluster it is obtained the centroid of each cluster. This dispatch it is observed that even if varying operational conditions and maintaining the same tuning of PSS. It could have seen more significant oscillations they could be appearing and shooting swings and power system requires in a long time for the damping of the oscillations (approx. 5 seconds), and it would happen the case in which the PSS cannot dampen the oscillations.
For operating conditions, D1, D2, and D3 show that although oscillations are dampened, there are cases in which additional oscillations occur before reaching a point of stability again.
Table 2. PSS tuning parameters – scenario high demand
|
Generator |
Kw |
Kp |
T1 |
T2 |
T3 |
T4 |
T5 |
T6 |
T7 |
T8 |
|
|
Dispatch – High Demand |
|||||||||||
|
C7G |
97.9 |
4.4 |
0.1124 |
0.0751 |
0.0427 |
0.0312 |
0.1111 |
0.1439 |
0.1071 |
0.1070 |
|
|
C2G |
99.3 |
34.0 |
0.1065 |
0.0721 |
0.1015 |
0.1516 |
0.0800 |
0.1192 |
0.0826 |
0.0467 |
|
|
C12G |
68.4 |
28.2 |
0.0776 |
0.0711 |
0.1083 |
0.0968 |
0.0619 |
0.0779 |
0.0552 |
0.0587 |
|
|
C10G |
92.3 |
4.5 |
0.1484 |
0.1001 |
0.1399 |
0.4739 |
0.0699 |
0.1002 |
0.1929 |
0.1284 |
|
|
A2bG |
84.8 |
7.1 |
0.1168 |
0.0855 |
0.1248 |
0.0886 |
0.0604 |
0.0873 |
0.2086 |
0.0288 |
|
|
A2aG |
84.8 |
7.1 |
0.1168 |
0.0855 |
0.1248 |
0.0886 |
0.0604 |
0.0873 |
0.2086 |
0.0288 |
|
|
A1bG |
95.1 |
8.3 |
0.0762 |
0.0908 |
0.0128 |
0.0100 |
0.0107 |
0.0122 |
0.2317 |
0.1338 |
|
|
A1aG |
95.1 |
8.3 |
0.0762 |
0.0908 |
0.0128 |
0.0100 |
0.0107 |
0.0122 |
0.2317 |
0.1338 |
|
Figure 11. Tuning PSSs in one scenario. Dynamic response generator A1aG by high demand
Due to the indicated stability conditions and in order to improve it. Through, proposed methodology in order to consider an operation more adjusted to reality for tuning PSS in each representative dispatch is applied and with this, operator of the system can have a bank parameter by tuning PSSs and with mechanism adequate it is possible to switch to them (e.g., communication techniques in PMUs) topic that are not analyzed in this studies.
In Table 3 shows the tuning parameters of PSS by the multiescenario of each representative operation scenario (centroid). While Figure 12, it is possible to observed the dynamic response of a system, for N-1 contingencies (line or generator) as well as the variation of the load. So, the system has the fastest stability is achieved whit time for the damping of the oscillations (approx. 3.5 seconds), despite the contingencies in these scenarios. And after the first oscillation, they present a smaller amplitude 3% minus than the one presented in the case of a one scenario.
Table 3. PSS Tuning Parameters – Multiescenario each dispatch of centroide of cluster
|
Generator |
Kw |
Kp |
T1 |
T2 |
T3 |
T4 |
T5 |
T6 |
T7 |
T8 |
|
Dispatch D1 – Demand Modification – Case 1 |
||||||||||
|
C7G |
95.5 |
38.9 |
0.0293 |
0.0283 |
0.0822 |
0.0714 |
0.5472 |
0.1030 |
0.0672 |
0.0884 |
|
C2G |
92.1 |
27.7 |
0.0718 |
0.0579 |
0.0605 |
0.0405 |
0.5053 |
0.1170 |
0.0313 |
0.0470 |
|
C12G |
42.3 |
44.8 |
0.1325 |
0.1519 |
0.1422 |
0.7684 |
0.0582 |
0.0745 |
0.1190 |
0.1127 |
|
C10G |
59.5 |
47.3 |
0.0825 |
0.0976 |
0.1127 |
0.5448 |
0.0847 |
0.1133 |
0.0677 |
0.0774 |
|
B3G |
33.5 |
28.5 |
0.1371 |
0.1118 |
0.1499 |
0.1357 |
0.1958 |
0.0274 |
0.1073 |
0.1483 |
|
B10G |
33.6 |
19.1 |
0.1259 |
0.0871 |
0.0469 |
0.0351 |
0.2059 |
0.0560 |
0.1485 |
0.1327 |
|
A2aG |
98.4 |
27.6 |
0.1421 |
0.1709 |
0.0952 |
0.0691 |
0.4172 |
0.1498 |
0.0663 |
0.0905 |
|
A1bG |
13.7 |
26.3 |
0.1292 |
0.1252 |
0.0415 |
0.0279 |
0.1778 |
0.1093 |
0.2127 |
0.1490 |
|
A1aG |
13.7 |
26.3 |
0.1292 |
0.1252 |
0.0415 |
0.0279 |
0.1778 |
0.1093 |
0.2127 |
0.1490 |
|
Dispatch D2 – N-1 Contingency Line – Case 2 |
||||||||||
|
C7G |
29.9 |
31.6 |
0.1063 |
0.0851 |
0.1125 |
0.2065 |
0.0893 |
0.1295 |
0.3240 |
0.0977 |
|
C2G |
91.5 |
41.9 |
0.0340 |
0.0365 |
0.1244 |
0.1083 |
0.0986 |
0.1396 |
0.1163 |
0.0924 |
|
C12G |
55.7 |
37.9 |
0.0382 |
0.0289 |
0.1425 |
0.1108 |
0.0838 |
0.1215 |
0.5074 |
0.1034 |
|
C10G |
54.9 |
12.4 |
0.1027 |
0.0719 |
0.0944 |
0.4324 |
0.0760 |
0.0987 |
0.0603 |
0.0687 |
|
B3G |
98.3 |
34.1 |
0.1232 |
0.1037 |
0.0629 |
0.0486 |
0.1076 |
0.0946 |
0.1671 |
0.0750 |
|
B10G |
94.4 |
21.6 |
0.1350 |
0.0942 |
0.1445 |
0.0980 |
0.0781 |
0.0968 |
0.1660 |
0.1474 |
|
A2aG |
98.4 |
27.6 |
0.1421 |
0.1709 |
0.0952 |
0.0691 |
0.4172 |
0.1498 |
0.0663 |
0.0905 |
|
A1bG |
96.3 |
33.0 |
0.1459 |
0.1348 |
0.1104 |
0.0861 |
0.6976 |
0.1272 |
0.0800 |
0.0917 |
|
A1aG |
96.3 |
33.0 |
0.1459 |
0.1348 |
0.1104 |
0.0861 |
0.6976 |
0.1272 |
0.0800 |
0.0917 |
|
Dispatch D3 – N-1 Contingency Generator – Case 3 |
||||||||||
|
C7G |
98.5 |
45.8 |
0.0189 |
0.0191 |
0.1487 |
0.1065 |
0.4148 |
0.1095 |
0.4695 |
0.1379 |
|
C2G |
71.7 |
38.2 |
0.1461 |
0.0981 |
0.1426 |
0.1112 |
0.1127 |
0.1150 |
1.0685 |
0.1368 |
|
C12G |
66.4 |
48.8 |
0.1137 |
0.6916 |
0.1253 |
0.0857 |
0.0833 |
0.1131 |
0.0790 |
0.1045 |
|
C10G |
88.8 |
1.7 |
0.1148 |
0.0789 |
0.1344 |
0.1919 |
0.0634 |
0.0949 |
0.4216 |
0.1293 |
|
B3G |
96.4 |
6.2 |
0.0486 |
0.0488 |
0.1002 |
0.1363 |
0.2854 |
0.1348 |
0.1329 |
0.1362 |
|
B10G |
99.7 |
15.4 |
0.1462 |
0.4219 |
0.0118 |
0.0086 |
0.0549 |
0.0715 |
0.1158 |
0.1119 |
|
A2aG |
98.4 |
27.6 |
0.1421 |
0.1709 |
0.0952 |
0.0691 |
0.4172 |
0.1498 |
0.0663 |
0.0905 |
|
A1bG |
26.0 |
17.2 |
0.1347 |
0.1054 |
0.0561 |
0.0374 |
0.0288 |
0.0193 |
0.1566 |
0.1260 |
|
A1aG |
26.0 |
17.2 |
0.1347 |
0.1054 |
0.0561 |
0.0374 |
0.0288 |
0.0193 |
0.1566 |
0.1260 |
Figure 12. Tuning PSSs in multiescenario. Dynamic response generator A1aG by high demand
By using the proposed method based on a probabilistic approach to the analysis of small-signal stability, it is possible to create a tuning bank of the PSS parameters through which it is possible to improve the SSS of the system considering uncertainties of the operating variables of the electric power system. Our study has identified the following.
The proposed method allows us to include more broadly the effect of different uncertainties present in the operation of the system.
Through the inclusion of several operational scenarios and the analysis of cases through the analysis of the uncertainty of the variables, it has allowed structuring a more robust methodology that guarantees the activation of the necessary PSSs and deactivating the unnecessary ones that could eventually cause unwanted dynamic interactions.
The inclusion of additional variables for the tuning of the PSSs, such as damping and frequency of the oscillation modes of interest of the low-frequency oscillations in conjunction with the status variables of the operation of the electric power system, has allowed increasing the vision on stability improving the positive effect of PSSs.
|
AVR |
Automatic voltage regulator |
|
A |
The n by n state matrix. |
|
B |
The n by r input matrix. |
|
C |
Correlation matrix |
|
D |
Operation scenario representative (centroid) |
|
DSL |
Digital Simulation Language |
|
EV |
Variability explained |
|
f |
Frequency of mode swing |
|
g |
Function the differential equations |
|
HVDC |
High-voltage, direct current |
|
h |
Function the algebraic equations |
|
H |
Constant of inertia of generator |
|
α |
Response of PSS |
|
λ |
Eigenvalues. |
|
σ |
Real part of eigenvalues. |
|
γ |
Imaginary part eigenvalues |
|
ξ |
Damping of mode of oscillation. |
|
Δ |
Small deviations from the equilibrium point |
|
θ |
Angle voltage of load bus |
|
KP |
Gain of PSS |
|
Kw |
Gain of PSS |
|
MC |
Method of Monte Carlo |
|
MVMO |
Mean-variance mapping optimization |
|
OM |
Oscillatory modes |
|
P |
Active Power of load bus |
|
PCA |
Analysis of principal components |
|
PC |
Principal components |
|
PSS |
Power System Stabilizer |
|
PMU |
Phasor measurement unit |
|
PSSS |
Probabilistic Small Signal Stability |
|
POD |
Power Oscillation Damping |
|
|
Probability distribution function |
|
Q |
Reactive Power of load bus |
|
s |
Limit variable of PSS |
|
SSS |
Small Signal Stability |
|
SVC |
Static var compensator |
|
Pe |
Electric power |
|
Pm |
Mechanical power |
|
T1 to T8 |
Time constant of led-lag filter [s]. |
|
Tw, Tw1 |
Time constant of washout filter [s]. |
|
u |
The input vector of dimension r input. |
|
V |
Voltage of load bus |
|
ω |
Rotor speed |
|
X |
Operation matrix |
|
x |
The state vector of dimension n state. |
|
y |
The output vector of dimension m output. |
|
WAMS |
Wide Area Measurement System |
[1] Messina, A.R. (2015). Wide-Area Monitoring of Interconnected Power Systems. 1st ed, IET Power and Energy Series. https://doi.org/10.1049/PBPO077E
[2] Zhou, J.S., Ke, D.P., Chung, C.Y., Sun, Y.Z. (2018). A computationally efficient method to design probabilistically robust wide-area PSSs for damping interarea oscillations in wind-integrated power systems. IEEE Transactions on Power Systems, 33(5): 5692-5703. https://doi.org/10.1109/TPWRS.2018.2815534
[3] Preece, R., Milanović, J.V. (2014). Tuning of a damping controller for multi-terminal VSC-HVDC grids using the probabilistic collocation method. IEEE Transactions on Power Delivery Special Issue on ‘HVDC Systems and Technologies’, 29(1): 318-326. https://doi.org/10.1109/TPWRD.2013.2258945
[4] Wang, Z., Chung, C., Wong, K., Tse, C. (2008). Robust power system stabilizer design under multi-operating conditions using differential evolution. IET Generation, Transmission & Distribution, 2(5): 690-700. https://doi.org/10.1049/iet-gtd:20070449
[5] Bian, X.Y., Geng, Y., Lo, K., Fu, Y., Zhou, Q.B. (2016). Coordination of PSSs and SVC damping controller to improve probabilistic small-signal stability of power system with wind farm integration. IEEE Transactions on Power Systems, 31(3): 2371-2382. https://doi.org/10.1109/TPWRS.2015.2458980
[6] Zhang, X.R., Lu, C., Xie, X.R., Dong, Z.Y. (2016). Stability analysis and controller design of a wide-area time-delay system based on the expectation model method. IEEE Transactions on Smart Grid, 7(1): 520-529. https://doi.org/10.1109/TSG.2015.2483563
[7] Bu, S.Q., Du, W., Wang, H.F. (2015). Investigation on probabilistic small-signal stability of power systems as affected by offshore wind generation. Power Systems, IEEE Transactions on Power Systems, 30(5): 2479-2486. https://doi.org/10.1109/TPWRS.2014.2367019
[8] Huang, H.Z., Chung, C.Y., Chan, K.C., Chen, H.Y. (2013). Quasi-Monte Carlo based probabilistic small signal stability analysis for power systems with plug-in electric vehicle and wind power integration. IEEE Transactions on Power Systems, 28(3): 3335-3343. https://doi.org/10.1109/TPWRS.2013.2254505
[9] Rueda, J.L., Colome, D.G. (2009). Probabilistic performance indexes for small signal stability enhancement in weak wind-hydro-thermal power systems. IET Generation, Transmission & Distribution, 3(8): 733-747. https://doi.org/10.1049/iet-gtd.2008.0574
[10] Rueda, J.L., Colome, D.G., Erlich, I. (2009). Assessment and enhancement of small signal stability considering uncertainties. IEEE Transactions on Power Systems, 24: 198-207. https://doi.org/10.1109/TPWRS.2008.2009428
[11] Gurung, S., Jurado, F., Naetiladdanon, S., Sangswang, A. (2019). Optimized tuning of power oscillation damping controllers using probabilistic approach to enhance small-signal stability considering stochastic time delay. Springer Nature Electrical Engineering, 101: 969-982. https://doi.org/10.1007/s00202-019-00833-6
[12] Ordoñez, C.A., Ríos, M.A. (2013). Electromechanical modes identification based on sliding-window data from a wide-area monitoring system. Journal Electric Power Components and Systems, 41(13): 1264-1279. https://doi.org/10.1080/15325008.2013.816982
[13] Cubillo, R. (2017). Determinación de modos oscilatorios presentes en el sistema eléctrico ecuatoriano mediante técnicas estadísticas. Revista Energía, (13): 139-145.
[14] Dussaud, F. (2015). An application of modal analysis in electric power systems to study inter-area oscillations. Degree Project, KTH Royal Institute of Technology School of Electrical Engineering., Sweden.
[15] Kundur, P. (1994). Power System Stability and Control. Vol. 7, ed. by Balu, N.J., Lauby, M.G., McGraw-hill, New York.
[16] Xu, J., Kanyingi, P.K., Wang, K.Y., Li, G.J., Han, B., Jiang, X.C. (2017). Probabilistic small signal stability analysis with large scale integration of wind power considering dependence. Renewable and Sustainable Energy Reviews, 69: 1258-1270. https://doi.org/10.1016/j.rser.2016.12.041
[17] Qi, B.Y. (2019). Identification of influential parameters affecting power system voltage and angular stability analysis. Ph.D. Thesis, Faculty of Science and Engineering, University of Manchester, UK.
[18] Verdejo, H., Vargas, L., Kliemann, W. (2011). Fine tuning of PSS control parameters under sustained random perturbations. IEEE Latin America Transactions, 9(7): 1051-1059. https://doi.org/10.1109/TLA.2011.6129702
[19] Haugdal, H., Uhlen, K. (2019). Mode shape estimation using complex principal component analysis and k-means clustering. IEEE Conference on Smart Grid Synchronized Measurements and Analytics, College Station, TX, USA, pp. 1-8. https://doi.org/10.1109/SGSMA.2019.8784556
[20] Cepeda, J. (2013). Evaluación de la vulnerabilidad del sistema eléctrico de potencia en tiempo real usando tecnología de medición sincrofasorial. Ph.D. Thesis, Facultad de Ingeniería de la Universidad Nacional de San Juan, San Juan Argentina.
[21] James, G., Witten, D., Hastie, T., Tibshirani, R. (2013). An Introduction to Statistical Learning. Vol. 103 of Springer Texts in Statistics. Springer New York.
[22] Lee, W.M. (2019). Python Machine Learning. John Wiley & Sons, Inc.
[23] H. Flores, J. Cepeda and C. Gallardo, (2017). Optimum location and tuning of PSS devices considering multi-machine criteria and a heuristic optimization algorithm. IEEE-ISGT Latin America, pp. 1-6. https://doi.org/10.1109/ISGT-LA.2017.8126712
[24] Cepeda, J.C., Rueda, J.L., Erlich, I., Korai, A.W., Gonzalez-Longat, F.M. (2014). Mean-variance mapping optimization algorithm for power system applications in DIgSILENT PowerFactory. In: Gonzalez-Longatt F., Luis Rueda J. (eds) PowerFactory Applications for Power System Analysis, 267-295. https://doi.org/10.1007/978-3-319-12958-7_12
[25] Mondal, D., Chakrabarti, A., Sengupta, A. (2020). Power System Small Signal Stability Analysis and Control. Vol. 1, 2nd ed., Academic Press, London. https://doi.org/10.1016/C2018-0-02439-1