Damis Hardiantono* | Paulus Mangera
OPEN ACCESS
This study aimed to: examine the total power loss of the primary distribution system and the impact of the capacitor bank and express feeder allocation to corrective voltage level on the primary distribution system. Therefore, a case study was taken in the primary distribution of the PLTD (diesel generation) Kelapa Lima Merauke then using Electrical Transient and Analysis Program (ETAP) simulation models to make power flow analyzing. The datas needed is one-line diagram, nominal voltage, generator rating, bus, transformer and transmission / distribution. The results obtained are normal loading power losses of 0.014 MW, voltage level for Feeder of Kota Satu was still stable because in cover range of voltage drop ± 5 %. The other side, corrective voltage level for Feeder of Merkuri from 17.65 kV to 17.75 kV after capasitor bank in amount of 134 kVAr allocated, drop voltage decreased from 13.31 % to 11.25 %, but it still unstable because out of cover range of voltage drop. For that, after using express feeder can be correct voltage level for feeder of Merkuri from 17.65 kV to 19.39 kV or drop voltage decreased from 13.31 % to 3.05 %. Therefore, using express feeder on Merkuri feeder better than capacitor bank allocation.
power loss, power flow, ETAP, drop voltage, power flow
The existing electric power system is expected to be a reliable and high-quality system related to the supply of electrical energy. To determine the technical condition of the electrical system, it is necessary to analyze the electrical power system components which include the generator, transmission line, and load installed [1]. Power flow calculation method is a method that can be used in power system analysis to determine the magnitude of the parameter values in each system bus which includes voltage, power, current, and magnitude of the phase angle [2]. One method used in completing power flow calculations is the Newton – Raphson method [3]. Manually analyzing the power flow for an electric power system is very complicated, therefore calculations should be carried out using a computer program [4]. Network analysis, namely: short circuit, arc flash, load flow and motors acceleration can be calculated by ETAP, then layout of ETAP workspace shown in Figure 1.
ETAP (Electrical Transient and Analysis Program) is one of the computer programs used to calculate power flow studies in electric power systems. The ETAP program can be used for large power systems and requires very complex calculations. This device is able to work offline for electric power simulations, online for real-time data management or used to control the system in real-time. ETAP can be used to create a power system project in single line diagram models [5]. Network analysis, namely: short circuit, arc flash, load flow and motors acceleration can be calculated by ETAP, then layout of ETAP workspace shown in Figure 1.
Generally, in the distribution system there are several feeders which then form a network configuration, such as: radial, spindle, grid and loop shape. In a certain area besides the main feeder there is also an express feeder. Some feeders cover area close to substation and express feeder serve areas farther from substation [6]. Commonly, primary distribution system in Indonesia has voltage levels are between 20 and 30 kV then secondary distribution system are between 220 V and 380 V [7]. It is influenced by the distance between area of the substation and the load served, causing an increase in voltage drop at the ends of the feeder [8]. Alternative actions used to overcome the voltage drop can be; placement of capacitor banks [9] or by adding an express feeder to the main feeder.
2.1 Retrieve data and layout of primary distribution feeder
The data needed includes all components of the electrical equipment installed in the distribution system along with data on all feeder installed starting from the power station to the consumer / load, such as [10]: generator data, electrical transformer data, electrical bus data, cable data, and electrical load data. For more details can be seen on Figure 2.
2.2 Using electrical transient and analysis program (ETAP)
ETAP Power Station makes it possible to work directly with single line diagram of distribution system. The advantage of using ETAP is ETAP can accurately describe the real condition in the field so that it can anticipate changes in load characteristics at any time. In addition, with a simple graphical interface, ETAP is easy to operate and with a short time can get the analysis results needed. Network analysis, namely: short circuit, arc flash, load flow and motors acceleration can be calculated by ETAP .
2.3 Power flow analysis of distribution system by using simulation of ETAP
Simulation is an approaching process of something real along with the state of affairs [12]. Power flow simulation [13] is carried out on two conditions, namely: the existing condition of the distribution system and the conditions after the addition of express feeder [14] and capacitor bank [15]. The main electricity indicator that is considered for both conditions is voltage level. Besides this, it will also be known the magnitude of the active and reactive power flow along the primary distribution system [16].
Figure 1. Workspace of ETAP
(a) Generator data
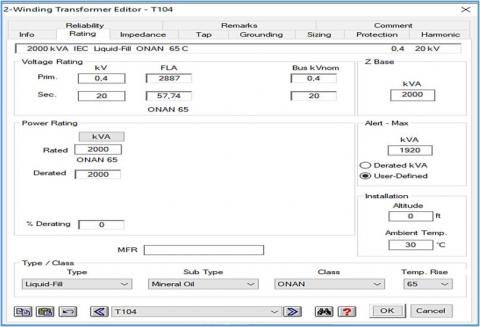
(b) Electrical transformer data
(c) Electrical bus data
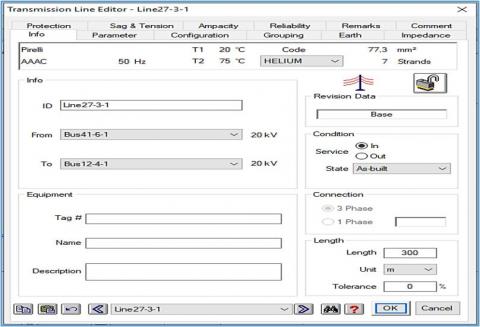
(d) Cable data
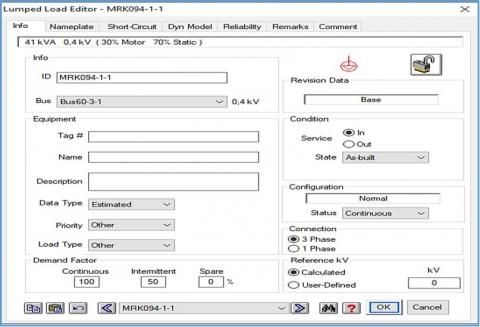
(e) Electrical load data
Figure 2. Lay out data for simulation using ETAP
2.4 Case study
The case study taken in this research is the Diesel Power Plant located in the Kelapa Lima of District Merauke as part of the National Electricity Company / PT. PLN (Persero). Electric power provided by PT. PLN (Persero) Merauke area to meet the electricity needs in the city of Merauke is served by 39 (thirty nine) generator units through 6 (six) feeders, namely; feeder Kota 1, feeder Kota 2, feeder polder, feeder muli, feeder kompi 1, feeder kompi 2 and feeder Merkury [17]. These generators comes from generator owned by PLN / PLTD as well as a rental generator among its 5 (five) units owned by PT. Sewatama, 6 (six) units owned by PT. Daya Manunggal Diesel I (DMD I), 18 (eighteen) units owned by PT. Daya Manunggal Diesel II (DMD II), 5 (five) units owned by PT. Taneko, 2 (two) units owned by the Regional Government and 3 (three) units owned by PLN / PLTD [8]. Case study in this research, shown in Figure 3.
Figure 3. Single line diagram of PLTD (diesel generation) Kelapa Lima Merauke
There are several operation voltages level, which are 0.4 kV and 6.3 kV. Where the voltage of 0.4 kV and 6.3 kV is the output voltage of the generator which is then raised through a step up transformer to a voltage of 20 kV as a distribution voltage which is then lowered to voltage 380/220 by distribution transformers to transmitted or used by consumers [18].
Simulation performances using ETAP of electrical distribution system at PLTD (diesel generation) Kelapa Lima Merauke, depend on [19]:
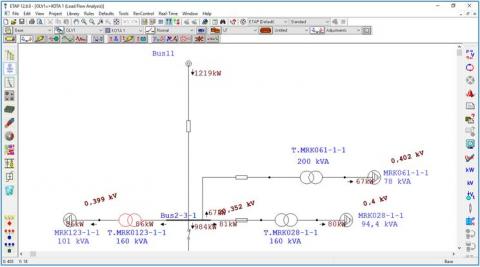
The results of power flow analysis under normal conditions beyond the peak load time at 22.00 WIT - 18.00 WIT is when the load is 0.97 MW and all existing plants operate. The results of the voltage level from the analysis of the PLTD Kelapa Lima using ETAP when the system is normal are found in Table 1. Results of each bus on the power flow analysis in the distribution system in feeders Kota 1 obtained are stable because they are still in the range of ± 5 %, as shown on Table 1. And the operating limits of the voltage level generation at 0.4 kV are 0.002 kV. Then the reduction in the allowed voltage is 5 % with a value of 0.38 kV and a voltage increase of 5 % with a value of 0.402 kV. Active power and reactive power generated are 0.921 MW and 0.725 MVAr, respectively. The results of the calculation of the total active load and reactive load are 0.907 MW and 0.680 MVAr and the total line power loss of 0.014 MW and 0.045 MVAr was obtained. The results above, according to the simulation as shown in Figure 4.
Table 1. Voltage level in normal operation at feeder Kota 1
|
No. |
Bus Number |
Voltage Level |
System Condition |
|
|
Nominal |
Operation |
|||
|
1 |
Bus 37 |
0.4 |
0.39 |
Stable |
|
2 |
Bus 39 |
0.4 |
0.39 |
Stable |
|
3 |
Bus 42 |
0.4 |
0.39 |
Stable |
|
4 |
Bus 44 |
0.4 |
0.39 |
Stable |
|
5 |
Bus 47 |
0.4 |
0.38 |
Stable |
|
6 |
Bus 49 |
0.4 |
0.39 |
Stable |
|
7 |
Bus 52 |
0.4 |
0.39 |
Stable |
|
8 |
Bus 56 |
0.4 |
0.39 |
Stable |
|
9 |
Bus 58 |
0.4 |
0.39 |
Stable |
|
10 |
Bus 61 |
0.4 |
0.39 |
Stable |
|
11 |
Bus 64 |
0.4 |
0.39 |
Stable |
|
12 |
Bus 66 |
0.4 |
0.39 |
Stable |
|
13 |
Bus 70 |
0.4 |
0.39 |
Stable |
|
14 |
Bus 72 |
0.4 |
0.39 |
Stable |
|
15 |
Bus 74 |
0.4 |
0.39 |
Stable |
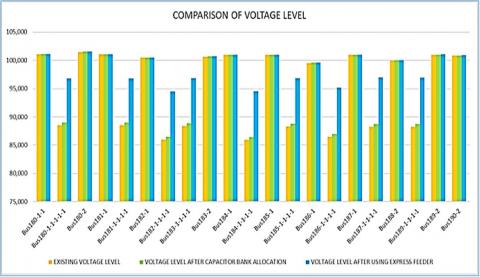
The voltage level based on power flow analysis simulation of feeder merkury before using ekspress feeder or capacitor bank are 17,65 kV. It means drop voltage was 13,31 % out of cover range ± 5 % or it can be categorized as a condition that the mercury feeder is unstable. After capacitor bank allocated of 134 kVAr allocated, drop voltage decreased from 13,31 % (17,65 kV) to 11,25 % 17,75 kV), but it still unstable because out of cover range of voltage drop. At last, using ekpress feeder at feeder merkury obtained voltage level was 19,39 kV or drop voltage decreased from 13,31 % to 3,05 % and that case feeder merkury in stable condition. Comparison voltage level corrective using ekspress feeder and capacitor bank, shown on Figure 5.
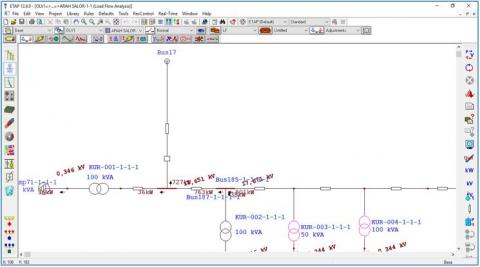
(a) The result of simulation of feeder Kota 1
(b) The result of simulation of feeder Merkury
Figure 4. Lay out of ETAP simulation
Figure 5. Comparison of voltage level using express feeder and capacitor bank allocation
Based on the research and the results of the simulation using ETAP 12.0, the following conclusions are obtained:
I would like to say thanks to everybody who provides support, therefore the research could be finished. Special thanks for the facilities provided by Dean of faculty of engineering and Rector of Universitas Musamus, Merauke - Indonesia.
[1] Schlabbach, J., Rofalski, K.H. (2008). Power system engineering: Planning, design, and operation of power systems and equipment. WILEY-VCH Verlag GmbH & Co KGaA. https://doi.org/10.1002/9783527622795.ch9
[2] Hardiantono, D. (2012). Perencanaan penempatan FACTS optimal menggunakan algoritma genetika. Jurnal Mustek Anim Ha, 1(2): 111–117. https://doi.org/10.5281/zenodo.3516276
[3] Saadat, H. (1999). Power System Analysis. Boston: WCB/McGraw-Hill Companies Inc.
[4] Stagg, G.W., El-Abiad, A.H. (1994). Computer Methods in Power System Analysis. Tokyo: McGraw-Hill Kogakusha, Ltd.
[5] Faisal, M.F., Yacoub, R.R., Purwoharjono, Imansyah, F. (2019). Modeling and simulation of samrt grid system for urban electricity distribution network. The International Journal of Engineering and Science (The IJES), 8(3): 30-38.
[6] Short, T.A. (2014). Electric Power Distribution-Handbook. New York: CRC Press LLC. https://doi.org/10.1201/b16747
[7] Tobing, B.P.L. (2013). Distributed generation on electricity system in Indonesia. The APERC Annual Conference.
[8] Rao, K.K.S.V.V.P., Reddy, V.C.V. (2017). A review on distribution feeder reconfiguration methods. International Journal of Advance Research, Ideas and Innovation in Technology, 3(2): 192-195.
[9] Kumar, S.A., Narayana, M.S.S., Naidu, B.A., Reddy, G.V.S. (2019). Optimal power flow for IEEE-9 bus system using ETAP. International Journal of Recent Technology and Engineering (IJRTE), 7(6): 368-370.
[10] Zhu, J. (2009). Optimization of power system operation. New Jersey: John Wiley & Sons, Inc. https://doi.org/10.1002/9780470466971.ch1
[11] Baby, K., Sreekumar, K.L. (2017). Load flow analysis of 66 kV substation using ETAP software. International Research Journal of Engineering and Technology (IRJET), 4(2): 770-773.
[12] Parenden, D. (2019). Simulation of photovoltaic concentration with fresnel lens using simulink Matlab. European Journal of Electrical Engineering (EJEE), 21(2): 223-227. https://doi.org/10.18280/ejee.210214
[13] Lal, N.K., Mubeen, S.E. (2014). A review on load flow analysis. International Journal of Innovative Research and Development (IJIRD), 3(11): 336-341.
[14] Olufisayo, A.O., Okakwu, I.K., Ositola, O.M., Elijah, O.O. (2018). Investigation of electric power losses on primary distribution feeder: A case study of sango - ota distribution company, Ogun State, Nigeria. International Journal of Applied Engineering Research (IJAER), 13(7): 5000-5003.
[15] Goel, N., Ramawat, R., Jaiswal, S.P. (2017). Idea of reactive power compensation in distribution feeders with optimal capacitor location: Survey. International Journal on Cybernetics and Informatics (IJCI), 6(2): 83-96. https://doi.org/10.5121/ijci.2017.6211
[16] Murali, D., Rajaram, M. (2010). Active and reactive power flow control using FACTS devices. International Journal of Computer Applications (IJCA), 9(8): 45-50. https://doi.org/10.5120/1403-1892
[17] Mangera, P., Hardiantono, D. (2019). Analisis rugi tegangan jaringan distribusi 20 kV pada PT. PLN (Persero) Cabang Merauke. Musamus of Journal Electro and Machine Engineering (MJEME), 1(2): 61-69. https://doi.org/10.5281/zenodo.3516283
[18] Win, S.H., Swe, P.L. (2015). Loss minimization of power distribution network using different types of distributed generation unit. International Journal of Electrical and Computer Engineering, 5(5): 918-928.
[19] Dharamjit, Tanti, D.K. (2012). Load flow analysis on IEEE 30 bus system. International Journal of Scientific and Research Publications (IJSRP), 2(11): 1-6.