Daniel Parenden*| Hariyanto
OPEN ACCESS
The development of experiments to convert solar energy into electrical energy in photovoltaic (PV) has been widely carried out. Simulation is one approach that is used to find out the initial data before conducting an experiment with the aim of minimizing errors, saving design efficiency, time and budget. Simulation is made by modeling mathematical equations to analyze the performance of PV modules. The equation model is made into a block diagram, then simulated by the input-output function in Simulink Matlab. PV used is a type of amorphous silicon (a-Si). The Sun spectrum is the AM1.5 G standard which is concentrated using Fresnel lenses at wavelengths of 400-700 nm. Photovoltaic parameters include intensity, temperature, construction and materials taken from module specification data. Calculation analysis of PV modules produces a maximum total power of 0.057 W with efficiency reaching 6.68 %.
photovoltaic, solar irradiation, spectrum light, Fresnle lens, output daya, efisiensi
Solar energy is one of the most abundant renewable energy sources. The utilization of solar energy continues to be developed to meet future energy needs. The heat and light produced can be used for daily living needs. Photovoltaic (PV) is an energy conversion device that can convert solar energy into electrical energy. In general, PV cells can absorb up to 80 % of energy from solar radiation, but not all energy can be converted into electrical energy for use, some of it being waste heat which increases cell temperature and causes a decrease in efficiency [1]. Various methods have been applied to maintain module temperature and increase output power, including using cooling devices in the form of liquid and air fluids. Solar energy with a wavelength of 400-700 nm in the visible light area (Vis) has good photon energy to produce electrical energy. Photon energy also greatly affects the output power of PV cells [2]. Photon energy must be greater than or greater than the gap energy so that an excitation process occurs on the module device which causes current to flow and generate output power [3]. The use of several types of optical concentrators to focus the solar spectrum to PV modules has been done by shanks et al. (2016) [4] that Frensel lenses have better performance than other concentrators. Piarah et al. (2019) [5] has used Fresnel lenses as a halogen light spectrum concentrator to PV in Hybrid PV-TEG research on a laboratory scale. But in their research they did not explain how much degradation occurs when the spectral light passes through a Fresnel lens and its efficiency. Jordehi et al. has reviewed important parameters in evaluating, controlling and calculating output power and efficiency. Jordehi et al. (2016) [6] has reviewed important parameters in evaluating, controlling and calculating output power and efficiency. While mathematical modeling has been made to see the characteristics of PV by entering the required input parameters [7-8]. However, their modeling does not use a light concentrator. Therefore, in this paper the author conducts simulations and modeling of photovoltaic concentrators on Simulink Matlab. The radiation source used is the standard solar spectrum AM1.5 G (GSTM1730) with 1 Sun. The radiation that comes is focused by using Fresnel lenses at wavelengths of 400-700 nm. In the simulation, input data in the form of intensity, temperature and specifications of the device are modeled to produce output power and maximum efficiency of PV.
2.1 Simulation design
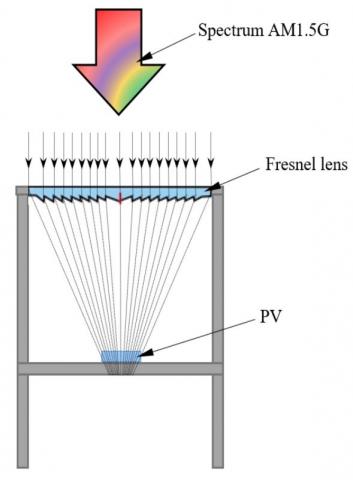
Figure 1. PV simulation design with Fresnel lens
Figure 1 shows the simulation design using the spectrum of the sun that came to be considered constant 1 Sun. The commercial device used is PV 50 x 50 mm amorphous silicon (a-Si) [9], 170 x 170 Fresnel lens [10] with a focal length of 152 mm and 1.5 mm thick. The light spectrum arriving at Fresnel lenses by 92 % will be transmitted to PV. The surface of the PV module is considered to absorb all the focused light by the Fresnel lens. The energy conversion process is ignored to facilitate modeling.
2.2 Solar spectrum
The spectrum AM1.5 Global (ASTMG173) is a spectrum designed for flat plate modules and has integrated power of 1000 W/m2 [11].
Figure 2. Solar spectrum AM1.5 Global measurement
Figure 2 is the data from the measurement of the solar spectrum at STC (Standard Test Condition) 1000 W/m2 and temperature 25 ⁰C. The visible light area at a wavelength of 400-700 nm is marked with a dashed line. The total power density emitted from the light source can be calculated by integrating spectral irradiation into all wavelengths and written in the equation [12]:
$H=\int_{400}^{700} F(\lambda) d \lambda$ (1)
where H is the total power density emitted from the light source in Wm-2, F(l) is spectral radiation in units of Wm-2μm-1 and dl is the wavelength with units of nm.
2.3 Single PV diode mathematical modelling
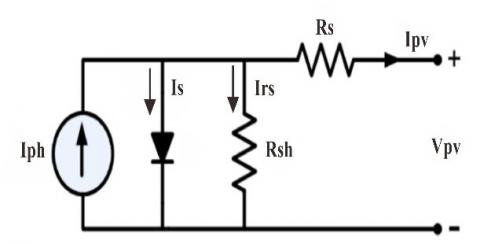
The ideal PV cell model is a circuit model that ignores the existence of obstacles in the device, so that the current flows only through the ideal diode as shown in Figure 3 the voltage current equation representing equivalent circuits according to Kirchoff's law is written in the equation [7]:
$I_{p v}=I_{p h}-I_{s}-I_{r s}$ (2)
Figure 3. PV circuit single diode
Iph is the current of the generated photon expressed by the equation:
$I_{p h}=\left[I_{s c}+K_{i}\left(T-T_{0}\right)\right]\left(\frac{G}{G_{0}}\right)$ (3)
Is is the diode current expressed by the equation:
$I_{s}=I_{r s}\left(\frac{T}{T_{0}}\right)^{3} \exp \left[\frac{q E_{g}}{A k}\left(\frac{1}{T_{0}}-\frac{1}{T}\right)\right]$ (4)
Irs is a resistance current expressed in equation:
$I_{r s}=I_{s c r}\left[\exp \left(\frac{q V_{o c}}{N_{s} k A T}\right)-1\right]$ (5)
Iscr is a standard short current current, Voc is an open circuit voltage, q is an electron charge (1.602 x 10⁻¹⁹ C), Ns is the number of series cells in a PV module, k is a Boltzman constant (1.38 x 10⁻²³ J), A is a factor ideal diode. While Eg is a band gap energy, so the derivative of equation (2) becomes:
$I_{p v}=N_{p} I_{p h}-N_{p} I_{s}\left[\exp \left(\frac{q V_{v p}+I_{p v} R_{s}}{N_{s} k A T}\right)-1\right]-\frac{V_{v p}+I_{p v} R_{s}}{R_{h}}$ (6)
Input power in the form of irradiation from light sources can be calculated with the following equation [8]:
$P_{in}=G A_{p v}$ (7)
Apv is the surface area of the PV module. To evaluate the quality of PV cells in the filling factor with equation:
$F F=\frac{I_{M P} V_{M P}}{I_{s c} V_{o c}}$ (8)
IMP is current at maximum power, VMP voltage at maximum power. While the maximum efficiency of PV is expressed by equation:
$\eta_{p v}=\frac{I_{M P} V_{M P}}{G A_{p v}}$ (9)
2.4 Single PV performance analysis on Simulink Matlab
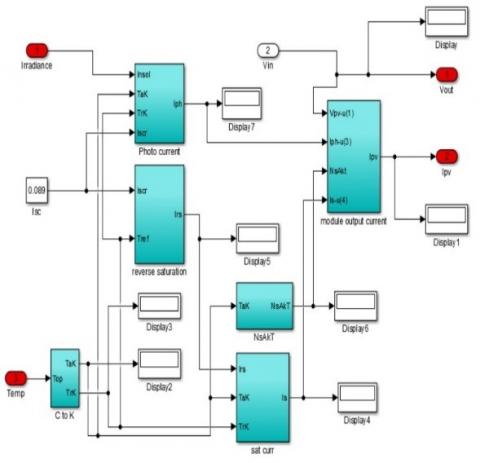
PV performance analysis begins by defining input parameters in the form of equations, then made into a block diagram on the Simulink Matlab. Figure 4 shows the making of the block diagram of equations (2)-(6).
Figure 4. Diagram blok of equation (2)-(6)
While for equation (1) the amount of power from the spectrum that has passed through the Fresnel lens and will be transmitted to the PV module, is calculated by the function trapz (integral trapezoid in Matlab). The spectrum calculation syntax is shown in Figure 5.
Figure 5. Diagram blok of equation (2)-(6)
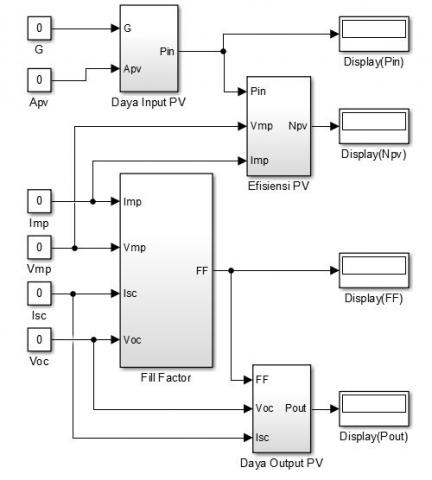
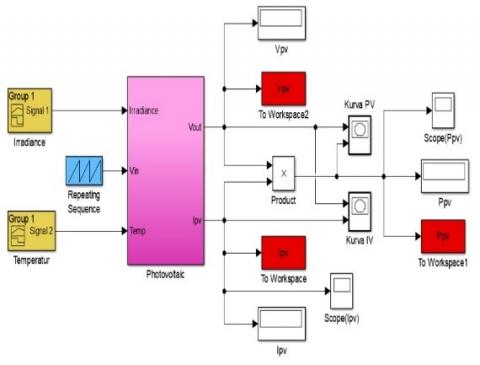
Figure 6 shows the results of making a block diagram of equations (7)-(9). While Figure 7 shows the simulink PV block diagram. The simulation input is in the form of Intensity, temperature and specification of data from Tables 1 and 2. The outputs are in the form of I-V and P-V curves which describe the current, voltage, and power.
Figure 6. Diagram blok of equation (7)-(9)
Figure 7. Diagram blok PV
Table 1. Photovoltaic specification data
|
Parameter |
Value |
|
Maksimum Power (P) |
0.136 W |
|
Maksimum Power voltage (VMP) |
1.85 V |
|
Maksimum Power current (IMP) |
0.073 A |
|
Open circuit voltage (VOC) |
2.4 V |
|
Short circuit current (ISC) |
0.089 A |
|
Dimensions (L*W*H) |
50*50*2 mm |
|
Material: Amorphous silicon (a-Si) Electrical specifications at standard test conditions; irradiance of 1000 W/m2, spectrum of 1.5 air mass and cell temperature of 25°C. |
|
|
Parameter |
Value |
|
Operation temperature maximum (⁰C) |
80 |
|
92 % Transmission from (nm) |
400-1100 |
|
Material |
acrylic |
|
Dimensions: L*F*P (mm) |
170*170*1.5 |
The results of PV simulation in Matlab based on equations (1)-(9) are presented in the form of PV images and characteristic curve. The power generated from the AM1.5G spectrum at a wavelength of 400-700 nm is 374.815 W/m2. While the power transmitted by the Fresnel lens to the PV module is 344.829 W/m2 and shown in Figure 8.
Figure 8. Solar spectrum AM1.5G at wavelength 400-700 nm
Figure 9. Curve I-V Modul PV
Figure 9 shows the simulation results on the I-V current and voltage curves. The power transmitted from the Fresnel lens to PV is used as input to the irradiation value (G) = 344,829 W/m2, resulting in a value of Isc = 0.030 A and Voc = 2.28 V.
Figure 10. Curve P-V Modul PV
Figure 10 shows the simulation results on the P-V curve in the PV module. The power value is obtained by multiplying the voltage and current values. While constant values include: Boltzman constant (k) = 1.38 x 10⁻²³, Electron charge (q) = 1.602 x 10⁻¹⁹, ideal factor diode (A) = 1, Energy gap (Eg) = 1.65, Temperature (T) = 25⁰C.
Figure 11. Curve P-V Modul PV
The characteristics of current and output power as a function of voltage in PV are shown in Figure 11. Initially a constant current and followed by an increase in output power until a certain voltage drops dramatically and is followed by a decrease in power. The peak value of current, voltage and power are written with a dashed line. In the condition of maximum power the value produced is IMP = 0.029 A, VMP = 1,986 V and PMP = 0.057 W. The input value of intensity greatly influences the current, voltage and output power. This result also shows the suitability of the simulation made by Zainal et al. (2016) [7] and Belkassmi et al. (2017).
Photovoltaic simulation using equation modeling into block diagram in Matlab Simulink produces PV values: irradiation input (G) = 344.829 W/m2, Isc = 0.030 A and Voc = 2.28 V. Total current, voltage and maximum power generated by IMP = 0.029 A, VMP = 1.986 V and PMP = 0.057 W with an efficiency of 6.68 %. The output power and efficiency of PV modules are greatly influenced by intensity and temperature. The choice of PV type and material needs to be considered because it affects the photon energy absorption factor. This modeling still needs to be developed experimentally to see the comparison and validation of simulation data.
|
PV |
photovoltaic |
|
I-V |
Current-Voltage |
|
P-V |
Power- Voltage |
|
Iph |
Photoncurrent (A) |
|
Is |
dioda current (A) |
|
Irs |
resistance current (A) |
|
Isc |
Short circuit current (A) |
|
Ipv |
outputcurrent PV module (A) |
|
IMAX |
maximum power current |
|
Vpv |
output voltage PV module (V) |
|
VMAX |
maximum power voltage (V) |
|
Voc |
voltage open circuit (V) |
|
Rs |
series resistance (Ω) |
|
Rsh |
shunt resistance (Ω) |
|
G |
irradiation (W/m2) |
|
Go |
standart irradiation (W/m2) |
|
q |
electron charge (1,602 x 10-19 C) |
|
k |
constanta Boltzman (1,38 x 10⁻²³J) |
|
T |
PV temperature (Kelvin) |
|
To |
standart Temperature (Kelvin) |
|
Ns |
number of series cells in the module |
|
Np |
number of parallel cells in the module |
|
Eg |
energy gap (1.65) |
|
A |
ideality factor = 1 |
|
APV |
Surface area PV modules (m2) |
[1] Makki, A., Omer, S., Su, Y., Sabir, H. (2016). Numerical investigation of heat pipe-based photovoltaic-thermoelectric generator (HP-PV/TEG) hybrid system. Energy Conversion Mangement, 112: 274-287. https://doi.org/10.1016/j.enconman.2015.12.069
[2] Razak, A., Irwan, Y., Leow, W.Z., Irwanto, M., Safwati, I., Zhafarina, M. (2016). Investigation of the effect temperature on photovoltaic (PV) panel output performance. International Journal Andvance Science Engineering Information Technology, 6(5): 682. http://dx.doi.org/10.18517/ijaseit.6.5.938
[3] Elsarrag, E., Pernau, H., Heuer, J., Roshan, N., Alhorr, Y., Bartholomé, K. (2015). Spectrum splitting for efficient utilization of solar radiation: A novel photovoltaic - thermoelectric power generation system. Renewables Wind Water and Solar, 2: 16. http://doi.org/10.1186/s40807-015-0016-y
[4] Shanks, K., Senthilarasu, S., Mallick, T.K. (2016). Optics for concentrating photovoltaics: Trends, limits and opportunities for materials and design. Renewable and Sustainable Energy Reviews, 60: 394-407. https://doi.org/10.1016/j.rser.2016.01.089
[5] Piarah, W.H., Djafar, Z, Syafaruddin, M. (2019). The characterization of a spectrum splitter of techspec AOI 50.0 mm square hot and cold mirrors using a halogen light for a photovoltaic-thermoelectric generator hybrid. Energies, 12(3): 353-365. https://doi.org/10.3390/en12030353
[6] Jordehi, A.R. (2016). Parameter estimation of solar photovoltaic (PV) cells: A review. Renewable and Sustainable Energy Reviews, 61: 354-371. https://doi.org/10.1016/j.rser.2016.03.049
[7] Zainal, N.A., Ajis, M., Yusoff AR. (2016). Modelling of photovoltaic module using matlab simulink. In: IOP Conference Series: Materials Science and Engineering, 114: 012137. http://doi.org/10.1088/1757899X/114/1/012137
[8] Belkassmi, Y., Rafiki, A., Gueraoui, K., Elmaimouni, L., Tata, O., Hassanain, N. (2017). Modeling and simulation of photovoltaic module based on one diode model using matlab/simulink. In: International Conference on Engineering & MIS (ICEMIS), 17543104. http://doi.org/10.1109/ICEMIS.2017.8272965
[9] Alibaba.com. Data Sheet of PV ASC 50500. https://www.alibaba.com/product-detail/1W-small-size-customizedamorphoussilicon_60159308905.html?spm=a2700.7724857.normalList.49.3a24696eEpoJ6S/, accessed on Nov. 11, 2018.
[10] Fresnel Technologies. Data sheet of Fresnel lenses. http://www.fresneltech.com/visible.html, accessed on Nov. 11, 2018.
[11] Honsber, C., Bowden, S. (2018). Standard Solar Spectra. https://www.pveducation.org/pvcdrom/appendices/standard-solar-spectra/, accessed on Nov. 11, 2003.
[12] Honsber, C., Bowden, S. (2018). Radiant Power Density. https://www.pveducation.org/pvcdrom/2-properties sunlight/radiant-power-density/, accessed on Nov. 11, 2016.