Aganze B. Gloire* | Masirika M. Lucien | Ganza B. Gloire | Nandezo W. Robert
© 2022 IIETA. This article is published by IIETA and is licensed under the CC BY 4.0 license (http://creativecommons.org/licenses/by/4.0/).
OPEN ACCESS
The purpose of this study is to investigate the Itombwe synclinorium formations that were affected by the late Pan-African orogenesis in the nordeastern Congo. A variety of controversies surround Tshondo and Bugoy's tectonic evolution and associated metasedimentary formations. A field-based approach combined with paleostress inversion techniques and petrographic analyses were conducted on 190 structural measurements and 6 rock samples used in this study. The results reveal the presence of four major petrographic facies: conglomeratic facies (conglomerate and diamictite), carbonate facies (travertine), greenschist facies (graphitic black shale and pelite), as well as quatzitic facies (quartzite and sandstone). The mineral assemblages consisting of high contents (>70%) of muscovite/sericite and biotite albite, plagioclase, quartz, and some opaque minerals. With the assistance of Win-Tensor software, the kinematic analysis reveals two major deformation phases, (1) a ductile deformation phase (D1-2), which is associated with isoclinal folds and strike-slip faults, and (2) a submeridian brittle deformation phase (D2), which generated extensive faults trending NNW-SSE to NE-SW directions, while reactivating bedding surfaces (NE-SW) in a series of secondary faults. The findings of this research may assist geologists in conducting core logging operations and provide a baseline for understanding the relationship between rock, minerlization, and tectonics in mineral-rich areas.
Pan-African orogeny, metasedimentary rocks, mineral paragenesis, deformation phases, paleostress, DRC
The Itombwe synclinorium, often referred to as the Neoproterozoic belt, is one of the geological units in Kivu region [1]. This elongated folded structure lies within the range of Lake Kivu between its northern shore and the nord-western shore of Lake Tanganyika [2]. In the upper Kibaran, it consists of two lithological units: lower and upper Kadubu, which are separated by faults [3, 4]. The rock formations outcropping in these two units have been mapped in differnt places, including Tshondo, Bugoy, Nya-Kaziba, Kigogo, Kalama, and Madubwe. Tshondo and Bugoy belong to the upper Kadubu unit, which contains rocks of varying sizes including sandstone, conglomerates, granites, gneisses and schists [5]. These conglomerates, reminiscent of glacial deposits, are called mixitites or diamicites [6, 7].
The Itombwe synclinorium, dated between 1020 ± 50 and 575 ± 83 Ma abounds with a plethora of mineralization, the most important of which is gold and some rare metals (Figure 2). They derivve from an albitite dyke (970 Ma) in the Kasika granite [8, 9].
Recent Pan-African tectonic events have severely strained this belt [3, 10]. However, other deformation phases are still debated today. Additionally, the growing interest in Tshondo and Bugoy's economic potential also calls for a more detailed petrographic study, which is a source to a wealth of information during core logging in mineral exploration.
The interpretations of kinematic indicators within a paraconglomerate by Walemba et al. [6, 8], revealed a jusxtaposition of two crustal blocks associated with E-W compressive stresses,as well as large-scale dextral/sinistral shearing but, the exact kinematic reationship between these faulting system at tshondo and bugoy is still unclear.
Similary, Lefevère [4] used remote sensing data and image interpretations to understand the deformation in the two areas inverstigated. He noted the presence of concemtric lineaments that he interpreted as resulting from 2 compression systems, associated with lithology such as shales, sandstones, quartizites and conglomerates. However, a detailed in-situ survey is always crucial to confirm what may at times not be captured remotely. In recent years, not much has been updated in terms of knowledge. Among the reasons are the difficulty of field access, active rugged terrains, and the risk of slope failure, among others.
Thus, the results highlighted in this paper provide an update and complete the general petrographic and structural knowledge available in the Neoproterozoic belt of South-Kivu, while shedding new light the stress regimes and petrographic types in these areas using modern techniques.
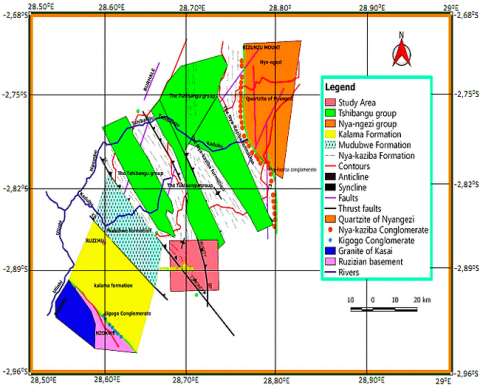
The study areas are located the eastern part of the Democratic Republic of the Congo and cover a total area of ca. 4 km2. They are respectively bounded by longitudes 28.60°E and 28.75°E and latitudes -2.86°S and -2.92°S (Figure 1).
Figure 1. Location of the study areas and geology of the Itombwe synclinorium with its associated lithological units (modified from Villeneuve 1987)
Figure 2. The origin of mineral deposits in the Itombwe Synclinorium [2]
Over the course of one month, the two areas were mapped. Outcrop profiles were described on a macroscale. For each sampling station, the geographical coordinates were recorded. Fresh rock samples were collected, packed, and labelled for ex-situ analyses. A "Breithaupt-Kassel" compass was used to map linear and planar structures in the field. To make the interpretation of the data easier, the orientations were recorded in Dip/Dip direction format, then converted to Strike/Dip format. Thin-section microscopy was performed on 6 rock samples at the Geological Museum of Bukavu and optical observations were conducted at the Official University of Bukavu's mineralogical laboratory in plane-polarized and crossed-polarized light. FIJI (ImageJ) point counting software was used to calculate the mineral content of samples.
Structural measurements were computed using paleo stress inversion techniques in Win-tensor software 5.9.3, developed by Delvaux and Sperner [11], of which two methods are recognized: the classical R-Dihedron methods and the modern iterative Rotational Optimization Method [12, 13].
3.1 Petrographic analysis
Rock samples were described macroscopically based on factors such as mineralogical composition, color, structure, weathering rate, and behavior after being exposed to hydrochloric acid. In contrast, microscopic descriptions of minerals were based on characteristics like color, pleochroism, habit, cleavage, relief, and twining [14].
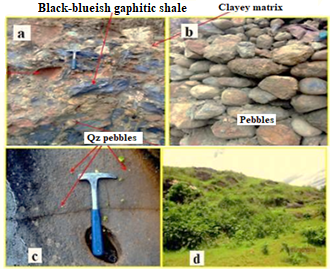
Figure 3. Conglomerate outcrop (a) and associated pebbles (b), used as retaining walls in the Rugenge mining quarry. Diamictite outcrop, also known as " paraconglomerate" (c). They are mostly found on the western slope of the Irongero River at Bugoy (d) and are believed to have been deposited during the latest Cryogenian glaciation (720-635 Ma)
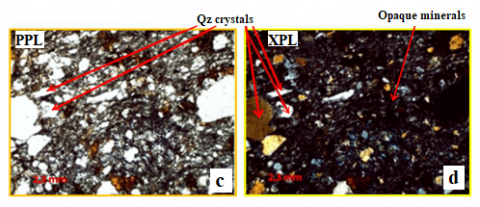
Figure 4. Microphotographs of conglomerate and diamictite: microscopic observations in plane polarized light (a, c) and crossed polarized light (b, d). Both rocks show large content in quartz crystals and opaque minerals
3.1.1 Rocks with conglomerate facies
Conglomerate and diamictite. Both sides of the Kadubu and Kashwa rivers are covered in Congolomerates. It consists of colorless mono-crystalline quartz grains (50-60%) along with medium relief chlorite (Figure 4a), which polarizes into yellowish gray and bluish green (Figure 4b) in a brown--reddish to yellowish ferruginous, clayey matrix Also present in the rock are fragments of polygenic and heterometric rocks consisting of black-blueish graphitic shales, rounded pebbles, sandstones, quartzites, and pelites measured in centimeters (Figure 3a), rounded pebbles, sandstones, quartzites, and pelites mostly in the order of centimeters (Figure 3b).
On the western slope of the Irongero River, a few miles north of Bugoy, diamictite outcrops were found (Figure 3c, d). A gray or black color characterizes them, and they are compact in nature. Quartz veins, granite, sandstone, gneiss, and quartzite clasts range in size from 1 to 15 cm long. They are strongly foliated in N-S directions and embedded in a chloritic clay matrix (Figure 4c, d).
3.1.2 Rocks with carbonate facies
Travertine. This rock was sampled from the Karhendezi-Bugoy geothermal field. In essence, it is a calcareous concretion with a rough surface (massive structure). The soil is predominantly clayey-graphite with veins of quartz (1 cm thick), rich in red iron oxides and calcite. A dozen hot springs are located on either side of the Karhendezi-Cidubwe river (Figure 5a, b). Several dissolved minerals, including sulfur, contribute to a rotten egg-like smell in the water, which is between 65℃ and 73℃.
Figure 5. A travertine deposit surrounded by green algae at the emergence of a geothermal spring(a). Sample of travertine (b)
3.1.3 Rocks with greenschist facies
Pelite and graphitic black shale These are clayey rocks that have been indurated and stratified by compaction. Throughout the study area, they are found in black-grayish and yellowish colors. (Figure 6a, b) shows pelite cleavages that are slightly fresh on matte surfaces. A microscopic examination of the rock shows quartz (20-40%), sericite (15-20%), and chlorite (10-15%); there is a second order birefringence and the rock is polarizing into a greenish color with a right extinction angle (Figure 7a, b). Graphitic black shale, like pelite, exhibits a flaky texture due to foliation (Figure 6c, d) containing quartz crystals (15%), recrystallized pyrite (50%), carbon (10%), and muscovite (5%) (Figure 7c, d).
Figure 6. A pelite outcrop from Bugoy area (a) and a corresponding sample (b). Outcrop of graphitic schists from Tshondo (c) and eroded sample (d) collected along Musheke river valley
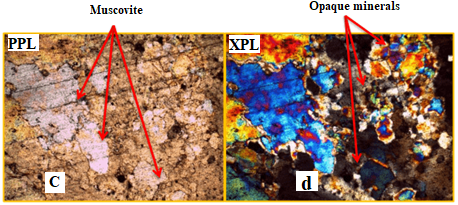
Figure 7. Microphotographs of pelite and graphitic schist (shale): microscopic observations in plane polarized light (a, c) and crossed polarized light (b, d)
3.1.4 Rocks with quartzitic facies
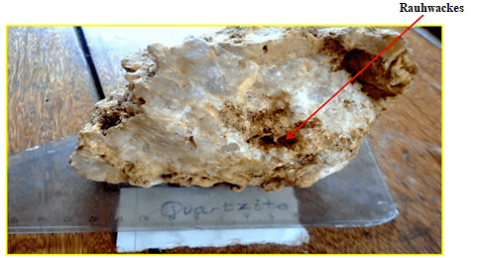
Quartzites. Their mineral composition consists of quartz minerals along with hematite, muscovite, biotite, and K-feldspar. Those found at Tshondo exhibit a superficial alteration of the type "cargneule-type" which is characterized by decayed and vacuolar habits (Figure 8). Quartz crystals appear as transparent patches under a microscope, whereas metallic minerals appear opaque. There are irregular shapes and xenomorphic properties to these minerals. Small elongated prisms of alkaline feldspar are also colorless. With relatively high relief and dark brown to greenish pleochroism, the yellow-browned absorption minerals represent biotite. Cross-polarized light shows bright polarization colors ranging from gray to white with an undulatory extinction, indicating a positive deformation, but difficult to detect. An elongated and attenuated polarization tint is present in biotite. Due to the mass of opaque minerals, orthoclase shows an oblique extinction and Carlsbad twinning associated with two crystals (Figure 9a, b).
Auriferous quartzite, which is composed primarily of metallic minerals (here Au), is also analyzed. Gaseous inclusions appear as small bubbles. The colorlessness of mucovite can be attributed to its pleochroism, ranging from yellow to pale yellow (Figure 9c, d).
Figure 8. Sample of a Cargneule Quartzite from Tshondo
Figure 9. Microphotograph of ferriferous quartzite and gold-bearing quartz: in plane polarized light (a, c) and crossed polarized light (b, d)
3.2 Kinematic analysis
A total of 190 linear and planer features were analyzed. Subset indexes were used for conjugates shear fractures, fracture planes, extensive fractures, joints as well as foliation and bedding surfaces (Appendix Table 1, Table 2, and Table 3). In both areas, these measurements were used to quantify deformation.
Only a few faults with sense of movement were recorded due to the physical properties of the rock formations at Tshondo and Bugoy (friable, unconsolidated graphitic schists). It was not possible to collect a lot of data since fault planes are sparsely carved with tectoglyphs (Figure 10). In our opinion, erosion or other exogenous factors could have crumbled and erased most of the markers. A total of thirteen striae were correctly identified. As a result of their poor pronunciation, others were considered "Probable" and overlooked during the analysis process. The Striae have a preferential trend towards the NE-SW and NNE-SSW directions. There are two structural preferential trends for he fractures, bedding planes, and foliation: NE-SW and NNE-SSW (Figure 11a, b).
Figure 10. Striae appearing on a fault mirror and fault breccia made up with a mixture of clays and pellitic rocks
Figure 11. Rose diagram showing average statistical orientations for linear (a) and planar (b) measurements
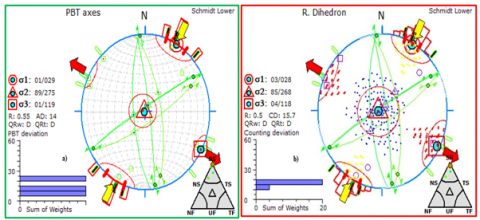
Figure 12. Stereoplots after optimization and separation: from PBT axes, R.Dihedron and R.Optim Methods(a, b, c) and final results for stress parameters (Reduced stress tensor, orientation of the horizontal principal stress axes and the stress regime
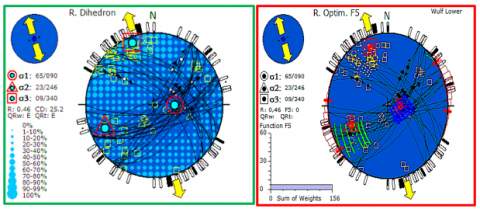
In accordance with Anderson's theory (Figure 14), kinematic analysis using Win-tensor software indicates two phases of deformation, highlighted by a strike-slip stress regime such that $\sigma_1: \mathrm{N} 118^{\circ} / 03^{\circ} \mathrm{SE}, \sigma_2: \mathrm{N} 358^{\circ} / 85^{\circ} \mathrm{SE}, \sigma_3: \mathrm{N}$ $208^{\circ} / 04^{\circ} \mathrm{SW}\left(\sigma_2 \geq \sigma_3 \geq \sigma_1\right)$ and an average stress ratio index $\mathrm{R}^{\prime}=1.53$ (Figure 12a, b, c), as well as a an pure extensive regime with stress ratio $\mathrm{R}=0.46$ (Figure 13). The principal $\sigma_3: \mathrm{N} 250^{\circ} / 9^{\circ} \mathrm{SW}\left(\sigma_1 \geq \sigma_2 \geq \sigma_3\right)$. The values were obtained following subsequent tensor optimization and data separation based on Dihedron methods, which requires the background minimum counting deviation value (C.V) representing $\sigma_1$ in the counting grid to be equal to 0 and the maximum counting deviation value representing $\sigma_3$ to be equal to 100 [11].
As shown by Villeneuve et al. [3, 6, 8, 15] and other reseachers who have investigated the Itombwe Synclinorium, Tshondo and Bugoy, as we have also just seen, have undergone a small-scale regional metamorphism, evolving towards greenschist facies and an important granitization highlighted by the Kasika granitic intrusion, but geochronological studies are needed.
Figure 13. Stereoplots after optimization and separation for conjugated fractures and faults without senses of movement: R.Dihedron and R.Optim Methods (a, b)
Figure 14. Stress regime and stress tensor types according to Anderson deformation theory [11]
Microscopic analyses of thin sections of rocks as well as different macroscopic observations have shown a mineral paragenesis mainly made of chlorites, muscovites / sericites and biotites, and metallic minerals. Observations also revealed large ranges of quartz which recrystallized under mono and polycrystalline crystals presenting undulatory to right extinctions.
Admittedly, traces of deformation were not detectable. It is believed that long after their formation, these lithological units underwent an orogeny marked by strong fracturing and a slightly to more pronounced crushing following N-S directions. Foliation is the most dominant structural feature and the most penetrating at the scale of the outcrops. This foliation probably corresponds to the major deformation phase in the Itombwe. It is associated with local folds testified by the Kinematic analysis performed on faults with movement. However, a second deformation is evidenced.
Investigations at Tshondo and Bugoy reveals four petrography facies mainly made of rocks such as graphitic schist, pelite, conglomerate, paraconglomerate, travertines, quartzites, and sandstone.They have undergone a strong to weak metamorphism that has evolved in the facies of green schists with quartz, chlorite, muscovite, biotite, and opaque minerals as dominant mineral assemblages.
The estimation of stress tensors using inversion techniques by Anderson [16] reveals pure strike-slip and extensive deformation phases. This is tangible proof that at least two phases of deformation have occurred in the geological formations outcropping at Tshondo and Bugoy. First, a ductile deformation phase D1-2 which generated isoclinal folds and then a submeridian brittle deformation which generated thrusting faults of Tshondo and Bugoy while reactivating stratification surfaces in a series of secondary faults trending NE-SW.
In order to complete this study, the following must be done in the future:
- Conduct a non-hasty lithostratigraphic study at Tshondo and Bugoy by drilling deep to determine the thickness of related formations.
- Polish sections of rocks in order to combine the mineral parageneses of greenschist facies with the parageneses of metallic minerals (opaque minerals).
- Analyze and characterize the faults affecting the formations in both areas, relying not on structural markers, but instead on morphological markers in direct field observation.
- Date both areas’ geological formations geochronologically and compare their ages with the ages established in the itombwe.
The authors acknowledge the help and support provided by the Department of Geology of the Official University of Bukavu. The authors declare that no funds, grants, or other support were received during the preparation of this manuscript.
|
Cm |
Centimetres |
|
C.V |
Counting deviation value |
|
D1 |
Deformation 1 |
|
D2 |
Deformation 2 |
|
DRC |
Democratic Republic of the Congo |
|
km |
Kilometres |
|
Ma |
Million years |
|
PBT |
Pressure tension and null axis |
|
PPL |
Plane Polarized Light |
|
XPL |
Crossed-Polarized Light |
|
|
Principal stress axis sigma 1 |
|
℃ |
Celcius degree |
Table 1. Structural measurements for striation and analytical results
|
Striae |
||||||
|
ID |
Lat (degree) |
Long X (degree) |
Alt Z (m) |
Plane |
Line |
Sense |
|
1 |
-2,87464 |
28,65513 |
1310 |
62/052 |
33/342 |
NS |
|
2 |
-2,87731 |
28,65761 |
1311 |
79/029 |
26/305 |
NS |
|
3 |
-2,87731 |
28,65761 |
1310 |
79/029 |
43/310 |
NS |
|
4 |
-2,87731 |
28,65761 |
1454 |
44/026 |
44/028 |
IS |
|
5 |
-2,87731 |
28,65761 |
1454 |
40/034 |
38/057 |
IS |
|
6 |
-2,87731 |
28,65761 |
1454 |
40/027 |
38/050 |
IS |
|
7 |
-2,8746 |
28,65511 |
1314 |
81/231 |
59/156 |
NS |
|
8 |
-2,8746 |
28.65511 |
1314 |
30/305 |
05/223 |
NS |
|
9 |
-2,87435 |
28,65801 |
1373 |
64/045 |
62/068 |
IS |
|
10 |
-2,87435 |
28,65801 |
1373 |
64/045 |
63/057 |
IS |
|
11 |
-2,87435 |
28,65801 |
1373 |
64/045 |
53/095 |
IS |
|
12 |
-2,87435 |
28,65801 |
1373 |
40/088 |
39/071 |
NS |
|
13 |
-2,87435 |
28,65801 |
1373 |
64/045 |
64/049 |
IS |
Table 1. Continued
|
Kinematic Axes |
Stress Parameters |
|||||||
|
PIncl |
P Azim |
B Incl |
B Azim |
T Incl |
T Azim |
Shmax |
Shmin |
R' |
|
46 |
285 |
44 |
111 |
3 |
18 |
107 |
17 |
1 |
|
26 |
254 |
61 |
98 |
10 |
349 |
77 |
167 |
1.5 |
|
38 |
249 |
45 |
108 |
20 |
356 |
79 |
169 |
1 |
|
1 |
207 |
1 |
297 |
89 |
72 |
27 |
117 |
2.5 |
|
6 |
227 |
11 |
318 |
77 |
109 |
46 |
136 |
2.5 |
|
6 |
220 |
11 |
311 |
77 |
102 |
39 |
129 |
2.5 |
|
46 |
81 |
29 |
316 |
30 |
207 |
104 |
14 |
1 |
|
42 |
195 |
30 |
316 |
34 |
68 |
174 |
84 |
1 |
|
18 |
53 |
9 |
320 |
69 |
204 |
57 |
147 |
2.5 |
|
19 |
49 |
5 |
317 |
71 |
213 |
51 |
141 |
2.5 |
|
15 |
65 |
24 |
328 |
61 |
183 |
70 |
160 |
2.5 |
|
81 |
22 |
8 |
168 |
6 |
259 |
170 |
80 |
0.5 |
|
46 |
2 |
316 |
71 |
221 |
47 |
137 |
2.5 |
2 |
Table 2. Structural measurements for conjugated fractures and analytical results
|
Conjugated Fractures |
|||||
|
ID |
Lat (degree) |
Long (degree) |
Alt (m) |
Fracture 1(degree) |
Fracture 2(degree) |
|
1 |
-2.87731 |
28.65761 |
1365 |
85/330 |
14/059 |
|
2 |
-2.87541 |
28.65461 |
1340 |
75/265 |
02/355 |
|
3 |
-2.87464 |
28.65514 |
1310 |
89/302 |
26/032 |
|
4 |
-2.87464 |
28.65514 |
1310 |
78/150 |
23/065 |
|
5 |
-2.87474 |
28.6551 |
1314 |
70/080 |
16/164 |
|
6 |
-2.79596 |
28.68737 |
1520 |
84/320 |
25/233 |
|
7 |
-2.79829 |
28.68514 |
1521 |
85/082 |
06/171 |
|
8 |
-2.79829 |
28.68514 |
1521 |
86/330 |
07/240 |
|
9 |
-2.79829 |
28.68514 |
1521 |
75/135 |
18/220 |
|
10 |
-2.79829 |
28.68514 |
1521 |
86/164 |
23/252 |
Table 2. Continued
|
Kinematic Axes |
Stress Parameters |
|||||||
|
PIncl |
P Azim |
B Incl |
B Azim |
T Incl |
T Azim |
Shmax |
Shmin |
R' |
|
26 |
9 |
75 |
259 |
12 |
118 |
27 |
117 |
1.5 |
|
26 |
9 |
75 |
259 |
12 |
118 |
27 |
117 |
1.5 |
|
49 |
25 |
64 |
214 |
6 |
316 |
47 |
137 |
1.5 |
|
49 |
25 |
64 |
214 |
6 |
316 |
47 |
137 |
1.5 |
|
197 |
25 |
64 |
38 |
8 |
291 |
19 |
109 |
1.5 |
|
197 |
25 |
64 |
38 |
8 |
291 |
19 |
109 |
1.5 |
|
206 |
8 |
82 |
30 |
1 |
296 |
26 |
116 |
1.5 |
|
206 |
8 |
82 |
30 |
1 |
296 |
26 |
116 |
1.5 |
|
236 |
21 |
67 |
83 |
10 |
330 |
58 |
148 |
1.5 |
|
236 |
21 |
67 |
83 |
10 |
330 |
58 |
148 |
1.5 |
Table 3. Structural measurements for bedding planes, fractures plane, joints, and foliation
|
Bedding planes, fracture planes, joints, foliation |
|||||
|
ID |
Lat Y (degree) |
Long X (degree) |
Alt Z (m) |
Dip-angle/Dip-direction (degree) |
Type |
|
1 |
-2.87464 |
28.65514 |
1522 |
85/320 |
Fracture plane |
|
2 |
-2.87464 |
28.65514 |
1522 |
85/305 |
Fracture plane |
|
3 |
-2.87474 |
28.6551 |
1522 |
85/150 |
Fracture plane |
|
4 |
-2.87474 |
28.6551 |
1522 |
63/104 |
Fracture plane |
|
5 |
-2.87515 |
28.65637 |
1705 |
80/175 |
Fracture plane |
|
6 |
-2.87515 |
28.65637 |
1705 |
37/350 |
Fracture plane |
|
7 |
-2.87562 |
28.65441 |
1721 |
75/300 |
Fracture plane |
|
8 |
-2.87515 |
28.65637 |
1721 |
72/175 |
Fracture plane |
|
9 |
-2.87515 |
28.65637 |
1721 |
37/175 |
Fracture plane |
|
10 |
-2.87731 |
28.65761 |
1721 |
80/122 |
Fracture plane |
|
11 |
-2.87731 |
28.65761 |
1721 |
80/122 |
Fracture plane |
|
12 |
-2.87731 |
28.65761 |
1721 |
85/076 |
Fracture plane |
|
13 |
-2.87688 |
28.65811 |
1721 |
79/042 |
Fracture plane |
|
14 |
-2.87688 |
28.65811 |
1688 |
75/043 |
Fracture plane |
|
15 |
-2.87688 |
28.65811 |
1688 |
76/040 |
Fracture plane |
|
16 |
-2.87688 |
28.65811 |
1688 |
70/042 |
Fracture plane |
|
17 |
-2.87688 |
28.65811 |
1688 |
75/040 |
Fracture plane |
|
18 |
-2.87818 |
28.65897 |
1688 |
75/044 |
Fracture plane |
|
19 |
-2.87691 |
28.65874 |
1672 |
76/045 |
Fracture plane |
|
20 |
-2.87688 |
28.65811 |
1672 |
89/052 |
Fracture plane |
|
21 |
-2.87688 |
28.65811 |
1672 |
87/055 |
Fracture plane |
|
22 |
-2.87923 |
28.66048 |
1672 |
74/110 |
Fracture plane |
|
23 |
-2.87691 |
28.65874 |
1672 |
66/091 |
Fracture plane |
|
24 |
-2.87691 |
28.65874 |
1654 |
86/336 |
Fracture plane |
|
25 |
-2.87691 |
28.65874 |
1654 |
88/352 |
Fracture plane |
|
26 |
-2.87691 |
28.65874 |
1654 |
65/263 |
Fracture plane |
|
27 |
-2.87691 |
28.65874 |
1654 |
49/037 |
Fracture plane |
|
28 |
-2,87562 |
28,65441 |
1355 |
20/099 |
Bedding plane |
|
29 |
-2,87491 |
28,65592 |
1348 |
61/255 |
Bedding plane |
|
30 |
-2,87491 |
28,65592 |
1348 |
61/262 |
Bedding plane |
|
31 |
-2,87515 |
28,65637 |
1365 |
86/262 |
Bedding plane |
|
32 |
-2,87515 |
28,65637 |
1365 |
85/092 |
Bedding plane |
|
33 |
-2,87515 |
28,65637 |
1365 |
85/272 |
Bedding plane |
|
34 |
-2,87515 |
28,65637 |
1365 |
80/264 |
Bedding plane |
|
35 |
-2,87515 |
28,65637 |
1365 |
80/272 |
Bedding plane |
|
36 |
-2,87731 |
28,65761 |
1454 |
84/272 |
Bedding plane |
|
37 |
-2,87731 |
28,65761 |
1454 |
85/122 |
Bedding plane |
|
38 |
-2,87731 |
28,65761 |
1454 |
71/122 |
Bedding plane |
|
39 |
-2,87731 |
28,65761 |
1454 |
76/142 |
Bedding plane |
|
40 |
-2,87731 |
28,65761 |
1454 |
80/150 |
Bedding plane |
|
41 |
-2,87688 |
28,65811 |
1416 |
85/110 |
Bedding plane |
|
41 |
-2,87688 |
28,65811 |
1416 |
85/010 |
Bedding plane |
|
42 |
-2,87688 |
28,65811 |
1416 |
16/185 |
Bedding plane |
|
43 |
-2,87688 |
28,65811 |
1416 |
42/089 |
Bedding plane |
|
44 |
-2,87818 |
28,65897 |
1409 |
75/022 |
Bedding plane |
|
45 |
-2,87818 |
28,65897 |
1409 |
10/002 |
Bedding plane |
|
46 |
-2,87691 |
28,65874 |
1356 |
65/008 |
Bedding plane |
|
47 |
-2,87691 |
28,65874 |
1356 |
40/290 |
Bedding plane |
|
48 |
-2,87691 |
28,65874 |
1356 |
60/282 |
Bedding plane |
|
49 |
-2,87691 |
28,65874 |
1356 |
50/280 |
Bedding plane |
|
50 |
-2,87691 |
28,65874 |
1356 |
70/120 |
Bedding plane |
|
51 |
-2,87691 |
28,65874 |
1356 |
80/274 |
Bedding plane |
|
52 |
-2,87691 |
28,65874 |
1356 |
79/007 |
Bedding plane |
|
53 |
-2,87691 |
28,65874 |
1356 |
20/228 |
Bedding plane |
|
54 |
-2,87691 |
28,65874 |
1356 |
71/112 |
Bedding plane |
|
55 |
-2,85733 |
28,65827 |
1345 |
74/110 |
Bedding plane |
|
56 |
-2,85733 |
28,65827 |
1345 |
66/091 |
Bedding plane |
|
57 |
-2,85733 |
28,65827 |
1345 |
86/336 |
Bedding plane |
|
58 |
-2,85733 |
28,65827 |
1345 |
88/352 |
Bedding plane |
|
59 |
-2,85733 |
28,65827 |
1345 |
65/263 |
Bedding plane |
|
60 |
-2,87568 |
28,65882 |
1380 |
49/037 |
Bedding plane |
|
61 |
-2,87568 |
28,65882 |
1380 |
20/099 |
Bedding plane |
|
62 |
-2,87584 |
28,65888 |
1363 |
85/350 |
Bedding plane |
|
63 |
-2,87584 |
28,65888 |
1363 |
81/002 |
Bedding plane |
|
64 |
-2,87584 |
28,65888 |
1363 |
81/012 |
Bedding plane |
|
65 |
-2,8741 |
28,65462 |
1319 |
85/144 |
Bedding plane |
|
66 |
-2,8741 |
28,65462 |
1319 |
87/030 |
Bedding plane |
|
67 |
-2,87397 |
28,65886 |
1318 |
87/184 |
Bedding plane |
|
68 |
-2,87458 |
28,65505 |
1315 |
75/218 |
Bedding plane |
|
69 |
-2,8746 |
28,65511 |
1314 |
85/023 |
Bedding plane |
|
70 |
-2,85509 |
28,656 |
1352 |
75/046 |
Bedding plane |
|
71 |
-2,85509 |
28,656 |
1352 |
87/200 |
Bedding plane |
|
72 |
-2,87542 |
28,67637 |
1381 |
80/198 |
Bedding plane |
|
73 |
-2,87542 |
28,67637 |
1381 |
89/024 |
Bedding plane |
|
74 |
-2,87841 |
28,65871 |
1456 |
71/210 |
Bedding plane |
|
75 |
- 2,87904 |
28,66027 |
1511 |
88/190 |
Bedding plane |
|
76 |
-2,87812 |
28,659 |
1420 |
80/190 |
Bedding plane |
|
77 |
-2,87812 |
28,659 |
1420 |
80/144 |
Bedding plane |
|
78 |
-2,87549 |
28,65672 |
1392 |
81/200 |
Bedding plane |
|
79 |
-2,87549 |
28,65672 |
1392 |
76/200 |
Bedding plane |
|
80 |
-2,87472 |
28,65511 |
1318 |
84/032 |
Bedding plane |
|
81 |
-2,87476 |
28,65503 |
1317 |
89/032 |
Bedding plane |
|
82 |
-2,87435 |
28,65801 |
1373 |
85/222 |
Bedding plane |
|
83 |
-2,87167 |
28,6783 |
1398 |
80/010 |
Bedding plane |
|
84 |
-2,87167 |
28,6783 |
1398 |
82/200 |
Bedding plane |
|
85 |
-2,87167 |
28,6783 |
1398 |
89/190 |
Bedding plane |
|
86 |
-2,87546 |
28,65895 |
1330 |
85/182 |
Bedding plane |
|
87 |
-2,87564 |
28,65927 |
1346 |
89/006 |
Bedding plane |
|
88 |
-2,87482 |
28,65847 |
1316 |
75/042 |
Bedding plane |
|
89 |
-2.87443 |
28.65554 |
1311 |
85/045 |
Foliation |
|
90 |
-2.87208 |
28.67290 |
1409 |
71/042 |
Foliation |
|
91 |
-2.87208 |
28.67290 |
1409 |
70/044 |
Foliation |
|
92 |
-2.87208 |
28.67290 |
1409 |
88/034 |
Foliation |
|
93 |
-2.87208 |
28.67290 |
1409 |
85/032 |
Foliation |
|
94 |
-2.87443 |
28.65554 |
1311 |
74/035 |
Foliation |
|
95 |
-2.782 |
28.68537 |
1512 |
71/032 |
Foliation |
|
96 |
-2.782 |
28.68537 |
1512 |
85/044 |
Foliation |
|
97 |
-2.782 |
28.68537 |
1512 |
75/052 |
Foliation |
|
98 |
-2.782 |
28.68537 |
1512 |
52/032 |
Foliation |
|
99 |
-2.782 |
28.68537 |
1512 |
67/054 |
Foliation |
|
100 |
-2.782 |
28.68537 |
1512 |
66/050 |
Foliation |
|
101 |
-2.79817 |
28.68407 |
1522 |
45/044 |
Foliation |
|
102 |
-2.79817 |
28.68407 |
1522 |
70/060 |
Foliation |
|
103 |
-2.79817 |
28.68407 |
1522 |
49/022 |
Foliation |
|
104 |
-2.87464 |
28.65514 |
1310 |
53/034 |
Fracture plane |
|
105 |
-2.87464 |
28.65514 |
1310 |
65/052 |
Fracture plane |
|
106 |
-2.87474 |
28.6551 |
1314 |
61/055 |
Fracture plane |
|
107 |
-2.87474 |
28.6551 |
1314 |
39/032 |
Fracture plane |
|
108 |
-2.87515 |
28.65637 |
1365 |
75/063 |
Fracture plane |
|
109 |
-2.87515 |
28.65637 |
1365 |
45/042 |
Fracture plane |
|
110 |
-2.87562 |
28.65441 |
1355 |
45/052 |
Fracture plane |
|
111 |
-2.87515 |
28.65637 |
1365 |
41/044 |
Fracture plane |
|
112 |
-2.87515 |
28.65637 |
1365 |
40/041 |
Fracture plane |
|
113 |
-2.87731 |
28.65761 |
1454 |
39/032 |
Fracture plane |
|
114 |
-2.87731 |
28.65761 |
1454 |
42/024 |
Fracture plane |
|
115 |
-2.87731 |
28.65761 |
1454 |
44/058 |
Fracture plane |
|
116 |
-2.87688 |
28.65811 |
1416 |
44/043 |
Fracture plane |
|
117 |
-2.87688 |
28.65811 |
1416 |
53/030 |
Fracture plane |
|
118 |
-2.87688 |
28.65811 |
1416 |
37/016 |
Fracture plane |
|
119 |
-2.87688 |
28.65811 |
1416 |
44/044 |
Fracture plane |
|
120 |
-2.87688 |
28.65811 |
1416 |
40/042 |
Fracture plane |
|
121 |
-2.87818 |
28.65897 |
1409 |
42/045 |
Fracture plane |
|
122 |
-2.87691 |
28.65874 |
1356 |
35/032 |
Fracture plane |
|
123 |
-2.87688 |
28.65811 |
1416 |
39/034 |
Fracture plane |
|
124 |
-2.87688 |
28.65811 |
1416 |
39/030 |
Fracture plane |
|
125 |
-2.87923 |
28.66048 |
1551 |
64/069 |
Fracture plane |
|
126 |
-2.87691 |
28.65874 |
1356 |
65/069 |
Fracture plane |
|
127 |
-2.87691 |
28.65874 |
1356 |
49/026 |
Fracture plane |
|
128 |
-2.87691 |
28.65874 |
1356 |
50/028 |
Fracture plane |
|
129 |
-2.87691 |
28.65874 |
1356 |
41/022 |
Fracture plane |
|
130 |
-2.87691 |
28.65874 |
1356 |
38/010 |
Fracture plane |
|
131 |
-2.87691 |
28.65874 |
1356 |
44/140 |
Fracture plane |
|
132 |
-2.87691 |
28.65874 |
1356 |
85/052 |
Fracture plane |
|
133 |
-2.87691 |
28.65874 |
1356 |
72/042 |
Fracture plane |
|
134 |
-2.87691 |
28.65874 |
1356 |
60/035 |
Fracture plane |
|
135 |
-2.87568 |
28.65882 |
1380 |
59/020 |
Fracture plane |
|
136 |
-2.87584 |
28.65888 |
1363 |
70/038 |
Fracture plane |
|
137 |
-2.87584 |
28.65888 |
1363 |
64/044 |
Fracture plane |
|
138 |
-2.87464 |
28.65514 |
1310 |
61/018 |
Fracture plane |
|
139 |
-2.87585 |
28.65409 |
1368 |
54/038 |
Joint |
|
140 |
-2.87620 |
28.67660 |
1440 |
68/035 |
Joint |
|
141 |
-2.87701 |
28.65816 |
1414 |
70/028 |
Joint |
|
142 |
-2.87868 |
28.66009 |
1492 |
66/048 |
Joint |
|
143 |
-2.87496 |
28.65596 |
1349 |
67/052 |
Joint |
|
144 |
-2.87196 |
28.673 |
1416 |
49/028 |
Joint |
|
145 |
-2.87516 |
28.65844 |
1325 |
53/032 |
Joint |
|
146 |
-2.79596 |
28.68737 |
1520 |
40/056 |
Joint |
|
147 |
-2.79829 |
28.68514 |
1521 |
60/082 |
Joint |
|
148 |
-2.79829 |
28.68514 |
1521 |
55/050 |
Joint |
|
149 |
-2.79829 |
28.68514 |
1521 |
60/064 |
Joint |
|
150 |
-2.79829 |
28.68514 |
1521 |
46/036 |
Joint |
|
151 |
-2.79829 |
28.68514 |
1521 |
46/014 |
Joint |
|
152 |
-2.79817 |
28.68407 |
1522 |
81/040 |
Joint |
|
153 |
-2.79817 |
28.68407 |
1522 |
75/030 |
Joint |
|
154 |
-2.79817 |
28.68407 |
1522 |
70/050 |
Joint |
|
155 |
-2.79817 |
28.68407 |
1522 |
57/010 |
Joint |
|
156 |
-2.8225 |
28.68217 |
1705 |
56/010 |
Joint |
|
157 |
-2.82297 |
28.68180 |
1721 |
50/070 |
Joint |
|
158 |
-2.82297 |
28.68180 |
1721 |
72/023 |
Joint |
|
159 |
-2.82297 |
28.68180 |
1721 |
65/034 |
Joint |
|
160 |
-2.82297 |
28.68180 |
1721 |
59/045 |
Joint |
|
161 |
-2.82126 |
28.68261 |
1672 |
75/132 |
Joint |
|
162 |
-2.83088 |
28.69354 |
1702 |
85/118 |
Joint |
|
163 |
-2.83088 |
28.69354 |
1702 |
81/112 |
Joint |
|
164 |
-2.83010 |
28.69312 |
1704 |
65/124 |
Joint |
|
165 |
-2.83010 |
28.69312 |
1704 |
88/288 |
Joint |
|
166 |
-2.79596 |
28.68737 |
1520 |
84/300 |
Joint |
[1] Lepersonne, J. (1971). Les formations du soubassement au Maniema et au Kivu. Belgium, Tervuren.
[2] Villeneuve, M. (1978). Etude Photogéologique du Secteur Precambrien de Luemba (Sud-Kivu-Zaire) la partie Meridionale du “Synclinal de L’itombwe” et son Substratum. Annales de La Société Géologique de Belgique, 101: 47-52. https://popups.uliege.be/0037-9395/index.php?id=4379.
[3] Villeneuve, M. (1987). Géologie du Synclinal de l’Itombwe (Zaire Oriental) et le Problème de l’existence d’un Sillon Plissé Pan-Africain. Journal of African Earth Sciences, 9(6): 869-880. https://doi.org/10.1016/0899-5362(87)90046-7
[4] Lefevère, J. (2003). Analyse et interprétation des canevas lithostratigraphiques et tectoniques du Synclinal de l’Itombwe (Sud-Kivu République Démocratique du Congo) à l’aide des données satellitaires et radar. Université Libre de Buxelles.
[5] Lhoest, A. (1946). Une coupe remarquable des couches de base de l’Urundi, dans l’Itombwe (Congo belge). Annales de La Société Géologique de Belgique., 69(B): 250-256.
[6] Walemba, K.M. (2001). Geology, geochemistry, and tectono-metallogenic evolution of Neoproterozoic gold deposits in the Kadubu area, University of the Witwatersrand. http://hdl.handle.net/10539/15209, accessed on June 17, 2022.
[7] Peeters, L. (1952). Observations géomorphologiques et géologiques au Sud-Ouest de Costermansville (Kivu). Annales Du Musée Du Congo Belge, 8(10): 9-62. http://bibliotheque.donboscordc.org/index.php?lvl=notice_display&id=1331.
[8] Walemba, K.M.A., Master, S. (2005). Neoproterozoic diamictites from the Itombwe Synclinorium, Kivu Province, Democratic Republic of Congo: Palaeoclimatic significance and regional correlations. Journal of African Earth Sciences, 42(1-5): 200-210. https://doi.org/10.1016/j.jafrearsci.2005.08.009
[9] Villeneuve, M., Chorowicz, J. (2004). Les sillons plissés du Burundien supérieur dans la chaine Kibarienne d’Afrique centrale. Geosciences, 336(9): 807-814. https://doi.org/10.1016/j.crte.2004.01.006
[10] Villeneuve, M. (1977). Précambrien du Sud du lac Kivu. Etude stratigraphique, pétrographique et tectonique, Fac. Sci et Techn. St Jérôme, 1977. https://doi.org/10.2113/gssgfbull.S7-XX.6.915
[11] Delvaux, D., Sperner, B. (2003). New aspects of tectonic stress inversion with reference to the TENSOR program. The Geological Society of London, 212: 75-100. http://dx.doi.org/10.1144/GSL.SP.2003.212.01.06
[12] Angelier, J. (1994). Fault slip analysis and paleostress reconstruction. Continental Deformation, 4: 101-120.
[13] Angelier, J., Tarantola, A., Manoussis, S. (1982). Inversion of field data in fault tectonics to obtain the regional stress — I. Single phase fault populations: A new method of computing the stress tensor. Geophysical Journal of the Royal Astronomical Society, 69(3): 607-621. https://doi.org/10.1111/j.1365-246X.1982.tb02766.x
[14] Hutchinson, C. (1974). Laboratoty Handbook of Petrographic Techniques. Wiley, New York. https://doi.org/10.1017/S001675680004574X
[15] Rumvegeri, B. (1987). Le Précambrien de l’Ouest du lac Kivu et sa place dans l’évolution géodynamique de l’Afrique centrale et oriental: pétrologie et Tectonique, St Jérôme.
[16] Anderson, E.M. (1905). The dynamics of faulting. Transactions of the Edinburgh Geological Society, 8(3): 387-402. https://doi.org/10.1144/transed.8.3.387