Kamal K. Chapagai
© 2021 IIETA. This article is published by IIETA and is licensed under the CC BY 4.0 license (http://creativecommons.org/licenses/by/4.0/).
OPEN ACCESS
The paper presents an implementation of prototype based Early Warning System (EWS) to detect and provide early warning of Landslide activities. The main aim of this work is to implement the prototype with low cost sensor network. A simulation setup and a table based prototype setup was implemented to study the capability and effectiveness of the system. The setup consists of table based setup of landslide with multiple/changing angle from 30° to 90°. Multiple sensing elements including rain sensor to detect presence of rain, soil moisture sensor to detect the moisture content, temperature and humidity sensor to detect humidity in the environment and vibration sensor to detect movement in the soil was implemented. The data captured by the sensing element is transmitted to a microcontroller which sends early warning signal represented by LED, Buzzer and sending of SMS or call. Through the setup, it is found that the sensitivity of the moisture sensor is rather limited however the range of moisture content detected by the sensor is functional. The vibration sensor can be tuned to have high sensitivity to the movement of the soil however, a number of false positive outcome may be detected. The early warning system is still possible by using multiple sensing element and averaging over their outcomes. The early warning system using low cost components as prototype has been successfully demonstrated. This setup can be scaled up to a real field implementation after careful tuning.
landslide EWS, landslide detection, prototype setup, Proteus simulation, low cost sensor network, Arduino microcontroller
Landslides are naturally occurring phenomenon in Bhutan with their occurrence coming in tens to hundreds annually. They are sparsely distributed across the country, with some major ones concentrated along the highways. These landslides are usually triggered by rainfall during rainy seasons. The rainfall triggered landslide that are concentrated along the south and south east part of the country occur during pre-monsoon and monsoon season and last from May to September. With the think hazard [1] placing Bhutan in high hazard level country, the monsoon season sees the most rainfall with average rain recorded at around 1663.4 mm [2] from 2004-2014 and peak rainfall at 2926.6 mm. With the highest number of landslides occurring along the national high way that connect the whole of the country from bordering hub, the impact of landslide is felt directly on the daily lives of the people and smooth functioning of the economy. A number of studies have been published to study the landslide in the country [3-5] and to analyze the relation between rainfall data as trigger for landslide using probabilistic method concluding that early warning system could be of utmost help in such cases [6]. However, no early warning system has actually been installed in these high risk areas. Therefore, this work aims to utilize these results and demonstrate a sensor network based early warning system with the capability to detect incipient faults occurring due to excessive rainfall and provide warning mechanism.
Early warning system plays a very important role in the daily lives of human being. It can be a bridge to decide upon the steps taken based on probability of occurrence of some events. With the advancement in technology, the focus of the modern world has been shifted towards making system smarter such that any eminent outcomes can be detected and its risks mitigated. Motor vehicle accident early warning system are given due importance today with advancement in driverless cars where the vehicle can detect eminent dangers and notify the proxy driver or stop the car from an accident [7-10]. This has been possible with the advancement in a number of technologies [11-15]. Other applications of early warning system include seismic activity detection and warning of eminent tsunami and landslides [16-18]. Also, parameters from other environment activities can be sensed and assessed for eminent threat.
Early warning system relies on data sensed from sensors, and controller to make decision or provide warning signals. Sensor networks are an important aspect of the early warning system. Sensor network consists of algorithmic arrangement of sensors and controllers around the area of interest such that the data captured by the sensors are suitably transmitted to the desired location. Early sensor network placed high priority in wireless sensor networks due to its capability to be installed in remote locations [19, 20]. However, the reliability of these sensor nodes plays important role in establishing a good network connectivity [21].
The sensors are other crucial components in these technology as the outcome of the sensors determine the decision taken. Any noise in the sensor data could corrupt the outcome and give rise to false positive or false negative decisions leading to undesired results. Sensitivity of the sensing device is also critical in outcome of the system because any minor changes that requires to be sensed has to be correctly determined. The sensors used in this project have limited sensitivity as they are off-the-shelf sensors and for experimentation purpose.
The decision of the outcome has to be made by a microcontroller. Microcontroller has come a long way in technological advancement and today microcontrollers provide very high speed of operation with low power consumption while connected to multiple input and output devices. The controller used in this work is a low power, medium speed microcontroller. It has 16 input and outputs, highly programmable, cheap and easily available. This makes its use more desirable however the controller supports low level of parallelism.
A number of components can be used for providing warning to the end users. In the current work, a LED, Buzzers and GSM module is used. GSM module can send SMS or call a number during times of eminent danger. The GSM module has disadvantage in places where there is no network coverage. With high priority given to wireless sensor network and its application in remote and inaccessible areas, GSM can be replaced with other technology such as ZigBee or Bluetooth. This can be enhanced using sensor network that can communicate with each other and have its own decision-making capability. However, the range of these technology are rather limited and hence requires the use of multiple components to cover a specific area. This increases the cost of the system.
The state of art, low power, independent wireless sensor motes [22] are available and consist of a controller and sensor nodes that communicate with each other to transmit information using number of different configurations. However, for a specific area, more number of devices are required to sense data, analyze and transmit data to desired locations. Additionally, hazard and calamities destroy these devices incurring huge expenses.
Therefore, this work implements a sensor network with a number of sensors covering a wide range of area controlled by a controller in a desired remote location. This helps to capture the difference in the activity in varied location using the same network and make independent decisions. The loss incurred in disaster is also reduced as the sensing elements are off-the-shelf and cheap.
The paper is organized as follows. Section 2 explains the tools and materials used in this work. In section 3, the system logic and its outcomes are explained. It also contains the simulation results. In section 4, the components and method used for system prototype implementation is explained. The results obtained from the prototype is provided in section 5 while the conclusion is in section 6. Finally, the acknowledgement and references are presented.
The system consists of a microcontroller which processes the signal flow through the system and is simulated using Proteus.
Proteus has the capability of simulating microcontroller and graphically representing the input and outputs in real time. The setup of the simulation of the system is shown in Figure 1. The core of the system is the Arduino, a versatile microcontroller that has the capability of interfacing with a wide range of sensing elements and display devices.
The simulation setup can be incorporated using all of the components in virtual models and their input/output relations understood. The simulation of the system begins with the interfacing of individual sensing elements or display units with the microcontroller and finally combining.
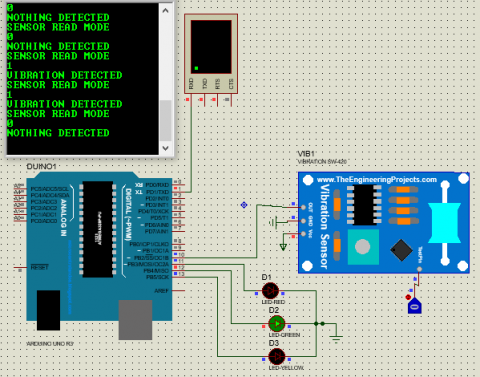
The Circuits in Figure 2 (Left) shows interfacing the Arduino microcontroller with the LED and its simulation, the figure to the right shows addition of a vibration sensor and its simulated output on a virtual terminal.
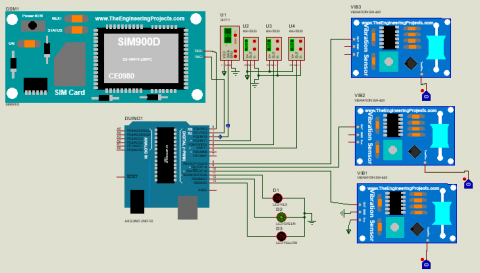
The final setup is shown in Figure 3. The system consists of three vibration sensors, three moisture sensors, One Temperature and Humidity sensor, three LEDs and A microcontroller with display device.
With this setup there are eight microcontroller terminals unused. These terminals in the field can be used for more Moisture and Vibration sensor pairs to cover larger area for assessment. One of the terminals in the field is used for buzzer. The buzzer is placed to give an audible sound to alert the nearby vicinity of the eminent threat of occurrence of Landslide.
Figure 1. Complete system connection (Including Controller, Sensors and Virtual Display)
Figure 2. Incorporating Display device to the system (LCD and Sensors)
Figure 3. Simulation circuit using all sensing elements and display devices
The program in Arduino runs in a sequential-manner. The system upon start goes into initialization mode where all components in the system are powered and started. The controller starts reading from the sensors and where required displaying the measurements and status of the system.
The system continuously reads the output of the Temperature and Humidity sensor, Soil Moisture sensor and Vibration sensors. Based on the outcome of these sensors, the system provides response in the form of LED, Buzzer or sending of SMS.
The Logic of the system is as follows:
3.1 Simulation results
The results of the simulation are in the form of measurement of data from the sensing elements, comparison of the data with the thresholds already assigned in the controller and transmitting the control signal to display/output devices.
Figure 4 shows an output of the system for measurement of data from the sensors and from the vibration sensors. From the outcome of the system, it is seen that the system can be used for early warning system with network of sensors placed at various locations. The data collected from the sensors are compared by the controller while saving in a remote or local location.
Figure 4. Typical output from the Arduino and GSM module
An early warning system prototype was implemented to simulate the real world scenario of the early warning system. The system consists of table size implementation of the landslide area with adjustment of angles from 300 to 900. This implementation allows to study the effect of the change in elevation of land on the susceptibility to landslide. However, the exact landslide cannot be created due to all the other parameters that are present in the land formation, the change in the land formation over time, the type of soil composition and distribution and age of the land formation.
Therefore, the simulated system is not focused on exact modelling/replication of the landslide but to determine the extent to which the early warning system can sense data from the physical medium, the sensitivity and accuracy of the sensing elements. The accuracy of decision making by the sensing. The accuracy and ability of the controlling elements and data transmission network are also studied from data analysis. Therefore, in this section, the component level understanding is explained with components testing and system level implementation including their results.
4.1 Components used
The system level implementation mainly consists of six main components:
4.2 Prototype implementation
These components are individually tested for their working range as per requirements. Upon completion of the component level testing, they are interfaced with the controller and logic of operation of the system installed in the controller. The controller can directly be programmed using a personal computer while the data from the controllers are read or saved via a USB interface and a data logger.
For the prototype model, a Landslide area on a box of 4ft length, 3ft breadth and 2ft height with adjustable angle of inclination was replicated. This would serve as point of installation of the system for simulation and measurement. The setup was placed in a fixed location indoors and filled with soil samples collected from fresh landslide area to look at the moisture content. The simulation also consists of vibration sensor activated from time to time to simulate the occurrence of a Landslide.
The samples were taken from various landslide areas along Thimphu-Phuentsholing Highway. Four set of samples were collected from major landslide areas along the highway and filled the prototype setup to be the testbench for the system to take measurements and simulate it as an active landslide area.
The type and the constituent of the matters in the soil samples is not studied in this project. The implementation aspect and its working principle/logic along with its outcome as a system operation is studied. The moisture content in the soil is studied in two ways. One is as it was while collecting the samples, then after the sample have almost completely dried, water is poured around the moisture sensor to look at the change in the soil moisture and how it changes over time. Another set of simulation is also the change in the temperature and the humidity of the room throughout. Any change in these parameters to the change in the condition of the setup can be seen from this. The vibration sensor was triggered manually. The trigger for the vibration sensor could be done when there is movement in the soil, however the correlation of that in the prototype is not shown.
The system is setup continuously for extended amount of time and its data logged in a computer connected to it. The logging system and a typical setup is shown in Figure 5.
Figure 5. Test bench Setup with sensor network and data logger
Figure 6. Output from the test bench setup and data looger for Temperature, Humidity and Vibration sensor
The results that are recorded through time are the sensed data from the sensing element, the working of the Microcontroller and its capability to detect data from sensor and the movement of sensor.
Others are the capability of the sensor to provide output to the system. The sensing elements sense the data from the atmosphere and the status of the soil and provide that data to the microcontroller. This data is stored in the PC using a data logging system connected via a USB connection.
An analysis of the data shows that the data logged is time-based change in the temperature and humidity of the atmosphere. It also shows the change in the humidity/moisture of the soil through time and any change in the parameter of the vibration sensor.
Figure 6 shows the outcome of the data logging system. The graph at the top of the Figure shows the humidity of the area, while the second one shows the temperature in the area. It can be seen that the temperature and humidity changes slightly over the period and has an oscillatory or repetitive behaviors where the time of the day, season and weather determines the amount of humidity and the temperature.
The X-Axis shows the time of the day and has been recorded for eight days at a stretch for this analysis. The data was logged at the rate of five seconds. This gives rise to a very high number of redundant data being captured however any change in parameter can be captured.
The last three lines are the change in the soil moisture. The change in moisture of the soil can be constant or sudden change and can remain constantly same for a number of days at a stretch. The vertical lines are the ones when the vibration sensors are triggered. Therefore, whenever there is rainfall and rainfall triggered landslide, the vibration sensor can be triggered and that is logged as an event for the system. When an event occurs, the system is also designed to sound a buzzer or send an information message in the form of SMS to the end user.
The paper presents a testbench implementation of Arduino based sensor network for early warning system (EWS). The implementation simulates a landslide with samples collected from rainfall triggered real landslide to test the variability and accuracy of sensing devices and early warning system for its performance. This system can be scaled up for implementation in real field to provide early warning system. The system can also be improved by incorporating more number of sensor and controllers to cover a larger area. Increasing the sensors with improved algorithm can also improve the reliability of the system.
The research was carried out with support from Annual University Research Grant (AURG), Royal University of Bhutan.
[1] ThinkHazard. (2020). Bhutan. [Online]. Available at: https://thinkhazard.org/en/report/31-bhutan/LS.
[2] Sarkar, R., Dorji, K. (2019). Determination of the probabilities of landslide events - A case study of Bhutan. Hydrology, 6(2): 52. https://doi.org/10.3390/hydrology6020052
[3] Faisal, I., Hilary, H., Jo-Ellen, P. (2011). Review of current and planned adaptation action: South Asia. Adaptation Patnership/International Institute for Sustainable Development. pp. 75-85.
[4] Ambrosi, C., Strozzi, T., Scapozza, C., Wegmuller, U. (2018). Landslide hazard assessment in the Himalayas (Nepal and Bhutan) based on Earth-Observation data. Engineering Geology, 237: 217-228. https://doi.org/10.1016/j.enggeo.2018.02.020
[5] Prokop, P., Walanus, A. (2017). Impact of the Darjeeling–Bhutan Himalayan front on rainfall hazard pattern. Natural Hazards, 89: 387-404. https://doi.org/10.1007/s11069-017-2970-8
[6] Sarkar, R., Dikshit, A., Hazarika, H., Yamada, K., Subba, K. (2019). Probabilistic rainfall thresholds for landslide occurrences in Bhutan. International Journal of Recent Technology and Engineering (IJRTE), 8(2S10): 737-742. https://doi.org/10.35940/ijrte.B1132.0982S1019
[7] Bao, J., Chen, W., Xiang, Z., Chen, Y., Shui, Y. (2018). Effect analysis of early warning for abandoned object on highway based on Internet-of-Vehicles CA Model. Discrete Dynamics in Nature and Society (DDNS), 2018: 3821731. https://doi.org/10.1155/2018/3821731
[8] Marian, L., Skrbek, J. (2017). A systems approach to designing a traffic collision avoidance early warning. Journal of Systemics, Cybernetics and Informatics, 15(3): 55-59.
[9] Bidinger, C., Bogenberger., K. (2017). Early warning system for emergency vehicles to prevent rear-end collisions by using radar sensors of current driver assistance systems. Mobil TUM 2017.
[10] Takatori, Y., Hasegawa, T. (2006). Stand-alone collision warning systems based on information from on-board sensors: Evaluating performance relative to system penetration rate. IATSS Research, 30(2): 39-47. https://doi.org/10.1016/S0386-1112(14)60168-0
[11] Mani, D., Amrith, P., Umamaheswari, E., Ajay, D., Anitha, R. (2019). Smart detection of vehicle accidents using object identification sensors with artificial intelligent systems. International Journal of Recent Technology and Engineering (IJRTE), pp. 375-379.
[12] Bhatti, F., Shah, M.A., Maple, C., Islam, S.U. (2019). A novel Internet of Things-enabled accident detection and reporting system for smart city environments. Sensors 2019, 19(9): 2071. https://doi.org/10.3390/s19092071
[13] Ramli, M.Z. (2011). Development of accident prediction model by using artificial neural network (ANN). Doctoral dissertation, Universiti Tun Hussein Onn Malaysia.
[14] Gour, D., Kanskar, A. (2019). Automated AI based road traffic accident alert system: YOLO algorithm. International Journal of Science and Technology Research, pp. 574-578.
[15] Chang, W., Chen, L., Su, K. (2019). DeepCrash: A deep learning-based Internet of Vehicles system for head-on and single-vehicle accident detection with emergency notification. IEEE Access, 7: 148163-148175. https://doi.org/10.1109/ACCESS.2019.2946468
[16] Demetriou, D. (2016). Tsunami two years on: Japan finally gets warning system that would have saved hundreds of lives. https://www.telegraph.co.uk/news/worldnews/asia/japan/9920042/Tsunami-two-years-on-Japan-finally-gets-warning-system-that-would-have-saved-hundreds-of-lives.html.
[17] Japan Meteorological Agency. (2013). Emergency Warning System. https://www.jma.go.jp/jma/en/Emergency_Warning/ew_index.html#:~:text=The%20Japan%20Meteorological%20Agency%20(JMA,natural%20phenomena%20of%20extraordinary%20magnitude.
[18] Galley, N., Yangzom, T., Tshering, U., Chapagai, K. (2016). Wireless sensor network based land slide detection and early warning system. Zorig Melong: A Technical Journal, 3(1). https://www.researchgate.net/publication/347945527_Wireless_Sensor_Network_Based_Landslide_Detection_and_Early_Warning_System.
[19] Chu, M., Patton, A., Roering, J., Siebert, C., Selker, J., Walter, C., Udell, C. (2021). SitkaNet: A low-cost, distributed sensor network for landslide monitoring and study, HardwareX, 9: e00191. https://doi.org/10.1016/j.ohx.2021.e00191
[20] Mainetti, L., Patrono, L., Vilei, A. (2011). Evolution of wireless sensor networks towards the Internet of Things: A survey. 19th International Conference on Software, Telecommunications and Computer Networks, Split, Croatia, pp. 1-6.
[21] Sohraby, K., Minoli, D., Znati, T. (2007). Wireless Sensor Networks: Technology, Protocols, and Applications, John Wiley and Sons.
[22] Kalnoor, G., Agarkhed, J. (2016). Performance of motes in Wireless Sensor Networks. 2nd International Conference on Applied and Theoretical Computing and Communication Technology (iCATccT). pp. 445-450. https://doi.org/10.1109/ICATCCT.2016.7912040