Salman Hamja Siombone* | Sukir Maryanto | Wiyono
© 2021 IIETA. This article is published by IIETA and is licensed under the CC BY 4.0 license (http://creativecommons.org/licenses/by/4.0/).
OPEN ACCESS
The research applied the remote sensing method to map land surface temperature (LST) distribution and geomorphological of Tiris geothermal area (TGA) in Lamongan Volcano Complex. This study was conducted in an area of 73 km2 covering both TGA and Lamongan Volcanic Field (LVF). The LST distribution was gained by processing thermal infrared images Landsat-8. Geomorphological studies in the study area were done by using 567 bands composite multispectral images Landsat-8 and DEM SRTM data. The geomorphological condition was depicted by visual delineation to the map of 567 band composite and 3D topographical model. The findings argued that the study area had a LST distribution of 15.84℃ to 41.05℃. The hot spots in the study area were mostly located in built-up area and bare land. There was no high LST anomaly seen in the areas near TGA due to influenced by a mixed temperature between hot springs and water flow temperature of Tancak River. Geomorphological findings clarified that in Lamongan Volcano, there were two lineaments leading to the northwest-southeast and northwest-east and there was a fault in TGA leading to northwest-southeast associated with Tancak watershed.
land surface temperature, remote sensing, geomorphology, fault, lineament, geothermal manifestation
One of the geothermal potential locations in East Java is Tiris area, in the Lamongan Volcano Complex, Probolinggo Regency. The geothermal potential there is approximately 74 MWe to 147 MWe, and covers approximately the area of 11 km2. The potential is marked by a geothermal manifestation in the form of hot spring water in Tancak River in Tiris [1, 2]. Tiris is a small village located in the northeast of Lamongan Volcano. There are several hot springs there, with temperatures about 35℃ to 45℃ warmer than 10℃, the temperature of nearby land water. It made us assume that the area was probably has geothermal potential [3].
Tiris geothermal areas in the Lamongan Volcano complex are regionally controlled by northwest-southeast and north-south structures, marked by some lineaments and fault [2, 4]. Those structures may also control hot springs existing in the northeast of the volcano. Geological structures there are crack and fault. The faults are well developed in Argopuro andesitic lava, Lamongan lava, and morphological lineament in the Argopuro pyroclastic flow. The faults are hot fluid paths that lead to the surface, creating a geothermal manifestation there [2]. Additionally, in the Lamongan volcanic complex contains volcanic cones and maars. The volcanic cones and maars created when magma directly contacts with water, resulting in phreatomagmatic eruption associated with pyroclastic fall and sediment flow. Maars and cinder cones frequently appear in the Lamongan Volcano complex, but the water temperature of the area is equal to the land-water temperature there (29℃). Several maars in the Lamongan Volcano complex are oriented to the northwest-southeast, and thus similar to the strikes of Tiris faults [3, 4].
Lamongan Volcano complex is characterized by a steep terrain landscape and dense tropical vegetation. Mapping the area geologically was challenging, due to difficult access and decayed rocks in the surface. For example, there are outcropping basaltic rocks that experience intense lateralization [3]. Such complex condition is the main cause of the difficulties in mapping the geothermal and geomorphological conditions of Lamongan Volcano complex. Therefore, we needed a research method that might cover a wider area. One of the methods to investigate surface with a wider cover that may map geological information that cannot be terrestrially covered is remote sensing [5-7]. Remote sensing is a science to gain information about some particular objects, areas, or phenomena by analysis and interpretation without making any direct contact with them [8, 9].
This research aims to map the distribution of the land surface temperature and geomorphological condition of Tiris geothermal areas in the Lamongan Volcano complex. Some previous research performed in Indonesia by Utama, et al. [10]; Sukendar et al. [11]; Azhari et al. [12]; and Bakruddin et al. [13], has clarified that the remote sensing method was ideal to map distribution of land surface temperature and geomorphological conditions in geothermal areas. The result of processing from remote sensing data may be used to interpret hot spots distributions; such as land surface temperature and geomorphological conditions in Tiris geothermal areas. Besides, the research was focused on hot spots distribution studies in Tiris geothermal areas by utilizing data of Landsat-8 satellite images; while geomorphological conditions were studied by utilizing both Landsat-8 images and DEM SRTM (digital evaluation model, the shuttle radar topography mission) data.
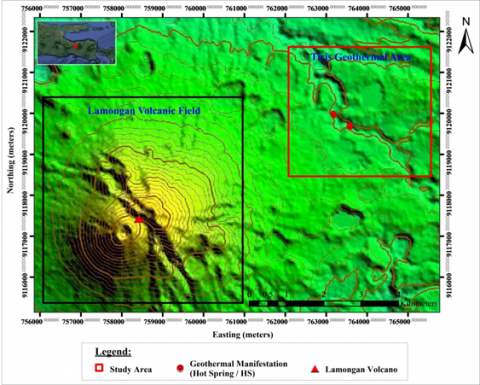
The research was carried out in Tiris geothermal areas of the Lamongan Volcano complex, Probolinggo Regency, East Java and covered ± 73 km2 of study area. Geographically, the area was in 49 Southern Hemisphere with the easting and northing positions of 755836.00 mE to 765831.00 mE and 9122318.00 mS to 9115076.00 mS. The research covered two major locations that were Tiris Geothermal Area (TGA) and Lamongan Volcanic Field (LVF). The study area is defined in Figure 1.
Figure 1. Study area of Tiris Geothermal Area in the Lamongan Volcano complex
3.1 Data
Remote sensing data employed in this research were Landsat-8 images for path: 116, and row: 66 to 65, and DEM SRTM data. The data were secondary data downloaded in USGS (United States Geological Survey) website. Furthermore, Landsat-8 data used were data recorded (acquisition) on May 17th, 2018; September 28th, 2018; and October 30th, 2018 with the cloud cover percentages of 5.26%, 1.11%, and 7.19% respectively. Satellite acquisition results are good when the cloud cover is less than 10% [14]. Referring to the cloud cover percentages of those three downloaded data, the data could be used. Moreover, DEM data used were 2014 DEM SRTM data.
Data employed to determine the distribution of land surface temperature (LST) were multispectral band images in Operational Land Imager (OLI) Landsat-8 censor and thermal infrared images in Thermal Infrared (TIR) Landsat-8 censor. The multispectral images for processing land surface temperature consisted of band 5 (Near Infrared/NIR) and band 4 (Red); while thermal infrared consisted of band 10 (TIR-1) and band 11 (TIR-2). Band composite data for visual delineation using Landsat-8 multispectral image were band 5 (NIR), band 6 (Short Wavelength Infrared-1/SWIR-1), and band 7 (Short Wavelength Infrared-2/SWIR-2) in OLI censor [15]. Visual delineation results in band 567 composite map were then correlated with information on the geological map. 3D DEM SRTM data were hired to re-study visual delineation results in band 567 composite result map.
3.2 Method
3.2.1 NDVI
Normalized Differential Vegetation Index (NDVI) value is a ratio that can be used to describe the vegetation density in an area [12]. Data used in the NDVI calculation were band 4 and 5 images. Before the calculation was conducted, those band images were radiometrically reviewed. The review was necessary to minimize any errors in acquisition the solar reflection value by altering the digital number (DN) value into top of atmosphere (ToA) reflectance. ToA reflectance correction equation as follows [15]:
$\rho_{\lambda}=\frac{M_{\rho} \cdot Q_{c a l}+A_{\rho}}{\sin \left(\theta_{S E}\right)}$ (1)
Here, ρλ is spectral reflectance (ToA reflectance) with solar angle correction, Mρ is a scale factor multiplying band reflectance, Qcal is DN value of each pixel, Aρ is a scale factor adding band reflectance, and θSE is the local solar elevation.
NDVI values were calculated by implementing band 4 and 5 reflectance (ρred and ρNIR, respectively) by applying Qin et al. [16], equation as follows:
$\mathrm{NDVI}=\frac{\rho_{\mathrm{NIR}}-\rho_{\mathrm{red}}}{\rho_{\mathrm{NIR}}+\rho_{\mathrm{red}}}$ (2)
The NDVI values ranged from -1 to +1. The -1, 0, and +1 values were correlated with the water object and any other object containing water, land object, and vegetation object respectively [15].
3.2.2 Vegetation fraction
Vegetation fraction is a percentage of vertical projection depicting vegetation land cover in an area. According to NDVI scores, vegetation fraction (Pv) can be obtained by applying equation as follows [17, 18]:
$P_{\mathrm{v}}=\left(\frac{\mathrm{NDVI}-\mathrm{NDVI}_{\min }}{\mathrm{NDVI}_{\max }-\mathrm{NDVI}_{\min }}\right)^{2}$ (3)
Here, NDVI is the NDVI value of each pixel, $\mathrm{NDVI}_{\max }$ is vegetation NDVI representation, and NDVI $_{\min }$ adalah land NDVI presentation to water bodies [17].
3.2.3 Land emissivity
Emissivity is an object capability to radiate its energy. The study area emissivity was calculated by using the NDVI method [16]. Classification of emissivity and NDVI values was in accordance with that of the research by Mia et al. [16, 17], that was:
$\varepsilon=m P_{V}+n$ (4)
with,
$\mathrm{m}=\varepsilon_{\mathrm{v}}-\varepsilon_{\mathrm{s}}-\left(1-\varepsilon_{\mathrm{s}}\right) \mathrm{F} \varepsilon_{\mathrm{v}}$
$\mathrm{n}=\varepsilon_{\mathrm{s}}+\left(1-\varepsilon_{\mathrm{s}}\right) \mathrm{F} \varepsilon_{\mathrm{v}}$
F was a shape factor (F = 0.55). Usually, an emissivity value ranged from 0.70 to 0.99 for the Earth surface [16]. Emissivity value ranges of diverse general materials are mentioned in Table 1 [19].
Table 1. Specific emissivity of various general materials
|
Material |
Average Emissivity |
|
Clean water |
0.98 – 0.99 |
|
Healthy green vegetation |
0.96 – 0.99 |
|
Wet land |
0.95 – 0.98 |
|
Bricks |
0.93 – 0.94 |
|
Wood |
0.93 – 0.94 |
|
Basaltic rock |
0.92 – 0.96 |
|
Dry mineral soil |
0.92 – 0.94 |
|
Dry vegetation |
0.88 – 0.94 |
|
Granite rock |
0.83 – 0.87 |
3.2.4 Calculation of land surface temperature
Land surface temperature (LST) was obtained by processing TIRS image data, i.e. band 10 and 11. LST was initially calculated by radiometric correction to change DN values of those two band images into TOA radiance values [18], by using this following equation:
$\mathrm{L}_{\lambda}=\mathrm{M}_{\mathrm{L}} \cdot \mathrm{Q}_{\mathrm{cal}}+\mathrm{A}_{\mathrm{L}}$ (5)
Here, Lλ is a spectral thermal band radiance (ToA radiance) (W m2 srad-1μm-1), ML is a scale factor multiplying radiance in bands, Qcal is the DN value of each pixel, and dan AL is a scale factor summing the radiance.
The next step was to alter the TOA radiance values (spectral radiance) in Eq. (5) into temperature brightness by using the following equation [15].
$\mathrm{T}_{\text {censor }}=\frac{\mathrm{K}_{2}}{\ln \left(1+\frac{\mathrm{K}_{1}}{\mathrm{~L}_{\lambda}}\right)}-273,15$ (6)
Here, K1 and K2 were specific thermal conversion constanta for thermal bands. Thermal conversion constanta values in Landsat-8 band 10 and band 11 are available in Table 2.
Table 2. Thermal conversion constanta values of landsat-8 band 10 and 11
|
Band |
Thermal Conversion Constanta |
|
|
$\mathbf{K}_{\mathbf{1}}$ |
$\mathbf{K}_{\mathbf{2}}$ |
|
|
Band 10 |
0774.8853 |
1321.0789 |
|
Band 11 |
480.8883 |
1201.1442 |
LST values were calculated by Eq. (7) given by Jimenez–Munoz and Sobrino [16], that was:
$\mathrm{T}_{\mathrm{s}}=\frac{\mathrm{T}_{\text {censor }}}{1+\left(\lambda_{\mathrm{band} 10,11} \cdot \frac{\mathrm{T}_{\text {censor }}}{\mathrm{h} \cdot \frac{\mathrm{c}}{\mathrm{j}}}\right) \ln \varepsilon}$ (7)
Here, Ts is LST (℃), λ is the radiance emission wavelength ($\lambda_{\text {Band } 10,11}=11.5 \mu \mathrm{m}$), h is the Planck constanta ($h=6.626 \times 10^{-34} \mathrm{Js}$), c is light speed ($\mathrm{c}=2.998 \times 10^{8} \mathrm{~m} \cdot \mathrm{s}^{-1}$), J is the Boltzman Constanta ($\mathrm{J}=1.38 \times 10^{-23} \mathrm{JK}^{-1}$), and ε is the land emissivity value.
3.2.5 Visual delineation
Visual delineation was performed to the results of 567 bands composite Landsat-8 processing and 3D modelling of DEM SRTM data. 567 band composite processing for fault and lineament structure analyses was carried out by using band 5, 6, and 7 image data in Landsat-8. The processing process was initially conducted by doing a radiometric correction to band 5, 6, and 7 images by implementing Equation 5. Next, 567 band composite could be processed. DEM SRTM data were cropped for the study area. Then, the atlas shaded map format with light direction for altitude of 76 and azimuth corner of 323o was chosen on the Dynamic Hill Shading menu of Global Mapper. After being processed, the data were presented in a 3D form.
Results and discussion were focused on data processing results for land cover (NDVI), emissivity, distribution of land surface temperature, and geomorphological condition of study area.
4.1 Land cover
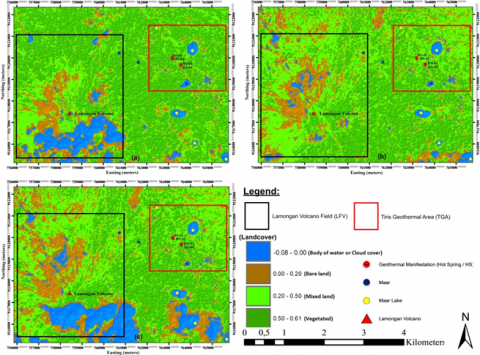
Land cover, or NDVI was presented in Figure 2 and calculated by using Eq. (2). The values were employed to determine land cover distribution. Results of land cover mapping in the study area based on NDVI values as well as the information were summarized in Table 3.
Land cover in the study area was classified in accordance with the research findings of Mia et al. [17, 18], that were bare land (0.00 < NDVI < 0.20), mixed land (0.20 < NDVI < 0.50), and vegetated land (NDVI > 0.50). Land filled by body of water or covered by clouds had an NDVI value of < 0.00. Table 3 reveals that land cover in the study area has NDVI values of -0.08 to 0.61. Referring to such classification, study area consisted of four land cover classifications, i.e. body of water, bare land, mixed land, and vegetated land. Moreover, average NDVI values shown in Table 3 state that the study area can be categorized as an area dominated by mixed land.
Figure 2 suggests land cover distribution according to NDVI values. Land cover close to Tiris geothermal areas (TGA) conveyed that there was highly changed land cover, from vegetated land into mixed land, as defined in Map (a), (b), and (c). The condition could be seen from the northeast of Tiris geothermal area. Meanwhile, geothermal manifestation to be hot springs was located in areas dominated by mixed land. Land cover in the field of Lamongan Volcano (LVF) described a significantly changed land cover, from mixed land into the combination between bare and mixed land. The condition of such drastically changed land cover in LVF was depicted in the north of Lamongan Volcano. In the south of TGA, there were several bodies of water, as illustrated by the blue color (round yellow shape). Furthermore, in Map (a) and (b), in the south of LVF, there was a huge cloud cover indicated by the blue color. In accordance to Figure 2, both TGA and LVF were dominated by mixed land.
Table 3. NDVI values in the study area
|
Recorded Data |
Minimum |
Maximum |
Average |
|
May 17th, 2018 |
- 0.05 |
0.61 |
0.43 |
|
September 28th, 2018 |
- 0.08 |
0.59 |
0.39 |
|
October 30th, 2018 |
- 0.06 |
0.58 |
0.33 |
Figure 2. Map of NDVI at (a) May 17th, 2018, (b) September 28th, 2018, and (c) October 30th, 2018
4.2 Emissivity
An object ability to radiate its energy may be revealed by its emissivity value. Varied emissivity values on surface were determined by varied land cover, surface composition, humidity, and roughness [18]. Emissivity value distribution in the study area is shown in Figure 3.
Figure 3 states that emissivity value distribution in the study area is greatly varied, ranging from 0.98 to 0.99. The lowest emissivity value, 0.98 was found in the maar lakes, conveyed by the dark red color. Such condition was due to bare land areas in forms of dry land, wet land, and murky water existing near those lakes. In general, wet land had emissivity values ranging from 0.95 to 0.98 as confirmed in Table 2. Moreover, the highest emissivity distribution, 0.99 was found in vegetated land, defined by the dark blue color. Figure 3 depicts that the highest emissivity was achieved by vegetated land; while the lowest one was achieved by murky body of water. Juniarti, et al. [7] figured out that vegetated land had an emissivity value of 0.99; while body of water had an emissivity value of 0.98.
4.3 Land surface temperature
LST values were processed by using Eq. (7) by including both land emissivity values and temperature brightness of thermal bands. Emissivity distribution in the study area was obtained based on the result of NDVI map processing; while temperature brightness was figured out by utilizing thermal Constanta in band 10 and 11. Results of LST data processing in the study area are summarized in Table 4.
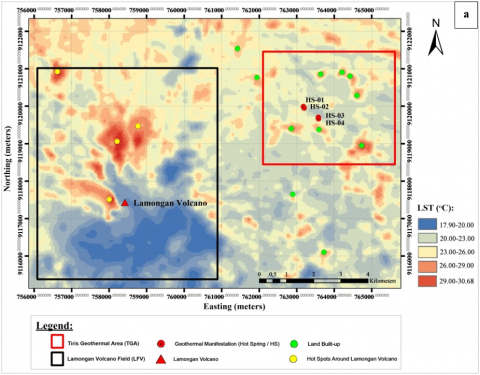
Table 5 declares the lowest to the highest LST in the study area for those LST data with different acquisition times. The data processing results explained that the temperature changed. The average LST for the first, second, and third data were 22.74℃ 25.81℃, and 26.95℃ respectively. Those three data were then orderly discussed based on the map of LST processing results, namely Figure 4a, 4b, and 4c. Study focus for LST anomaly distribution and hot spots were deliberately similar to investigate the pattern of LST anomaly distribution on those three maps.
Figure 4a is about the map of LST anomaly distribution for the acquisition time of May 17th, 2018. The map illustrated LST anomaly in the study area ranging between 17.90℃ to 30.68℃. In TGA (the red square), there were some areas with high LST anomaly (small green circles). In accordance with the observation using Google Earth, the areas were not a geothermal manifestation, but built-up areas and bare land. Hot springs in TGA did not indicate high LST anomaly. Their LST anomaly ranged between 23.10℃ to 23.27℃. It did not mark any temperature of hot spring, but river water temperature. It was due to the fact that those hot springs existed in Tancak watershed. LST anomaly distribution in LVF (the black square was presented by several areas with high LST anomaly (small yellow circles) in the north and northwest of Lamongan Volcano. Referring to the observation using Google Earth, the areas were in bare land.
Figure 3. Map of emissivity at (a) May 17th, 2018, (b) September 28th, 2018, and (c) October 30th, 2018
Table 4. LST in the Lamongan volcano field and Tiris geothermal area
|
Recorded Data |
Minimum (℃) |
Maximum (℃) |
Average LST (℃) |
Manifestation Points in Tiris (℃) |
|
May 17th, 2018 |
17.90 |
30.68 |
22.74 |
23.10 and 23.27 |
|
September 28th, 2018 |
16.81 |
38.26 |
25.81 |
25.49 and 25.84 |
|
October 30th, 2018 |
15.84 |
41.05 |
26.95 |
26.86 and 27.78 |
Figure 4. a: Map of land surface temperature distribution for the acquisition time of May 17th, 2018; b: Map of land surface temperature distribution for the acquisition time of September 28th, 2018; c: Map of land surface temperature distribution for the acquisition time of October 30th, 2018
Figure 4b presents a map of LST anomaly distribution for the time acquisition time of September 28th, 2018. The map reveals that LST anomaly in the study area ranges between 16.81℃ to 38.26℃, showing that LST anomaly values in Figure 4a had increased by 7.6℃ (Figure 4b). In TGA (the red square), there were some areas with high LST anomaly (small green circles). Referring to an observation using Google Earth, the areas were not a geothermal manifestation, but built-up areas and bare land. Hot springs in TGA did not suggest any high LST anomaly. Their LST anomaly ranged between 25.49℃ to 25.84℃. The manifestation temperature increased due to altered land cover in Tancak watershed. LST anomaly distribution in LVF (the black square) is depicted by some areas with high LST anomaly (small yellow circles). The areas had increased LST anomaly in the north and northwest of Lamongan Volcano, because of land cover transformation from vegetated land into bare land and mixed land combined.
Figure 4c explains the map of LST anomaly distribution for the acquisition time of October 30th, 2018. The map indicates that LST anomaly in the study area ranges between 15.84℃ to 41.05℃, marking that LST in Figure 4b increased by 2.77℃ (Figure 4c). In TGA (the red square), there were some areas with high LST anomaly (small green circles). According to the observation using Google Earth, those areas were not a geothermal manifestation, but both built-up areas and bare lands. Hot springs in TGA did not have high LST anomaly. They had LST anomaly ranging between 26.86℃ to 27.78℃. The manifestation temperature increased (Figure 4b) caused by land cover transformation in Tancak watershed. LST anomaly distribution in LVF (the black square) is presented by several areas with high LST anomaly (small yellow circles). There were significantly altered LST anomaly due to land cover transformation, from mixed land into bare and mixed land combined in the north and northeast of Lamongan Volcano.
Figure 4a, 4b, and 4c reveals that there is an increased temperature with similar trend of LST anomaly distribution. The increased temperature was influenced by land cover transformation there. The land that was initially vegetated land was transformed into mixed land. Geothermal manifestation locations in Tancak watershed pointed out no changed LST anomaly. The manifestation areas directly associated with Tancak watershed resulted in unwell-recapitulated LST anomaly in those areas. Therefore, manifestation temperature of those areas were not the real temperatures of the existing hot springs, but the mixed temperatures of rivers flowing there. Near TGA, high LST anomaly commonly existed in both housing complex and bare land. It is in accordance with the finding of research conducted by Uddin et al. [20] saying that built-up area and revitalized land created higher thermal effects due to small vegetation cover. Significantly changed LST anomaly near LVF was influenced by the land cover there, i.e. bare land, as stated by Mia et al. [17] that bare land was more actively thermal than vegetation one.
4.4 Geomorphology
Geomorphological condition in the study area was identified by the map of 567 band composite result and result of DEM SRTM topography 3D modelling. Visual delineation results on the map of 567 composite band were then compared to geological information on geological map resulted from the research to figure out locations and existences of lineament, fault, and maar. Next, the results were visually reviewed by employing the DEM SRTM topography 3D model.
Several crucial elements in the interpretation of 567 band composite result map (Figure 5a were black is body of water, brown-reddish is vegetated land, light blue is built-up area, and light green is bare land [6]. Figure 5a states that hot spots (small green circles) existing near TGA were not in the hot spring areas, but in built-up area and bare lands. Moreover, hot spots (small yellow circles) existing near LVF were actually bare land. There were five maars well identified and suggested by the black color. In the map of 567 band composite, there are two lineaments passing through Lamongan Volcano and heading to the northwest-southeast and northwest-east. In addition to that, in the northeast of the volcano, or TGA, there was a fault associated with Tancak watershed heading to the northwest and southeast. Lineaments and fault defined in the map of 567 band composite result possessed similarities to geological information described in Figure 5b.
Figure 5. a: Map of 567 band composite result; b: Geological map of study area (modified from [21])
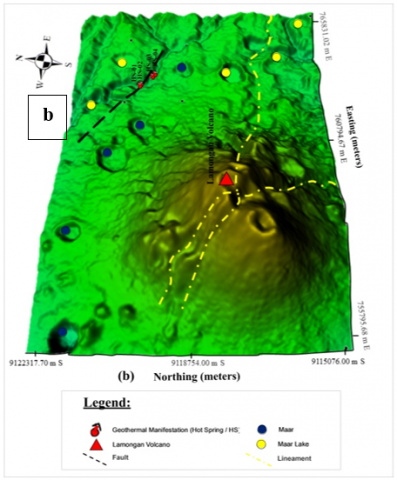
Figure 6. a: 3D Topography Model, Study Area from the South; b: 3D Topography Model, Study Area from the West
Geomorphological structures of maars and maar lakes in Figure 6 are defined by small blue and yellow circles. Maars and maar lakes around LVF were dominantly distributed from the southeast leading to the northwest. Additionally, in the northeast of LVF, or in TGA, there were some hot springs along Tancak watershed. The hot springs existed near the fault associated with Tancak watershed. The fault was oriented to the northwest-southeast, depicted by black dotted lines. It controlled hot springs that emerged in TGA. Furthermore, in the Lamongan Volcano body, there were two lineaments oriented to the northwest-southeast and northwest-east. The lineaments are illustrated by yellow dotted lines. Utama et al. [10] argued that by using the single band method on Landsat-7, they could indicate lineaments in the Lamongan Volcano and faults in TGA. There is no research analyzing the relationship between lineament effects on the Lamongan Volcano body and geothermal manifestation in forms of either fumaroles, hot springs, or hot rocks. However, Sukendar et al. [11] believes that lineament implies a geological structure in forms of faults, because areas with multiple lineaments are actually weak zone, since hot fluid may flow there, leading to the surface and making a surface manifestation.
Remote sensing method is capable to map the LST distribution and geomorphological condition on study area. Results of data processing of remote sensing mentioned that distribution of LST in the study area ranged between 15.84℃ to 41.05℃. High LST anomaly around TGA existed in both built-up area and bare lands and not in the geothermal manifestation location. In the north of LVF, LST anomaly increased highly, because of massively altered land cover from vegetated land into mixed land and bare land. Based on analysis of 567 band composite image and DEM SRTM 3D topographical modeling, it shown that the geomorphological conditions at the study area consist of lineaments, faults, maars, and maar lakes. Two lineaments were located in the Lamongan Volcano body and headed to the northwest-southeast and northwest-east. There was a fault oriented to the northwest-southeast and associated with Tancak watershed. The faults controlled hot springs emerging in TGA. Meanwhile, maars and maar lakes dominated the southeast- northwest areas of the study area.
The author would like to thank for Geophysics laboratory, Department of Physics, Faculty of Mathematics and Natural Sciences, Brawijaya University, Malang for providing support and assistance so that this research can be completed on time and without significant obstacles.
[1] Environment Service of East Java Province. (2016). Environmental Management Performance Information of East Java Province Year 2016. Surabaya, Indonesia. http://jatimprov.go.id/read/materi/informasi-kinerja-pengelolaan-lingkungan-hidup-daerah-provinsi-jawa-timur-tahun-2016, accesed on May 6, 2018.
[2] Directorate of Indonesian Geothermal. (2017). Potential Geothermal Indonesia Vol. 1. Ministry of Energy and Mineral Resources, Jakarta. https://ebtke.esdm.go.id/post/2017/09/25/1751/buku.potensi.panas.bumi.2017 , accesed on Jan. 28, 2018.
[3] Deon, F., Förster, H.J., Brehme, M., Wiegand, B., Scheytt, C., Moeck, I., Jaya, M. S., Putriatni, D.J. (2015). Geochemical/hydrochemical evaluation of the geothermal potential of the Lamongan volcanic field (Eastern Java, Indonesia). Geothermal Energy, 3(1): 20. http://dx.doi.org/10.1186/s40517-015-0040-6
[4] Carn, S.A. (2000). The Lamongan volcanic field, East Java, Indonesia: Physical volcanology, historic activity and hazards. Journal of Volcanology and Geothermal Research, 95(1-4): 81-108. http://dx.doi.org/10.1016/S0377-0273(99)00114-6
[5] Roy, D.P., Wulder, M.A., Loveland, T.R., Woodcock, C.E., Allen, R.G. (2014). Landsat-8: Science and product vision for terrestrial global change research. Remote Sensing of Environment, 145: 154-172. http://dx.doi.org/10.1016/j.rse.2014.02.001
[6] Putri, C.A.S., Purwanto, T.H. (2015). Interpretation of geological structure and lithology by landsat 8 and SRTM imagery in rembang district and its surrounding. Jurnal Bumi Indonesia, 4(3). http://lib.geo.ugm.ac.id/ojs/index.php/jbi/article/view/354/0, accesed on May 7, 2019.
[7] Juniarti, E., Maryanto, S., Susilo, A. (2017). Temperatures surface mapping of Wurung crater area, Bondowoso regency, east java in determination geothermal manifestations. Natural B, 4(1): 65-72. http://dx.doi.org/10.21776/ub.natural-b.2017.004.01.9
[8] Astisiasari, Hizbaron, D.R., Setiawan, M.A. (2020) Estimation of land surface temperature in Dieng volcanic complex using tir-based satellite imageries. IOP Conf. Series: Earth and Environmental Science, 451: 012066. http://dx.doi.org/10.1088/1755-1315/451/1/012066
[9] Soenarmo, S.H. (2009). Remote Sensing and Introduction to Geographical Information Systems for Earth Science, First Edition. Penerbit ITB, Bandung.
[10] Utama, W., Riski, S., Bahri, A.S., Warnna, D.D. (2012). ETM+ landsat image analysis for preliminary study of geothermal potential area determination at mount lamongan, tiris, probolinggo. Jurnal Fisika dan Aplikasinya, 8(1): 120103. http://dx.doi.org/10.12962/j24604682.v8i1.858
[11] Sukendar, P.M., Sasmito, B., Wijaya, A.P. (2016). Analysis of mount salak geothermal potential area distribution with surface temperature, vegetation, and geomorphology index. Jurnal Geodesi Undip, 5(2): 66-75.
[12] Azhari, A.P., Maryanto, S., Rachmansyah, A. (2016). Identification of geological structure and its effect on land surface temperature based on Landsat-8 data on the Blawan geothermal field. Jurnal Penginderaan Jauh dan Pengolahan Data Citra Digital, 13(1): 1-11. http://dx.doi.org/10.30536/j.pjpdcd.2016.v13.a2557
[13] Bakruddin, W.D., Utama, W. (2016). Use of Landsat-8 satellite imagery for fault analysis in the arjuno welirang geothermal field, East Java Province. Proceedings of the National Seminar on Infrastructure Technology Application Region IX (ATPW), Surabaya, pp. I-37–I-44. https://www.researchgate.net/publication/306357964, accesed on Dec. 20, 2018.
[14] Danoedoro, P. (2012). Introduction to Digital Remote Sensing, First Editon. Penerbit Andi, Yogyakarta.
[15] USGS. (2016). Department of the Interior U.S. Geological Survey. Vol. 8.
[16] Qin, Q., Zhang, N., Nan, P., Chai, L. (2011). Geothermal area detection using Landsat ETM+ thermal infrared data and its mechanistic analysis-A case study in Tengchong, China. International Journal of Applied Earth Observation and Geoinformation, 13(4): 552-559. http://dx.doi.org/10.1016/j.jag.2011.02.005
[17] Mia, M.B., Nishijima, J., Fujimitsu, Y. (2014). Exploration and monitoring geothermal activity using Landsat ETM+ images: A case study at Aso volcanic area in Japan. Journal of Volcanology and Geothermal Research, 275: 14-21. http://dx.doi.org/10.1016/j.jvolgeores.2014.02.008
[18] Mia, M.B., Fujimitsu, Y., Nishijima, J. (2017). Thermal activity monitoring of an active volcano using landsat 8/OLI-TIRS sensor images: A case study at the aso volcanic area in southwest Japan. Geosciences, 7(4): 118. http://dx.doi.org/10.3390/geosciences7040118
[19] Lillesand, T.M., Kiefer R.W., Chipman, J.W. (2004). Remote Sensing and Image Interpretation, (5 th ed.). John Wiley & Sons, USA.
[20] Uddin, S., Al Ghadban, A.N., Al Dousari, A., Al Murad, M., Al Shamroukh, D. (2010). A remote sensing classification for land-cover changes and micro-climate in Kuwait. International Journal of Sustainable Development and Planning, 5(4): 367-377. http://dx.doi.org/10.2495/SDP-V5-N4-367-377
[21] Suharsono, Surwati, T. (1992). Geological Map of The Probolinggo Quadrangle, Jawa (1:100.000). Geological Research and Development Centre, Bandung, Indonesia.