Solomon O. Amadi* | Mfongang E. Agbor | Sunday O. Udo
© 2021 IIETA. This article is published by IIETA and is licensed under the CC BY 4.0 license (http://creativecommons.org/licenses/by/4.0/).
OPEN ACCESS
In this study, Calabar annual total rainfall was analysed for trend and climatic variability events with focus on drought occurrence. Monthly rainfall data from in situ measurements over a 41-year period (1972-2012) were used for the study. Standard tests were used to evaluate the trends and variability in annual rainfall. Rainfall variability was estimated as standardized rainfall departures and used to identify and delimitate the dry and wet spell sequences of Calabar rainfall. The rainfall series were analysed for Standardized Precipitation Index (SPI) using SPSS Version 17 software. The least squares regression plot was executed using Excel 2010 to depict the trend, variability and regression parameters. The average annual rainfall for Calabar is 2984.64 mm with standard deviation of 394.9 mm. 36.59% of the period showed positive SPI while 63.41% of the period indicated negative SPI values. Wet spell dominated the later part of the period but sandwiched with dry spells whereas dry spell was dominant from 1972 to 1994. The area experienced a non-significant upward trend of 15.21 mm per year over the interval. The SPI values indicate that Calabar experienced distinct inter-annual rainfall cycles that represent mild to extreme droughts and wet spells which are a demonstration of consequential annual rainfall variability. The results underscore the need for effective monitoring of Calabar rainfall for prompt warnings and responses that would guarantee effective risk reduction and management in the run-in to the occurrence of the extreme events. The paper further highlights the need for data-driven approach to policy making in water resources management. This would provide a fascinating insight into the improvement in long-term water resources management in the city and its suburbs.
Calabar, drought, least squares regression, rainfall variability, standardized precipitation index, trend, water resources management
Rainfall is a basic component of the hydrological cycle and is characterized by high spatial and temporal variability. There has been a heightened concern about climate change across the globe in recent decades and the attendant changes in rainfall climatology. Rainfall is related to the processes of oceanic-atmospheric interactions which make the annual rainfall amount to vary in spatial and temporal dimensions. The spatio-temporal variations are demonstrated by characteristic seasonal distributions, intensity, duration and frequency of rainfall. The fluxes of heat, moisture and momentum greatly influence the development of oceanic and atmospheric circulations such that any significant variations in them affect the regional circulation and rainfall patterns. The pattern of sea surface temperature anomalies (SSTA) in the tropics and subtropics influence regional precipitation anomalies and reflect the importance of coupling in the ocean-atmosphere interface. In other words, SSTA induce changes in the atmospheric circulation patterns which subsequently affect the outcome of large-scale meteorological systems that produce precipitation across regions. Some known teleconnections associated with West African rainfall are South Atlantic SSTA and El Nino-Southern Oscillation (ENSO) phenomena [1].
Fluctuations in rainfall in the last century have been on the front burner with evidence of sequences of increasing and decreasing trends across the world [2] and Nigeria in particular [3-5]. Rainfall varies widely over short distances from year to year with evidence of strong correlation with latitude. The distribution of mean annual rainfall in Nigeria exhibits strong latitudinal dependence with negative correlation with latitude [5, 6]. It also exhibits some non-latitudinal differences. In Nigeria, the coastal areas adjoining the Atlantic Ocean are characterized by torrential rainfall, with possibility of rain all the year round. Calabar was identified as the wettest city in Nigeria with total annual rainfall sometimes in excess of 3,000 mm [6]. High rainfall amounts result from a number of factors usually in combination. The major factor is the position and duration of the Inter-Tropical Discontinuity (ITD) over an area. ITD is the line of demarcation between the two dominant wind systems, the northeast winds and the southwest winds. It is a monsoon trough (MT) which is a portion of the Inter-Tropical Convergence Zone (ITCZ). There is usually high rainfall amount over zones where the ITD is nearby almost throughout the year such as over the Atlantic Ocean north of the Equator which is within the zone of Calabar. Another important factor is orographic lifting. This is particularly pronounced where monsoonal winds are made to rise and uplifted by steep mountain ranges such as near Mountain Cameroun in Central Africa which is close to Calabar. Again, where orographic effects and onshore winds combine, high rainfall usually results. Tropical cyclones can also cause high rainfall. In this case, the zone of high rainfall follows the recurving path of the storm. Local processes, the convergence and change in direction of the trade winds as they approach the Equator are some minor effects that affect rainfall in the area. Rainfall has become more intense in recent times with frequent and devastating floods. In Nigeria, 2012 was tragic nation-wide as intense rainfalls wrecked serious havoc and left in their wake wanton destruction of lives and properties.
Dry and wet spell years across the tropics and subtropics have been linked to inter-annual variability related to ENSO phenomenon. Also, Atlantic SSTA can influence regional precipitations including intensifying or suppressing the ENSO effects [7, 8]. The combination of ENSO and South Atlantic SSTA has been reported to cause complex variations in wind flow close to the equatorial Atlantic [1] where the study area belongs.
ENSO episodes intensify north easterlies and suppress south westerlies, causing drought in West Africa near the Atlantic MT in July-September rainfall. ENSO is associated with a decline in the usual pressure gradient of the atmosphere between the high-pressure belt of the subtropics around the eastern equatorial Pacific Ocean and low pressure around the region of Australia-Indonesia. This climate anomaly causes some weather changes that are manifested in far apart regions of the globe including West Africa and the shores of Gulf of Guinea. In West Africa, positive correlation exists between tropical Atlantic SSTA and July-September rainfall south of Latitude 10° N. On the shores of the Gulf of Guinea, the positive correlation becomes more pronounced with the vanishing of the little dry season (LDS) normally observed in August in Nigeria. All these can be explained quantitatively in terms of the variations of the surface position of the MT. Intense warming anomalies in the South Atlantic Ocean cause a decline in temperature gradient towards the heated adjoining continent. This ushers in weakened monsoon flow that hinders the northward excursion of the MT in the northern summer, resulting in torrential rain along the Gulf of Guinea and a reduction in July-September rainfall further inland. Rainfall variability over the study area is influenced by South Atlantic SSTA and ENSO phenomena [1]. The simultaneous occurrence of both phenomena would suppress or amplify rainfall [7] depending on the tendency of the resultant wind flow variations (which are products of atmospheric and oceanic interactions) to induce conditions that could promote precipitation or otherwise.
Most studies on Calabar rainfall climatology and across regional borders concentrated on inter-annual rainfall trends and characterization in terms of total annual rainfall, onset, duration and cessation, e.g., [5, 6, 9-11]. Plants’ response to drought situations has shown that total annual rainfall in terms of normal, below or above normal is quite relevant. Although Calabar lies within the mangrove-swamp agro-ecological zone of Nigeria with characteristic high annual rainfall amount, NIMET [3] hinted on the likelihood of droughts in the area in the face of climate change which has altered the spatio-temporal features of rainfall and temperature. This underscores the need to continue to monitor the rainfall trends and variability even in locations with established rainfall pattern to evaluate their vulnerability to climatic variability events such as droughts and floods. It is, therefore, the purpose of this study to investigate the inter-annual rainfall variability in Calabar by assessing the definite anomalies in the annual rainfall amount. This will unravel the vulnerability of Calabar rainfall to climatic variability and the possible resulting consequences, and further authenticate the prognosticated likelihood of drought in the area. Agriculture is an important economic sector in the area where a variety of crops are grown. Rainfall anomalies which manifest as droughts and floods are capable of causing significant losses in production in the basin. Planning of rain-fed agricultural activities on the assumption of normal rainfall cycle is no longer tenable under a changing climate since rainfall is a major component of the hydrological cycle. Climate change affects all aspects of water resources management in such a manner that the past is no longer a reliable tool to predict future rainfall patterns. It is predicted that climate change will increase the frequency and intensity of climatic variability events such as droughts and floods thereby exacerbating water resources management challenges. Being extremely hydrological events, they can have adverse effects on the societal functions of a locality across socio-economic, political and cultural dimensions. Unraveling these climatic events may avert all these undesirable effects significantly. Objective evaluation of drought duration, magnitude and intensity will reduce the risks of society vulnerability.
Droughts are abnormally elongated period observed in the natural climate cycle. They are normal aspect of the climate and can be observed in different climate regimes globally, including rainforests and deserts. They are among the devastating natural hazards with widespread and significant impacts such as mass starvation, migration, famine and decline in socio-economic activities. This underscores the need to monitor droughts. Low latitude regions have experienced many devastating droughts in human history. Sub-Saharan Africa in particular has witnessed widespread droughts that caught the attention of the media since the early 1980s. In spite of the clear impression that is readily associated with drought, the debate has been much as to what could constitute drought. Four types of drought were proposed by Wilhite and Glantz [12] namely: meteorological, hydrological, agricultural and socio-economic droughts. In climate studies, the concern is about meteorological drought which refers to the period with the occurrence of less than the expected (normal) rainfall or more than the expected evaporation which has the tendency of inducing changes in atmospheric variables. Droughts are not unusual or unexpected occurrences. They result from the atmospheric and oceanic coupling processes that in turn produce the variability of the monsoons on inter-annual scales. In other words, droughts are occasioned by a range of processes of hydro-meteorological origin which inhibit precipitation and diminish the availability of surface and subsurface water, thereby creating drier than normal conditions to an extent that can cause significant damage.
Drought assessment usually uses a meteorological drought index for the purpose of defining drought magnitude. They could be characterized based on their severity, timing, duration and location. The summation of rainfall deficits about a chosen truncation level over a particular period is called the drought magnitude. When the drought magnitude is expressed as a ratio of the duration of the drought, it is called the drought intensity. A myriad of meteorological drought indices exist that can determine the extent of precipitation deviation from the established historical norms over a given period. They include standardized precipitation index (SPI), Palmer drought severity index (PDSI), percentage of normal precipitation index (PNPI), standardized anomaly index (SAI) etc. [13]. Fundamentally, none of the prominent indices is superior to others in all circumstances but some are more suitable than others in certain applications [14], each with its own strengths and limitations. No single drought index definition exists that has been suitable for all interests and purposes but there is a trend towards using normalized rainfall departures for analyzing droughts at the global tropics scale. That is the approach adopted in this paper. Most studies adopted precipitation shortages as signs of drought for the fact that precipitation is the single most significant input parameter for a variety of water-related processes. SPI was recommended by World Meteorological Organisation (WMO) in 2009 as a major meteorological drought index for monitoring and following drought conditions [15]. The use of SPI for monitoring meteorological drought was further highlighted by the reference [13].
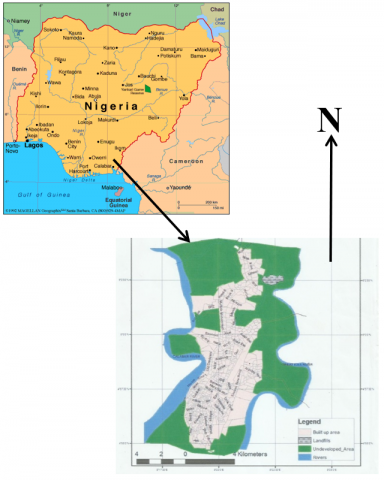
Figure 1. Map of Calabar and its geographical location in Nigeria (Map of Nigeria was adapted from www.infoplease.com)
Calabar lies on Latitude 4.58° N and Longitude 8.21° E and at an altitude of 62 m above mean sea level. It is a tropical coastal location in the mangrove swamp agro-ecological zone of Nigeria. Two major seasons prevail, namely, dry (usually short) and rainy seasons (usually lengthy). The rainy season usually commences around March-April and ceases around November. It has a mean annual total rainfall of about 3000 mm. Temperature is relatively constant throughout the year with average high temperature ranging from 25℃-28℃. The north-south migration of the ITD is the major determinant of the weather pattern of the area. The ITD is a discontinuity where the two dominant prevailing air masses converge. It is the zone of transition between the monsoons (northeast winds and southwest winds) and marks the surface position of the northern limits of the southwest monsoon (trade winds). Harmattan which is a season characterised with thick dust haze, early morning fog and mist around December to February is not significantly observed in the area. Figure 1 is map of Calabar and its geographical location in Nigeria.
4.1 Data
The data comprise the monthly time series of rainfall for 41 years (1972-2012) obtained from the archives of the Meteorological Department of Margaret Ekpo International Airport, Calabar, Nigeria. The station is a standard weather service station under the Nigerian Meteorological Agency (NiMet) with the capability of acquiring high quality observation data.
4.2 Methodology
Droughts are perceived as prolonged interval with substantial lower rainfall amount relative to the long-term average while floods are designated as periods with significantly higher rainfall amount compared to long-term normal levels. The most popular drought index has been the standardized precipitation index (SPI) developed by McKee et al. [16]. The SPI is valued for its robustness and versatility in drought analysis. Keyantash and Dracup [17] used statistical technique to test the robustness of 18 various drought indices and concluded that SPI had been adjudged the best climatic index in terms of drought identification, drought severity quantification, drought spatial extent and duration.
SPI makes use of precipitation history records of a station for any required number of timescales to develop a precipitation probability which are computed. SPI can be computed for $x \text { years for } 20 \leq x \geq 30 \text { with } x \geq 30$ being the ideal data length. Drought events are exhibited if the result of SPI turns out negative continuously and attain a value of -1, and drought is considered ongoing until SPI attains a value greater than or equal to zero. According to McKee et al. [16], drought sets in at SPI values between 0 and -1. However, other scholars use values less than -1 to initially indicate drought. The SPI categories are shown in Table 1 [16, 18].
In another development, Agnew [19] gave a categorization based on probability of drought occurrence as a measure of the severity of each dry spell (Table 2).
In a similar development, another drought index is the percentage of normal precipitation index, PNPI. It is expressed as the ratio of the amount of precipitation for a particular period to the average (normal) expressed as a percentage [20]. Table 3 is the drought index values based on PNPI classification.
Table 1. SPI categories [16, 18]
|
SPI values |
Categories |
|
0 to -0.99 |
Mild drought |
|
-1.0 to -1.49 |
Moderate drought |
|
-1.5 to -1.99 |
Severe drought |
|
< -2.0 |
Extreme drought |
Table 2. SPI categorization [19]
|
SPI |
Probability |
Category |
|
>1.65 |
0.05 |
Very humid |
|
>1.28 |
0.1 |
Humid |
|
>0.84 |
0.2 |
Moderately humid |
|
- 0.84 to + 0.84 |
0.6 |
Normal |
|
< - 0.84 |
0.2 |
Moderately dry |
|
< - 1.28 |
0.1 |
Dry |
|
< - 1.65 |
0.05 |
Very dry |
Table 3. Drought index values based on PNPI classification [20]
|
Normal and above |
Slight drought |
Moderate drought |
Severe drought |
|
(No risk) |
(Start monitoring) |
(Warning) |
(Emergency) |
|
>75 % |
65% to 75% |
55% to 65% |
< 55% |
Monthly total rainfall data were converted to total annual rainfall for the analysis. Analyses of trends and fluctuations were done using the least squares linear fitting. SPI values were evaluated with the aid of SPSS version 17 software. The SPI values were plotted against the years using Excel 2010 software. Regression analysis has been used in conjunction with other tools for the analysis of trends in climatic parameters in Nigeria (e.g. [5, 21, 22] etc.) and across the globe (e.g. [23-27] etc.).
The SPI is expressed as [16]:
$X_{j}=\frac{\left|r_{j-r_{i}}\right|}{\sigma_{i}}$ (1)
where,
$X_{j}$= Standardized Precipitation Index (Normalised departure),
$r_{j}$ is the annual total rainfall for the year j,
$r_{i}$ is the mean annual total rainfall for the station i,
$\sigma_{i}$ is the standard deviation of station i's annual rainfall.
The SPI is basically obtained by dividing the deviation of precipitation from the mean for a particular period of time with the standard deviation. The PNPI index is defined as [20]:
$P N P I=\left(p_{\left.a / p_{i}\right) X 100}\right.$ (2)
where,
$p_{a}$ = actual precipitation in mm,
$p_{i}$ = average precipitation in mm.
Drought magnitude $M_{j}$ is expressed as [14]:
$M_{j=} \sum_{i=1}^{n}\left|x_{o-X_{i}}\right|$ (3)
where,
$x_{o}$ = the standardized truncation level for each drought description,
$x_{i}$ = the standardized precipitation index,
n = number of deficits during the drought period.
The standardized truncation level is determined from Eq. (1) as [14]:
$\left(x_{\left.o-r_{i}\right) / \sigma}\right.$ (4)
The mean was the chosen truncation level here. The drought intensity, $I_{j}$ of the $j^{t h}$ dry spell is the ratio of drought magnitude to drought duration [14]:
$I_{j}=\frac{M j}{L j}$ (5)
where, $L_{j}$ is the drought duration.
Using SPI, wetter and drier conditions can be represented in a way that monitoring and warning alerts could be issued. A deficit occurs if the SPI is negative and vice versa. The magnitudes of the rainfall deficits accumulated over a dry period is the drought magnitude and it equals the sum of the absolute values of SPI for the period of the drought. SPI is evaluated for rainfall total recorded over any duration according to the need of the user. Weekly or monthly (short-term) durations are useful for agriculture while seasonal or annual (long-term) durations are required for water resources and supply management. SPI was evaluated in this paper based on annual duration.
Table 4 displays some descriptive statistics of Calabar annual rainfall. The positive skewness of the frequency distribution within the period is spectacular. The implication of this is that the negative rainfall anomalies (occasions when annual rainfall total is lower than the mean) are larger in number than the positive anomalies (occasions when annual rainfall total exceeds the mean). This is a clear demonstration that the long-term annual mean of rainfall is inflated by a very few excess annual totals. Nevertheless, the coefficient of variation (C.V) value of 13% represents a low variance of desperation. On the contrary, the value of the coefficient of skewness and the range of the annual rainfall totals are evidence that Calabar has a tendency for some extreme annual rainfall events such as flooding and drought. This underscores the importance of this study. It emphasizes the need for improved monitoring and early warning systems to ensure proactive adaptation and mitigation measures, identify cost effective solutions and smart implementation strategies to cope with the resulting consequential risks.
Table 5 presents the annual rainfall totals for the individual years with their corresponding SPI values and the drought intensities of various spells during the period. From the table, the highest rainfall amount was recorded in 2012, amounting to 4062.7 mm with SPI value of 2.67. The lowest annual rainfall amount was recorded in 1973 with a total of 2099.40 mm and SPI value of -2.07 followed by 1983 with a total rainfall of 2347.20 mm and SPI value of -1.47. The extreme low rainfall amounts observed in 1973 and 1983 are most likely due to the intense El Nino-Southern Oscillation (ENSO) episodes of 1973 and 1983. These two years went down in history as the years of most intense ENSO episodes in the 20th century [28]. ENSO is known to negatively correlate with West African rainfall [1, 29]. The period 1972-1975 recorded the highest standardized drought intensity of -0.9 while 1988-1994 was the most prolonged followed by 1981-1986. The 1991-1994 ENSO episode was identified as the most prolonged in the 20th century [30]. The period 2010-2012 recorded the highest standardized wet spell intensity of +1.41. The SPI values portray Calabar as having distinct rainfall cycles resulting in mild to severe drought and wet spells with associated risk levels (monitoring to warning and extreme risks). These cycles are perhaps associated with some teleconnection phenomena such as ENSO and Southern Atlantic SSTA, including contributions from the local climate dynamics. This result agrees with the paper [10] that observed 1983 as the driest year in Onitsha in southeastern Nigeria between 1979 and 2008 rainfall analysis over Onitsha with variability index of -2.38.
Table 4. Descriptive statistics of Calabar annual rainfall totals
|
Mean (mm) |
2,984.64 |
|
STD (mm) |
394.90 |
|
C.V (%) |
13.23 |
|
Skewness |
0.697 |
|
Kurtosis |
0.739 |
|
Highest (mm) |
4,062.7 |
|
Lowest (mm) |
2,099.4 |
|
Range (mm) |
1,963.3 |
Table 5. Calabar annual rainfall and standardized precipitation indices
|
Year |
Annual Rainfall(mm) |
SPI |
Drought Intensity |
|
1972 |
2954.0 |
-0.0051 |
-0.904 |
|
1973 |
2099.4 |
-2.0662 |
|
|
1974 |
2556.0 |
-0.9650 |
|
|
1975 |
2715.7 |
-0.5780 |
|
|
1976 |
2992.8 |
0.0885 |
|
|
1977 |
2646.7 |
-0.7463 |
|
|
1978 |
3296.1 |
0.8180 |
|
|
1979 |
2811.0 |
-0.3500 |
|
|
1980 |
3553.6 |
1.4409 |
|
|
1981 |
2736.9 |
-0.5287 |
-0.721 |
|
1982 |
2809.0 |
-0.3548 |
|
|
1983 |
2347.2 |
-1.4686 |
|
|
1984 |
2495.4 |
-1.1112 |
|
|
1985 |
2945.4 |
-0.0259 |
|
|
1986 |
2609.7 |
-0.8355 |
|
|
1987 |
3009.7 |
0.1292 |
|
|
1988 |
2723.4 |
-0.5613 |
-0.517 |
|
1989 |
2765.6 |
-0.4595 |
|
|
1990 |
2728.5 |
-0.5489 |
|
|
1991 |
2661.9 |
-0.7096 |
|
|
1992 |
2896.5 |
-0.1438 |
|
|
1993 |
2511.3 |
-1.0728 |
|
|
1994 |
2904.6 |
-0.1243 |
|
|
1995 |
3649.7 |
1.6728 |
1.192 |
|
1996 |
3215.3 |
0.6251 |
|
|
1997 |
3486.8 |
1.2799 |
|
|
1998 |
2911.5 |
-0.1076 |
|
|
1999 |
3003.5 |
0.1143 |
0.746 |
|
2000 |
3663.4 |
1.7058 |
|
|
2001 |
3130.0 |
0.4194 |
|
|
2002 |
2697.8 |
-0.6230 |
-0.503 |
|
2003 |
2657.7 |
-0.7197 |
|
|
2004 |
2886.1 |
-0.1689 |
|
|
2005 |
3771.0 |
1.9653 |
|
|
2006 |
2893.5 |
-0.1510 |
|
|
2007 |
3428.2 |
1.1385 |
|
|
2008 |
2886.9 |
-0.1669 |
-0.601 |
|
2009 |
2527.1 |
-1.0347 |
|
|
2010 |
3071.7 |
0.2787 |
1.41 |
|
2011 |
3487.8 |
1.2823 |
|
|
2012 |
4062.7 |
2.6689 |
|
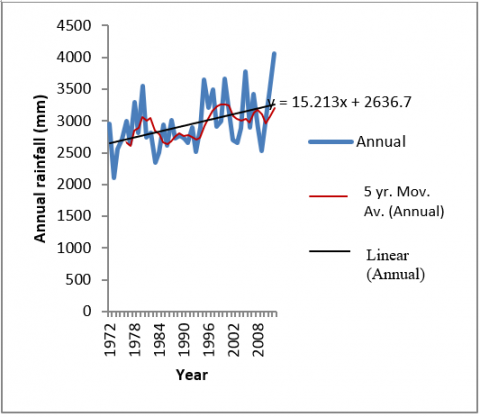
Figure 2 is the least squares composite graph of the annual rainfall regime for Calabar during the interval of analysis. It shows the trend line (in black) and the smoothened-out curve with 5 years moving average (in red). The actual inter-annual variation curve is depicted in blue. The rainfall trend is statistically defined by the function $Y=15.21 x+2636$, which indicates an increasing rate of 15.21 mm per year with the coefficient of determination of 0.193 that is suggestive of weak correlation. This invariably translates to inconsequential upward trend in annual rainfall amount. This trend result is consonance with those [5, 6, 31] that identified non-significant increasing trend in Calabar rainfall during the intervals of their studies. The results are also in agreement with the paper [32] that observed non-significant upward trends in rainfall in some cities in the neighbouring Akwa Ibom State, southeastern Nigeria.
Figure 3 is the plot of annual rainfall fluctuations in terms of SPI values. The figure reveals that dry spell dominated the earlier part of the period (1972-1994) while wet spell dominated the later part of the interval (1995-2012), sandwiched with some dry spells. 36.59% of the period recorded positive SPI (wet spells) while 63.41% of the period recorded negative SPI (drought periods). These results show that Calabar is prone to extreme rainfall events (flooding and drought) associated with high risks. Hence there is the need for monitoring Calabar annual rainfall to guarantee timely warning and emergency response to assist the populace in the run-in to the manifestation of these events to avert danger and large-scale socio-economic losses.
Figure 2. Least squares regression composite graph of the annual rainfall
Figure 3. Annual rainfall fluctuation plot over the period under review
Figure 4. Comparative bar chart of annual rainfall amount during the period
Figure 5. Intra-annual variation of Calabar rainfall
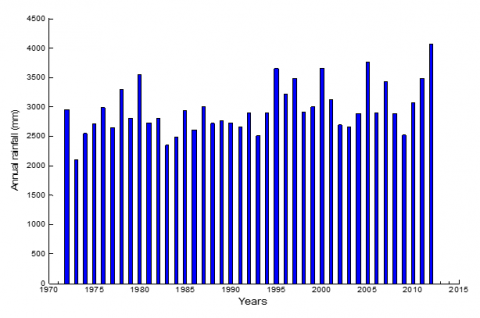
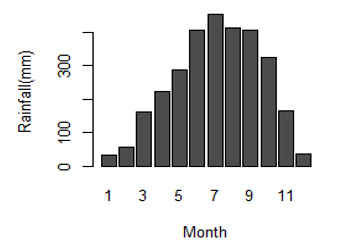
Figure 4 is the comparative bar chart showing annual rainfall amounts of the individual years. The figure shows that the highest annual rainfall amount was recorded in 2012 and the lowest in 1973 in complete agreement with Table 5. The intra-annual rainfall trend shown in Figure 5 indicates that Calabar rainfall annual cycle is characterized by the following features: a distinct summer maximum with over 60% of the annual total occurring from June to September; a unimodal maximum in July; a period of low rainfall between December and February; a period of high rainfall between April and October; transition periods in March and November. Monthly rainfall totals exceed 150 mm from March to November. The findings show that Calabar is vulnerable to droughts and floods as products of climatic variability. The findings in this study are consistent with those [3] for the likelihood of droughts occurring in the mangrove agro-ecological zone of Nigeria and Ukhurebor, Abiodun [11] that observed existence of rainfall variability that calls for concern in South-South region of Nigeria where Calabar is located. The frequency of these climate variability events over most tropical continents are modulated by the ENSO cycle. Droughts are associated with warm phases of ENSO. Nevertheless, persistence severe droughts involve combinations of several mechanisms: random fluctuations in atmospheric circulations appear to initiate and terminate many of the droughts on seasonal to annual time scales and sustain them over long periods by biospheric positive feedback; changes in summer monsoon circulation may cause a delay or outright failure of moist tropical incursions in West Africa sub-region where Calabar is located.
Water has a central role to play in climate change adaptation and is critical for the achievement of the 2030 agenda for sustainable development. The frequency and intensity of droughts and floods as depicted in the results constitute a major challenge to water resources management. Climate change and concomitant frequent droughts have the tendency to exacerbate water problems in the area through the alteration of the spatio-temporal characteristics of temperature and rainfall. Crop damage, water shortages, settlement destabilization and water quality problems are typical outcomes of droughts and floods. These would produce cumulative effect on food security which is atop local priority in different parts of Nigeria as the country aims at achieving self-sufficiency in food production. Prolonged dry spells will lead to increased accumulation of air pollutants and their residence times. Also, severe droughts are sufficient to dry the soil’s upper layers and cause reasonable quantities of the top soil to be blown away into the atmosphere and irreversibly lost. On the other hand, prolonged wet spells will bring about an increase in the frequency and intensity of rainfall events with the attendant sea level rise and subsequent increase in the intrusions of salt water into the coastal aquifers. This will adversely affect the quality of groundwater aquifers, ultimately reduces the amount of freshwater available for use and throws up a challenge for water resources management. Providing timely weather and climate information has become a critical tool for planning in the key sectors of the economy that are climate-sensitive such as water resources. Oftentimes, the traditional methods of coping with drought and flood disasters fail on account of uncertainties linked to climate change and variability which is a fundamental challenge that ought to be addressed in order to ensure sustainable water resources management. The results presented in this study are a clear demonstration that knowledge of the vulnerability of a locality’s rainfall to climate variability is a critical factor in water resources management scheme. Such knowledge provides insight into the water resources dynamics of a locality including drought monitoring, drought vulnerability information, warnings and forecasts. All these are crucial for a long-term, efficient and result-oriented water resources development and management strategy. Hence, there is is the need for sensitization of the stakeholders in the water resources management and the populace on the nexus between rainfall variability and water resources management, and the need for articulated measures for improved productivity in the sub-sector.
There is non-significant trend in annual rainfall and existence of high inter-annual rainfall variability in Calabar from 1972-2012. There is very weak correlation between Calabar annual rainfall and the years for the period of analysis. Calabar is prone to extreme rainfall variability that would nevertheless occasionally manifest in severe flooding and drought with diverse consequences. The SPI analysis shows that the drought years constitute 63.41% while wet years constitute 36.59% of the 1972-2012 period. This translates to the fact that occasions where $\text { PSI }<0$ (63.41%) exceeds occasions where $P S I \geq 0$ (36.59%). The study indicates that Calabar has high probability for drought events on year-to-year basis. The observed transitions from wet spells to dry spells and vice versa in Calabar are most likely the products of local atmospheric variations and teleconnection influences, notably ENSO and South Atlantic SSTA. The 1973 and 1983 SPI values are suggestive of strong negative correlation between Calabar rainfall and intense ENSO events. The combined effects of these phenomena induce wind flow variations that are either favourable or unfavourable to precipitation formation in the area. Effective public policy formulation and reforms are required in water resources sector. Principally, it requires a shift from traditional qualitative approach to quantitative, data-driven approach to policy making involving evidence from scientific data. This is because the impacts of anthropogenic development and frequent droughts, nay climatic variability events have serious implications for management of water resources. Input from scientific data should serve as a base for identifying possible gaps between policy formulation and genuine implementation. This would ensure the right policy framework in water resources which is a fundamental requirement for efficient service delivery in a bid to achieve effective and sustainable development in the sub-sector.
For further research on the subject in the study area, it is strongly recommended that: (1) an integrated impact study be carried out to examine the diverse consequences of extreme rainfall variability in Calabar. (2) There is the need to develop a method of drought and flood prediction in the area based on past experiences and environmental condition. The need for continuous monitoring of Calabar annual rainfall is advocated to ensure timely warning alerts and quick responses to avert the dangers associated with severe rainfall variability. Besides, provision of a framework for climate information gathering, dissemination and management would guarantee quality prediction and swift response in project designs for integrated water resources management.
|
σ |
Standard deviation, mm |
|
C.V |
Coefficient of variation, a dimensionless quantity, % |
|
SPI |
Standardized precipitation index |
[1] Camberlin, P., Janicot, S., Poccard, I. (2001). Seasonality and atmospheric dynamics of the teleconnection between African rainfall and tropical sea surface temperature: Atlantic vs ENSO. Int. J. Climatol., 21(8): 973-1005. http://doi.org/10.1002/joc.673
[2] Vincente-Serrano, S.M. (2006). Spatial and temporal analysis of droughts in the Iberian Peninsula (1910-2000). Hydrological Sciences Journal, 51(1): 83-97. http://doi.org/10.1623/hysj.51.1.83
[3] NIMET. (2008). Nigerian Climate Review Bulletin 2007. NIMET No: 001, February, 2008.
[4] Oguntunde, P.G., Abiodun, B.J., Lischeid, G. (2011). Rainfall trends in Nigeria, 1901-2000. Journal of Hydrology, 411(3-4): 207-218. http://doi.org/10.1016/j.jhydrol.2011.09.037
[5] Amadi, S.O., Udo, S.O., Ewona, I.O. (2014). Spatio-temporal variations of monthly rainfall total in Nigeria for the period 1950-2012. International Journal of Pure and Applied Physics, 10(1): 75-93.
[6] Ewona, I.O., Udo, S.O. (2009). Seasonal long-term rainfall trend in Calabar, Nigeria. Global Journal of Pure and Applied Sciences, 15(2): 241-245. http://dx.doi.org/10.4314/gjpas.v15i2.45391
[7] Souza, E.B., Kayano, M.T., Ambrizzi, T. (2005). Intraseasonal and submonthly variability within autmn rainy regime over the eastern Amazon/northeast Brazil and associated mechanisms. Theoretical and Applied Climatology, 81: 177-191. http://dx.doi.org/10.1007/s00704-004-0081-4
[8] Amorim, A.C.B., Chaves, R.R., Silva, C.M.S. (2014). Influence of the tropical Atlantic Ocean’s sea surface temperature in the eastern northeast Brazil precipitation. Atmospheric and Climate Sciences, 4(5): 874-883. https://doi.org/10.4236/acs.2014.45077
[9] Oloruntade, A.J., Mohammad, T.A., Aimrun, W. (2017). Rainfall trends in the Niger-South Basin, Nigeria, 1948-2008. Pertanika J. Sci & Technol., 25(2): 479-496.
[10] Oloruntade, A.J., Mogaji, K.O., Imoukhuede, O.B. (2018). Rainfall trend and variability over Onitsha, Nigeria. Ruhuna Journal of Science, 9(2): 127-139. http://dx.doi.org/10.4038/rjs.v9i2.40
[11] Ukhurebor, K.E., Abiodun, I.C. (2018). Variation in annual rainfall data of forty years (1978-2017) for South-South Nigeria. Journal of Applied Sciences and Environmental Management, 22(4): 511-518. http://dx.doi.org/10.4314/jasem.v22i4.13
[12] Wilhite, D.A., Glantz, M.H. (1987). Understanding the drought phenomenon: The role of drought definitions. In: Wilhite, D.A., Easterling, WE. (eds). Planning for Drought Towards a Reduction of Societal Vulnerability. Westview Press, Boulder Colorado, pp. 11-27.
[13] World Meteorological Organisation (WMO) and Global Water Partnership (GWP). (2016). Handbook of Drought Indicators and Indices (M. Svoboda and B. A. Fuchs). Integrated Drought Management Programme (IDMP), World Meteorological Organisation (WMO) No. 1173.
[14] Sirdaş, S., Sen, Z. (2003). Spatio-temporal drought analysis in the Trakya region, Turkey. Hydrological Sciences Journal, 48(5): 809-820. http://dx.doi.org/10.1623/hysj.48.5.809.51458
[15] Hayes, M., Svoboda, M., Wall, N., Widhalm, M. (2011). The Lincoln declaration on drought indices: universal meteorological drought index recommended. Bulletin of the American Meteorological Society, 92(4): 485-488. http://dx.doi.org/10.1175/2010BAMS3103.1
[16] McKee, T.B., Doesken, N.J., Kleist, J. (1993). The relationship of drought frequency and duration to time scales. In: 8th Conference on Applied Climatology, Anaheim, California, U.S.A., pp. 179-184.
[17] Keyantash, J., Dracup, J.A. (2002). The quantification of drought: An evaluation of drought indices. Bulletin of the American Meteorological Society, 83(8): 1167-1180. https://doi.org/10.1175/1520-0477-83.8.1167
[18] McKee, T.B., Doesken, N.J., Kleist, J. (1995). Drought monitoring with multiple time scales. In: Preprints, 9th Conference on Applied Climatology, Dallas, Texas, U.S.A., pp. 233-236.
[19] Agnew, C.T. (2000). Using SPI to identify drought. Drought Network News, 12: 6-12.
[20] Simsek, O., Cakmak, B. (2010). Drought analysis for 2007-2008 agricultural year of Turkey. Journal of Tekirdag Agricultural Faculty, 7(3): 99-109.
[21] Afangideh, A.I., Okpiliya, F.E., Eja, E.I. (2010). A preliminary investigation into the annual rainfall trends and patterns for selected towns in parts of South Eastern Nigeria. Journal of Sustainable Development, 3(3): 275-282. https://doi.org/10.5539/jsd.v3n3p275
[22] Bibi, U.M., Kaduk, J., Balzter, H. (2014). Spatial-temporal variations of rainfall in Northeastern Nigeria. Climate, 2: 206-222.
[23] Durlo, G. (2006). Multiannual variations of effective sunshine duration in Beskid Sadecki Mountains. Electronic Journal of Polish Agricultural Universities, 9(4).
[24] Liu, X.D, Yin, Z.Y., Shao, X.M., Qin, N.S. (2006). Temporal trends and variability of daily maximum and minimum extreme temperature events and growing seasons length over the eastern and central Tibetan Plateau during 1961-2003. Journal of Geophysical Research, 111: D19109. http://dx.doi.org/10.1029/2005JD006915
[25] Turkes, M., Sumer, U.M., Demir, I. (2002). Re-evaluation of trends and changes in mean, maximum and minimum temperatures of Turkey for the period 1929-1999. International Journal of Climatology, 22: 947-977. https://doi.org/10.1002/joc.777
[26] Gil-Alana, L.A. (2008). Warming break trends and fractional integration in the northern, southern and global temperature anomaly series. Journal of Atmospheric and Oceanic Technology, 25(4): 570-578. https://doi.org/10.1175/2007JTECHA1025.1
[27] Zhang, Z.H., Liu, R.L., Hui, Q., Chen, J., Zhang, X.D. (2013). Analysis of rainfall variation over the past 55 years in Guyuan City, China. Journal of Environmental Science, Computer Science and Engineering Technology, 2(3): 640-649.
[28] McGregor, G.R., Nieuwolt, S. (1998). Topical Climatology, 2nd edtion, John Wiley and Sons Ltd, England, p. 352.
[29] Kiladis, G.N., Diaz, H.F. (1989). Global climate anomalies associated with extremes in the Southern Oscillation. Journal of Climate, 2: 1069-1090. https://doi.org/10.1175/1520-0442(1989)002<1069:GCAAWE>2.0.CO;2
[30] Bigg, G.R. (1995). The El Nino event of 1991-94. Weather, 50(4): 117-123.
[31] Obot, N.I., Chendo, M.A.C., Udo, S.O., Ewona, I.O. (2010). Evaluation of rainfall trends in Nigeria for 30 years (1978-2007). International Journal of Physical Sciences, 5(14): 2217-2222.
[32] Udo-Inyang, U.C., Edem, I.D. (2012). Analysis of rainfall trends in Akwa Ibom State, Nigeria. Journal of Environment and Earth Sciences, 2(8): 60-70.