Abhishek Agarwal* | Linda Mthembu
© 2022 IIETA. This article is published by IIETA and is licensed under the CC BY 4.0 license (http://creativecommons.org/licenses/by/4.0/).
OPEN ACCESS
One of the essential purposes of the automotive chassis is to maintain the vehicle's shape and bear the various loads applied to the vehicle. When a heavy-duty vehicle, e.g., a truck, travels on the road, the chassis is subject to vibrations produced by surface roughness and excitation due to the vibration of body parts. The present study aims to design, model, and perform a static structural & vibrational modal analysis on a commercial vehicle (Truck) chassis considering both conventional Structural steel and P100/6061 Al Metal Metrix Composite (MMC) using ANSYS CFX to determine the strength of chassis with transverse sections. Free vibrational modal analysis determines the mass participation factor and resonance frequency for square section and C section, respectively, for both materials using the finite element technique. It was observed that the use of the C section causes an increase in deformation for all the natural frequencies, which is not preferred. The high mass participation factor along the x-direction signifies that any external excitation along this direction would likely cause resonance and amplitude build-up. The C section profile of the chassis shows 1.69% higher deformation than the square section in both cases; hence it is not desirable for the design.
heavy vehicle chassis (HVC), stress, deformation, MMC, vibration, frequency, mode shape
Commercial vehicles such as trucks, trailers, and semi-trailers have ladder chassis. They generally consist of two beams arranged parallel to the longitudinal axis of the frame and a plurality of transverse beams arranged laterally between the beams. Therefore, the axles, as well as the power plant, the driver's cab, and the platform or other structures are easy to repair. In ladder chassis, the side elements of the lead frames generally consist of open channels which are very effective in providing bending stiffness, but manufacturers prefer the side elements of the channel section because of the cost and the simple construction. Crossbars often consist of rectangular hollow profiles, channels, cylinders, or I-shaped profiles. Rectangular hollow profiles offer effective bending and torsional rigidity but can lead to an overall high torsional rigidity of the frame. The most flexible frame construction would have cross-sectional elements with an open section attached to the dies of the side elements by endplates. The ladder frame comprises two symmetrical beams and cross beams along the entire length of the vehicle [1]. Various investigations considered the enhancement of the chassis frame with its proper conditions in the main & central part of the vehicle which can be utilized to foster how the frame design can be improved by utilizing various methodology & structural analyses including the use of design techniques & simulation software [2-5]. Bhat and Katore [6] have analysed tractor chassis by changing the cross-section from "C" to "I" made from mild steel. The findings have shown that nearly 31.79Kg of weight is reduced by changing cross-section type while keeping the other dimension the same as before. Reddy, C.M.M. and Reddy, M.L.K. [7] investigated container frame modelling and analysis using the FEM to improve load capacity and reduce frame failure when folding by adding stiffeners. Rectangular stiffeners should be placed between the crossbeams and attached to the chassis with screws. The FEA analysis has predicted a 37.11% reduction of stress and a 36.23% reduction of stress intensity with the use of stiffeners. Nalawade et al. [8] conducted structural analysis on TATA 407 truck chassis using ANSYS FEA software. The new material used for analysis is E-glass and compared with structural steel. The findings have shown that 60-68% weight reduction is possible using E-glass, the deformation is also within acceptable limits, but the stress generated is higher than steel.
Sharma et al. [9] have conducted static structural analysis on TATA LPS 2515 EX chassis using ANSYS FEA software. The material used for analysis were AISI 4130 alloy steel and ASTM A710 STEEL GRADE A (CLASS III) and the cross-section analysed for chassis were B type, C type, I type. The findings have shown that the best material for this application is AISI 4130 steel which is lighter than other materials. The box channel shape cross-section exhibits higher durability and lower deformation therefore it’s best suited for the chassis design of heavy trucks. Swami and Tuljapure [10] conducted static structural analysis on Eicher 20 chassis frame with C shape cross-section using ANSYS FEA software. The findings have shown that the thickness of cross members affects the equivalent stress generated. The equivalent stress increases up to a certain limit with an increase in-side member thickness and then decreases. Singh et al. [11] have conducted FEA analysis on TATA LP 912 chassis using Altair Hyper work software. The material used for analysis was alloy steel and the cross-section used was C type, I type, rectangular box (solid), rectangular box (hollow). The findings have shown that the rectangular (solid) section is more robust than other types of cross-sections.
Godse and Patel [12] have conducted static structural analysis on the TATA axle frame using ANSYS FEA software. The existing design was further optimized with increased thickness and reinforcements. The findings have shown that conventional design generated stress of 37.04 N/mm2 and optimized design generated 22.97 N/mm2, thus a considerable reduction in stress is achieved by increasing thickness and using reinforcements. Nora et al. [13] have conducted static structural analysis on a 35-ton trailer to determine maximum deformation and stress. The FEA results obtained were in close agreement with analytical results concerning the position of maximum deformation and maximum tension.
As an automotive trip along the way, its chassis is excited by dynamic forces caused by the road roughness and parts mounted on it. Under such a variety of dynamic excitations, the automotive chassis starts to vibrate [14]. Every time the natural frequency of vibration of a machine or structure concurs with the frequency of the exterior excitation, there arises a fact which is called “resonance”, which leads to excessive deflections and failure of the component. It is then vital to examine the free vibration characteristics of an automotive chassis to determine natural frequency and mode shape. The mode shapes of an automotive chassis at certain natural frequencies are very critical to determine the mounting point of the different components like engine, suspension, transmission, etc including other integral and body parts. Inclusion of the dynamic effects in designing the chassis is a primary quality work that leads to comfort & safety [15]. da Silva et al. [16] performed the experimental modal analysis on a prototype chassis of an off-road vehicle. The LI method was used to classify the basic parameters using FEM enabling the creation of flexible multi-body modeling. Asker et al. [17] conducted static and vibrational analysis on Standard Truck Chassis using ANSYS software. The analysis was conducted to determine stress intensity and vibration mode shapes during ramping of a block. The numerical results have shown that FEA can be used to determine bending and torsional stresses on vehicle frames with reasonable accuracy.
The design structure and used material of the chassis structure significantly affect its strength and weight [18]. Automotive chassis or frames are manufactured from steel and hold the entire body and engine part of an automotive vehicle [19]. Although steel is the primary choice of the manufacturers because of its low cost, considerable relative strength, and ductileness there are several composite materials [20] that offer proper strength and modulus better than any conventional metallic metals [19, 21-23]. Composite materials [20], with their distinctive combination of high stiffness and low CTE, offer the essential physical attributes of lightweight and durable structures [20]. Generous advancement in the improvement of light metal matrix composites has been accomplished in late many years, with the goal that they could be brought into the main applications. Particularly in the automotive business, MMCs have been utilized in fiber-reinforced pistons and Al crankcases with fortified chamber surfaces [24]. Agarwal et al. [25] investigated the application of Al MMC material for ATV disk brakes in automotive using experimental and numerical techniques. The results have shown that disk brakes made from Al MMC possess better heat transfer characteristics as compared to conventional ones. The material selection includes the prerequisite of high strength and good corrosion resistance aluminum alloys for the matrix composite materials [26].
The findings presented here, are part of a detailed research study and the present research work is different from the literature in respect to modeling, design, and optimization analysis of heavy vehicle chassis for numerous effects of stress distribution with different materials. The appropriate data of an existing heavy-duty truck chassis of TATA company’s model number 1612 (St52 E=2.10 x 10⁵ N / mm2) as a simply supported beam with an overhang ladder frame is taken for design and analysis with the Sidebar of the chassis made from ‘C’ Channels having dimensions 116mm x 25mm x 5 mm [27]. The total load acting on the chassis is 257022N [28]. Rawal [20] presented the detailed properties of P100/6061 Al MMC which shows good adaptability towards automotive application with a density of 2.5 gm/cm3, Youngs Modulus (x) (GPa)342.5, Youngs Modulus (y) (GPa) 35.4, Thermal Conductivity Kx (W/m-K) 320.0.
The CAD modeling and FE simulation are conducted using ANSYS software. In the present work a static structural analysis is presented in subsections 3.1 and 3.2; indicating the equivalent stress and total deformation of the TATA 1612 chassis followed by a detailed modal analysis using conventional steel material and P100/6061 Al MMC.
Natural frequencies, mode shapes, and mode participation factors are determined by the modal analysis presented in sub-section 3.3. The highest vibration is found in natural frequencies, which we try to avoid as much as possible. As a result, we can learn about the frequencies at which the system is prone to vibration. We usually try to modify the structure to shift the natural frequencies out of the range of excitation frequencies if the natural frequencies are within the range of excitation frequencies after modal analysis.
The mode shapes depict how the structure deforms when subjected to various natural frequencies. The mode shapes would tell us which regions would be subject to high stresses if the deformed shape was similar to the mode shape. This is advantageous because we don't want the joint regions to be overstressed. After all, it may reduce the fatigue life of the structure. In addition, the mode participation factors show which modes are the most exciting. The effective masses indicate which modes should be included in dynamic simulations (frequency response or transient dynamic). These data will be useful later when performing forced vibration.
The mass participation factor, natural frequency, and mode shapes are evaluated for the C-type and square sections of the chassis using both materials. Recommendations are made based on the findings to improve the static and dynamic behavior of the truck chassis by changing the geometrical dimensions and structural properties. The study helps to provide the necessary information for reducing vibration, improving strength, and optimizing the weight of the truck chassis.
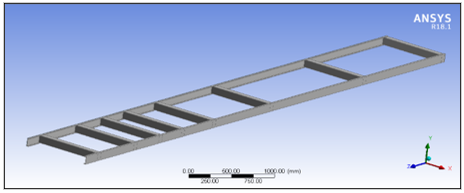
The methodology involves Finite Element Analysis of chassis followed by static structural analysis & modal analysis using conventional steel material and P100/6061 Al MMC. The comparison is made by considering the C-type section as well as the square section of the chassis. The nature of simulation used in research is static structural type. The version of the 120 simulation package is ANSYS V18.1. The interaction with software is through the graphical user 121 interfaces (GUI). The FEA simulation conditions are the same as experimental testing conditions. The CAD model of chassis is developed in ANSYS design modeler using extrude and sketch tool. The developed CAD model is shown in Figure 1.
Figure 1. CAD modeling of HMV chassis
The subsequent process involves defining optimization variables i.e., cross member 1, cross member 2, and cross member 3 as shown in Figure 2. All the three dimensions selected for optimization are of the linear type and each has a length of 65mm.
Figure 2. Variable assignment
The chassis design is discretized using tetrahedral elements with a growth rate set to 1.2, inflation set to normal, and the number of layers set to 5. The number of elements generated is 20080 and the number of nodes generated is 42840. As indicated earlier the ladder-type chassis frame selected for the study is Tata heavy-duty truck model 1612 in which the sidebar of the chassis is made from “C” Channels with116mm x25mm x5 mm made of structural steel (St52E=2.10 x 10⁵ N / mm2) simply clamp with Shock Absorber and Leaf Spring [29].
Finite Element simulation is conducted on chassis to determine stresses and deformations in C-type section as well as the square section of the chassis and sung the conventional structural steel as well as P100/6061 Al MMC respectively.
3.1 Equivalent stress comparison in different cross-sections
3.1.1 Using conventional structural steel material (St52E)
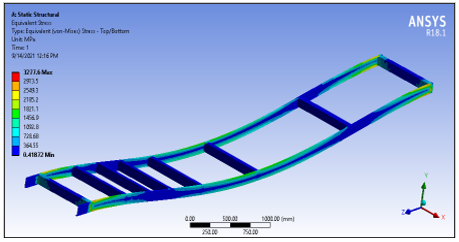
From the static structural analysis, equivalent stress plots and total defamation plots are generated for the square section and C section profile of the chassis as shown in Figure 3 and Figure 4 respectively.
From the equivalent stress plot, it is evident that the square section chassis profile has lower equivalent stress as compared to the C section chassis profile. The equivalent stress observed for square-section chassis is 3280MPa and the equivalent stress observed for C section profile is 10533MPa.
Figure 3. Eq. stress using square section in case of St52E
Figure 4. Eq. stress using C section in case of St52E
3.1.2 Cross sections using P100/6061 Al MMC
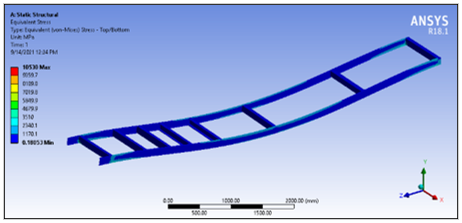
From the equivalent stress plot of P100/6061 Al MMC material, it is evident that the square section chassis profile has lower equivalent stress as compared to the C section chassis profile as shown in Figure 5 and Figure 6 respectively.
Figure 5. Eq. stress using square section in case of P100/6061 Al MMC
Figure 6. Eq. stress using C section in case of P100/6061 Al MMC
The equivalent stress observed for square-section chassis is 3277.6MPa and the equivalent stress observed for C section profile is 10530MPa.
3.2 Total deformation comparison in different cross-sections
3.2.1 Using conventional structural steel material (St52E)
The maximum deformation plots in the case of St52E are obtained for both the square section profile and C section profile of the chassis as shown in Figure 7 and Figure 8.
The C-profile chassis has higher deformation of 446.6mm and the square profile chassis has lower deformation of 347.45mm due to high stiffness which increases the resistance of the lateral load.
Figure 7. Total deformation using square section in case of St52E
Figure 8. Total deformation using C section in case of St52E
3.2.2 Using P100/6061 Al MMC
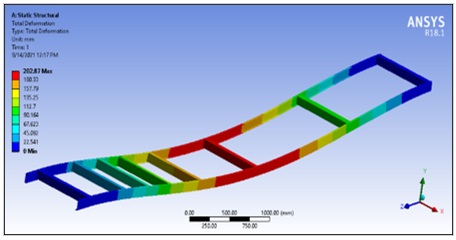
The maximum deformation plots in the case of P100/6061 Al MMC are obtained for both square section profile and C section profile of chassis as shown in Figure 9 and Figure 10.
Figure 9. Deformation using square section in case of P100/6061 Al MMC
Figure 10. Deformation using C section in case of P100/6061 Al MMC
The C-profile chassis has higher deformation of 260.85mm and the square profile chassis has lower deformation of 202.87mm due to high stiffness which increases the resistance of the lateral load. Output parameters for square section results are shown in Figure 11.
Figure 11. Output parameters for square section results
The equivalent stress is maximum for St52E material with the magnitude of 3280.5MPa and is lower for material matrix composite chassis. The P100/6061 Al MMC has lower equivalent stress of 3277.6MPa. Output parameters for C section results are shown in Figure 12.
Figure 12. Output parameters for C section results
3.3 Vibration analysis
The free vibration analysis is conducted on the chassis to determine natural frequencies and mode shapes. This analysis would aid to determine the resonant frequency and mass participation factor in each direction.
3.3.1 Modal analysis of square section using St52E material
The mode shapes and natural frequencies are determined by keeping similar loading conditions as in structural analysis. The mode shapes are shown in Figures 13 to 18.
Figure 13. Mode shape of 1st natural frequency
The 1st frequency mode shape is shown in Figure 13. The mode shape shows a lateral mode shape with a magnitude of 4.13mm and a natural frequency of 6.89Hz. The 2nd frequency mode shape is shown in Figure 14 which shows a transverse type mode shape with maximum deformation of 3.517mm and a frequency of 10.184Hz.
Figure 14. Mode shape of 2nd natural frequency
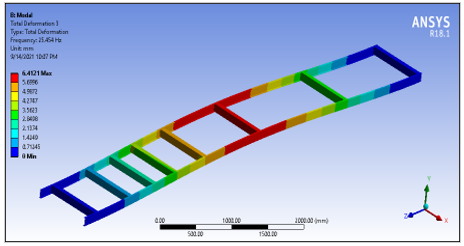
Figure 15. Mode shape of 3rd natural frequency
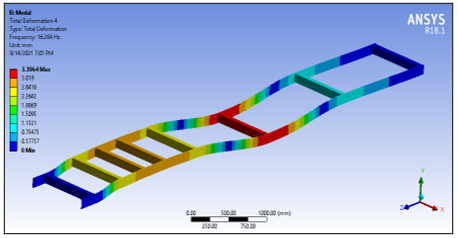
The 4th frequency mode shape is shown in Figure 16 which shows a transverse type mode shape with maximum deformation of 3.39mm and a frequency of 16.284Hz.
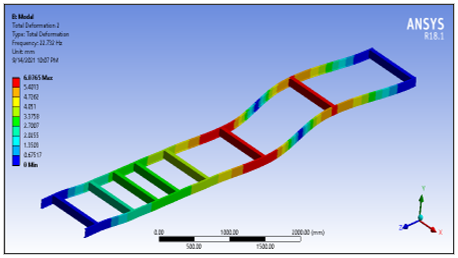
The 5th frequency mode shape is shown in Figure 17 which shows a torsional type mode shape with maximum deformation of 4.69mm and a frequency of 26.211Hz.
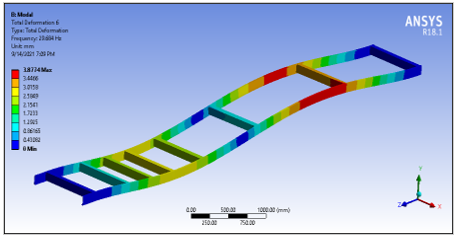
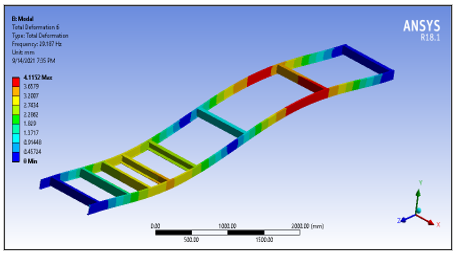
The 6th frequency mode shape is shown in Figure 18 which shows a transverse type mode shape with maximum deformation of 3.87mm and a frequency of 29.684Hz.
Figure 16. Mode shape of 4th natural frequency
Figure 17. Mode shape of 5th natural frequency
Figure 18. Mode shape of 6th natural frequency
The mass participation factor is evaluated for all the directions and the maximum mass participation factor is observed for the translational x-direction i.e., 0.779 as shown in Table 1.
The high mass participation factor along the x-direction signifies that any external excitation along this direction would likely cause resonance and amplitude build-up. The mass participation factor along other directions is low and therefore any excitation along other directions would not cause resonance.
Table 1. Frequency and mass participation factor (St52E)
|
Mode |
Freq. |
Period |
Part |
|
1 |
6.89178 |
0.14510 |
0.34725 |
|
2 |
10.1844 |
0.98190e-01 |
0.15998 |
|
3 |
11.4632 |
0.87235e-01 |
-0.25697e-03 |
|
4 |
16.2836 |
0.61412e-01 |
-0.16079 |
|
5 |
26.2109 |
0.38152e-01 |
-0.15789e-02 |
|
6 |
29.6836 |
0.33689e-01 |
0.58257e-04 |
3.3.2 Modal analysis of square section using P100/6061 Al MMC material
The mode shapes and natural frequencies are determined by keeping similar loading conditions as in structural analysis. The mode shapes are shown in Figures 19 to 24.
Figure 19. Mode shape of 1st natural frequency
The 1st frequency mode shape is shown in Figure 19. The mode shape shows a lateral mode shape with a magnitude of 7.075mm and a natural frequency of 15.284Hz. The 2nd frequency mode shape is shown in Figure 20, which shows a transverse type mode shape with maximum deformation of 6.076mm and a frequency of 22.732Hz.
Figure 20. Mode shape of 2nd natural frequency
The 3rd frequency mode shape is shown in Figure 21. The mode shape shows a lateral mode shape with a magnitude of 6.412mm and a natural frequency of 25.454Hz.
Figure 21. Mode shape of 3rd natural frequency
The 4th frequency mode shape is shown in Figure 22, which shows a transverse type mode shape with maximum deformation of 5.781mm and a frequency of 36.505Hz.
Figure 22. Mode shape of 4th natural frequency
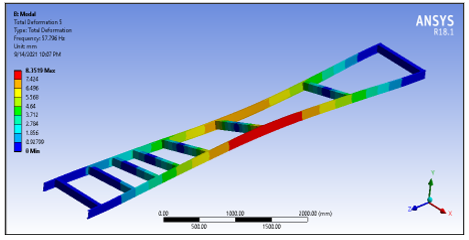
The 5th frequency mode shape is shown in Figure 23 which shows a torsional type mode shape with maximum deformation of 8.35mm and a frequency of 57.796Hz.
Figure 23. Mode shape of 5th natural frequency
The 6th frequency mode shape is shown in Figure 24 which shows a transverse type mode shape with maximum deformation of 6.87mm and a frequency of 66.2Hz.
Figure 24. Mode shape of 6th natural frequency
Table 2. Freq. and mass participation factor (P100/6061 Al)
|
Mode |
Frequency |
Period |
Part Factor |
|
1 |
15.2840 |
0.65428E-01 |
0.20252 |
|
2 |
22.7317 |
0.43991E-01 |
0.91758E-01 |
|
3 |
25.4542 |
0.39286E-01 |
0.60460E-05 |
|
4 |
36.5053 |
0.27393E-01 |
-0.93704E-01 |
|
5 |
57.7959 |
0.17302E-01 |
-0.90971E-03 |
|
6 |
66.1998 |
0.15106E-01 |
-0.14074E-03 |
The mass participation factor is evaluated for all the directions and the maximum mass participation factor is observed for the translational x-direction i.e., 0.7821 as shown in Table 2.
The high mass participation factor along the x-direction signifies that any external excitation along this direction would likely cause resonance and amplitude build-up. The mass participation factor along other directions is low and therefore any excitation along other directions would not cause resonance.
3.3.3 Modal analysis of C section using St52E material
The mode shapes and natural frequencies are determined by keeping similar loading conditions as in structural analysis. The mode shapes are shown in Figures 25 to 30 below.
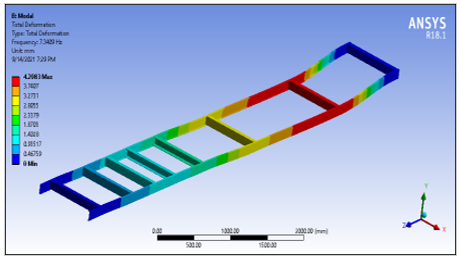
Figure 25. Mode shape of 1st natural frequency
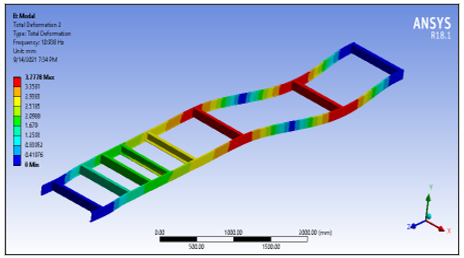
The 1st frequency mode shape is shown in Figure 25. The mode shape shows a lateral mode shape with a magnitude of 4.208mm and a natural frequency of 7.34Hz. The 2nd frequency mode shape is shown in Figure 26 which shows a transverse type mode shape with maximum deformation of 3.777mm and a frequency of 10.938Hz.
Figure 26. Mode shape of 2nd natural frequency
The 3rd frequency mode shape is shown in Figure 27. The mode shape shows a lateral mode shape with a magnitude of 3.982mm and a natural frequency of 11.105Hz.
Figure 27. Mode shape of 3rd natural frequency
The 4th frequency mode shape is shown in Figure 28 which shows a transverse type mode shape with maximum deformation of 4.83mm and a frequency of 14.29Hz.
Figure 28. Mode shape of 4th natural frequency
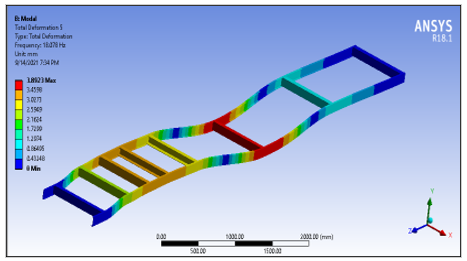
The 5th frequency mode shape is shown in Figure 29 which shows a torsional type mode shape with maximum deformation of 3.89mm and a frequency of 18.078Hz.
Figure 29. Mode shape of 5th natural frequency
The 6th frequency mode shape is shown in Figure 30 which shows a transverse type mode shape with maximum deformation of 4.11mm and a frequency of 29.187Hz.
Figure 30. Mode shape of 6th natural frequency
The mass participation factor is evaluated for all the directions and the maximum mass participation factor is observed for the translational x-direction i.e., 0.764 as shown in Table 3. The high mass participation factor along the x-direction signifies that any external excitation along this direction would likely cause resonance and amplitude build-up. The mass participation factor along other directions is low and therefore any excitation along other directions would not cause resonance.
Table 3. C-section frequency and mass participation St52E
|
Mode |
Frequency |
Period |
Part Factor |
|
1 |
7.34092 |
0.13622 |
0.33119 |
|
2 |
10.9382 |
0.91422e-01 |
-0.11553 |
|
3 |
11.1048 |
0.90051e-01 |
-0.66910e-02 |
|
4 |
14.2901 |
0.69978e-01 |
-0.78883e-02 |
|
5 |
18.0784 |
0.55315e-01 |
-0.13138 |
|
6 |
29.1869 |
0.34262e-01 |
0.26419e-03 |
3.3.4 Modal analysis of C section using P100/6061 Al MMC
The mode shapes and natural frequencies are determined by keeping similar loading conditions as in structural analysis. The mode shapes are shown in Figures 31 to 36 below.
Figure 31. Mode shape of 1st natural frequency
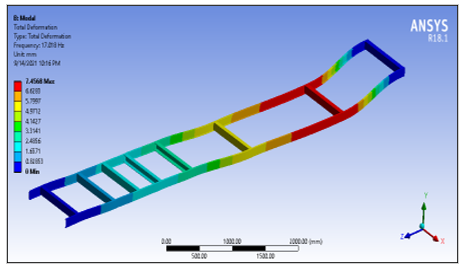
The 1st frequency mode shape is shown in Figure 31. The mode shape shows a lateral mode shape with a magnitude of 7.456mm and a natural frequency of 17.018Hz. The 2nd frequency mode shape is shown in Figure 32, which shows a transverse type mode shape with maximum deformation of 6.694mm and a frequency of 25.358Hz.
Figure 32. Mode shape of 2nd natural frequency
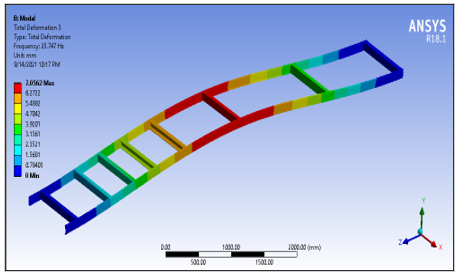
The 3rd frequency mode shape is shown in Figure 33. The mode shape shows a lateral mode shape with a magnitude of 7.056mm and a natural frequency of 25.747Hz.
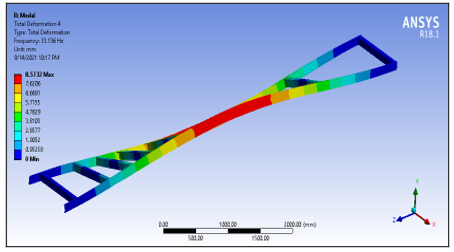
The 4th frequency mode shape is shown in Figure 34 which shows a torsional type mode shape with maximum deformation of 8.573mm and a frequency of 33.136Hz.
The 5th frequency mode shape is shown in Figure 35, which shows a torsional type mode shape with maximum deformation of 6.89mm and a frequency of 41.909Hz.
The 6th frequency mode shape is shown in Figure 36 which shows a transverse type mode shape with maximum deformation of 7.292mm and a frequency of 67.674Hz.
Figure 33. Mode shape of 3rd natural frequency
Figure 34. Mode shape of 4th natural frequency
Figure 35. Mode shape of 5th natural frequency
Figure 36. Mode shape of 6th natural frequency
The mass participation factor is evaluated for all the directions and the maximum mass participation factor is observed for the translational x-direction i.e., 0.7821 as shown in Table 4. The high mass participation factor along the x-direction signifies that any external excitation along this direction would likely cause resonance and amplitude build-up. The mass participation factor along other directions is low and therefore any excitation along other directions would not cause resonance.
Table 4. C-section frequency, mass PF P100/6061 Al
|
Mode |
Freq. |
Period |
Part Factor |
|
1 |
15.2840 |
0.65428e-01 |
0.20252 |
|
2 |
22.7317 |
0.43991e-01 |
0.91758e-01 |
|
3 |
25.4542 |
0.39286e-01 |
0.60460e-05 |
|
4 |
36.5053 |
0.27393e-01 |
-0.93704e-01 |
|
5 |
57.7959 |
0.17302e-01 |
-0.90971e-03 |
|
6 |
66.1998 |
0.15106e-01 |
-0.14074e-03 |
The detailed analysis is conducted to determine the dynamic characteristic e.g., the natural frequencies and the mode shapes of the truck chassis observing the response of the truck chassis under static loading conditions using conventional steel and P100/6061 Al MMC material in both square and C-type section of chassis. The mass participation factor, natural frequency, and mode shapes are evaluated for the square section and C section. The analysis is in close agreement with the experimental testing results.
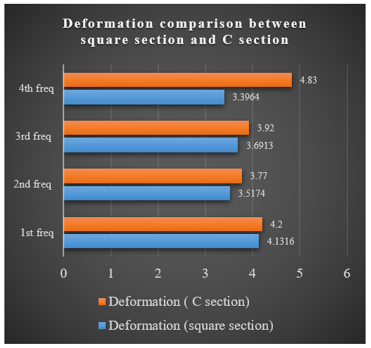
The deformation comparison is made for both the square section and C section as shown in Figure 37. It was observed that the use of the C section causes an increase in deformation for all the natural frequencies which is not desirable. The C section profile of the chassis shows 1.69% higher deformation as compared to the square section.
Figure 37. Deformation comparison between square section and C section
For St52E, P100/6061 Al MMC, the 1st and 5th mode shapes are of torsional type, whereas other mode shapes have transverse mode shapes. The high mass participation factor along the x-direction signifies that any external excitation along this direction would likely cause resonance and amplitude build-up.
The mass participation factor along other directions is low, and therefore any excitation along different directions would not cause resonance. The static structural analysis results have shown higher deformation and stresses for the C section chassis than for the square section.
The structural and vibrational analysis results show that the C profile is not desirable for chassis design. The study can be extended to other suitable Metal matrix composite materials and sections that would help the industry adopt the new concepts and quality improvement. The design of the chassis can further be improved by changing the position of cross members and by changing the orientation of C shape members. The use of filleted structures in the zones of high stress can be investigated further, reducing stress concentration.
[1] Birajdar M.D., Mule, J. (2015). Design modification of ladder chassis frame. International Research Journal of Engineering and Technology, 4(10): 3443-3449
[2] Cavazzuti, M., Baldini, A., Bertocchi, E., Costi, D., Torricelli, E., Moruzzi, P. (2010). High-performance automotive chassis design: A topology optimization-based approach. Structural and Multidisciplinary Optimization, 44(1): 45-56. https://doi.org/10.1007/s00158-010-0578-7
[3] Jasiński, D., Meredith, J., Kirwan, K. (2016). A comprehensive framework for automotive sustainability assessment. Journal of Cleaner Production, 135: 1034-1044. https://doi.org/10.1016/j.jclepro.2016.07.027
[4] Vetrichelvan, G., Sundaram, S., Kumaran, S.S., Velmurugan, P. (2014). An investigation of tool wears using acoustic emission and genetic algorithm. Journal of Vibration and Control, 21(15): 3061-3066. https://doi.org/10.1177/1077546314520835
[5] Tadele, F., Velmurugan, P. (2020). Numerical investigation of frame for human powered flywheel equipped cycle rickshaw. IOP Conference Series: Materials Science and Engineering, 988: 012082. https://doi.org/10.1088/1757-899x/988/1/012082
[6] Bhat, A., Katore, H.V. (2014). The failure analysis of tractor trolley chassis an approach using finite element method - a review. IOSR Journal of Mechanical and Civil Engineering, ICAET-2014, 24-27
[7] Reddy, C.M.M., Reddy, M.L.K. (2014). Modeling and analysis of container chassis using FEM. IOSR Journal of Engineering, 4(1): 34-37. https://doi.org/10.9790/3021-04153437
[8] Nalawade, K.G., Sabu, A., P, B. (2014). Dynamic (vibrational) and static structural analysis of ladder frame. International Journal of Engineering Trends and Technology, 11(2): 93-98. https://doi.org/10.14445/22315381/ijett-v11p218
[9] Sharma, A., Kumar, P., Jabbar, A., Khan, M.M. (2014). Structural analysis of a heavy vehicle chassis made of different alloys by different cross sections. International Journal of Engineering Research & Technology, 3(6): 1778-1785.
[10] Swami, K.I., Tuljapure, S.B. (2014). Analysis of ladder chassis of Eicher 20.16 using FEM. IOSR Journal of Applied Geology and Geophysics, 2(1): 6-13. https://doi.org/10.9790/0990-02110613
[11] Singh, A., Soni, V., Singh, A. (2014). Structural analysis of ladder chassis for higher strength. International Journal of Emerging Technology and Advanced Engineering, 4(2): 253-259.
[12] Godse S., Patel, D.A. (2013). Static load analysis of tata ace ex chassis and stress optimisation using reinforcement technique. International Journal of Engineering Trends and Technology, 4(7): 55-58.
[13] Nor, M.A.M., Rashid, H., Mahyuddin, W.M.F.W., Azlan, M.A.M., Mahmud, J. (2012). Stress analysis of a low loader chassis. Procedia Engineering, 41: 995-1001. https://doi.org/10.1016/j.proeng.2012.07.274
[14] Fui, T.H., Rahman, R.A. (2018). Statics and dynamics structural analysis of a 4.5 ton truck chassis. Jurnal Mekanikal, 24(2). https://jurnalmekanikal.utm.my/index.php/jurnalmekanikal/article/view/162.
[15] Petyt, M., Gardonio, P. (2004). Finite Element Techniques for Structural Vibration. In F. Fahy & J. Walker (Eds.), Advanced Applications in Acoustics, Noise and Vibration. CRC Press. https://doi.org/10.1201/9781315273396
[16] da Silva, M.M., de Oliveira, L.P.R., Ericsson, L.G.S., Neto, Á.C., Varoto, P.S. (2003). An experimental investigation on the modal characteristics of an off-road competition vehicle chassis. SAE Technical Paper Series. https://doi.org/10.4271/2003-01-3689
[17] Asker, H.K., Dawood, T.S., Saeed, A.F. (2012). Stress analysis of standard truck chassis during Ramping on block using finite element method. Journal of Engineering and Applied Sciences, 7(6): 641-648.
[18] Chandra, M.R., Sreenivasulu, S., Hussain, S.A. (2012). Modeling and Structural analysis of heavy vehicle chassis made of polymeric composite material by three different cross sections. International Journal of Modern Engineering Research, 2(4): 2594-2600.
[19] Kang, M., Park, J., Sohn, S.S., Ahn, D.H., Kim, H.S., Cho, W.T., Chin, K.G., Lee, S. (2017). Dynamic tensile behavior of twinning-induced plasticity/low-carbon (TWIP/LC) steel clad sheets bonded by hot rolling. Materials Science and Engineering: A, 700: 387-396. https://doi.org/10.1016/j.msea.2017.06.003
[20] Rawal, S.P. (2001). Metal-matrix composites for space applications. JOM, 53(4): 14-17. https://doi.org/10.1007/s11837-001-0139-z
[21] Jamaati, R., Toroghinejad, M.R., Edris, H., Salmani, M.R. (2014). Comparison of microparticles and nanoparticles effects on the microstructure and mechanical properties of steel-based composite and nanocomposite fabricated via accumulative roll bonding process. Materials & Design (1980-2015), 56: 359-367. https://doi.org/10.1016/j.matdes.2013.11.049
[22] Wang, W., Xu, R., Hao, Y., Wang, Q., Yu, L., Che, Q., Cai, J., Wang, K., Ma, Z. (2018). Corrosion fatigue behavior of friction stir processed interstitial free steel. Journal of Materials Science & Technology, 34(1): 148-156. https://doi.org/10.1016/j.jmst.2017.11.013
[23] Gao, X., Jiang, Z., Wei, D., Jiao, S., Chen, D., Xu, J., Zhang, X., Gong, D. (2014). Effects of temperature and strain rate on microstructure and mechanical properties of high chromium cast iron/low carbon steel bimetal prepared by hot diffusion-compression bonding. Materials & Design, 63: 650-657. https://doi.org/10.1016/j.matdes.2014.06.067
[24] Kainer, K.U. (2006). Metal Matrix Composites: Custom-Made Materials for Automotive and Aerospace Engineering. Weinheim: Wiley-VCH Verlag GmbH. https://doi.org/10.1002/3527608117
[25] Agarwal, A., Molwane, O.N., Letsatsi, M.T. (2021). Experimental investigation & analysis of heat transfer characteristics in automotive MMC disc brake under steady state and dynamic conditions. Journal of Engineering Research, 9(ICIPPSD SI): 1-12. https://doi.org/10.36909/jer.ICIPPSD.15527
[26] Nandhakumar, S., Seenivasan, S., Mohammed Saalih, A., Saifudheen, M. (2021). Weight optimization and structural analysis of an electric bus chassis frame. Materials Today: Proceedings, 37: 1824-1827. https://doi.org/10.1016/j.matpr.2020.07.404
[27] Agarwal, A., Mthembu, L. (2021). Numerical modelling and multi objective optimization analysis of heavy vehicle chassis. Processes, 9(11): 2028. https://doi.org/10.3390/pr9112028
[28] Agarwal, A., Mthembu, L. (2021). Modelling and FE simulation of HVC using multi objective response surface optimization techniques. Revue des Composites et des Matériaux Avancés-Journal of Composite and Advanced Materials, 31(6): 307-315. https://doi.org/10.18280/rcma.310601
[29] Agarwal, A., Mthembu, L. (2022). Structural analysis and optimization of heavy vehicle chassis using aluminium P100/6061 Al and Al GA 7-230 MMC. Processes, 10(2): 320. https://doi.org/10.3390/pr10020320