Ery Sugito* | Rika Ampuh Hadiguna | Rizki Prakasa Hasibuan
© 2021 IIETA. This article is published by IIETA and is licensed under the CC BY 4.0 license (http://creativecommons.org/licenses/by/4.0/).
OPEN ACCESS
Material handling activities within a company have a very important role, especially in warehousing activities ranging from the process of receiving goods, storing goods to product distribution. To reduce the waste that occurs in material handling, a lean manufacturing approach is used with the Value Stream Mapping (VSM) method for mapping the flow of material handling activities and the flow of information on material handling activities. Waste that occurs in the material handling work process in the printing sheets area includes waiting, excess processing, and transportation. With Root Cause Analysis and Risk Matrix, it is known that the most influential root causes of waste are inadequate human resources, material handling tools in preparing goods and process break quantity from standard pallets, and distribution of areas far from the printing sheets warehouse area. Recommendations for improvement proposals offered are, providing additional material handlers, material handling tools for activities within one department by considering distance and time, reducing break quantity requests and temporary locations for receiving printing sheets in the production area, as well as collaborating with suppliers to arrange the arrival schedule of printing sheets material by communicating and updating regularly with the forwarder if the frequency of delays is too frequent. So that if it is repaired and applied it will improve the performance of the material handling.
lean manufacturing, value stream mapping, root cause, and risk matrix
When we hear the term of warehousing, a negative image about it such as high costs and non-value-added activities always appear. But with technology right now, this can be reduced and controlled so the warehouse performance becomes more optimal and efficient. The warehousing function is maintained in the manufacturing industry to this day, thus the emergence of optimization techniques for logistics and supply chain management. such as lean manufacturing, just in time, and on-time delivery are very decisive in analyzing improvement performance [1, 2].
Manufacturing and warehouse facilities combine to create a cohesive unit that is flexible to changing market needs. Facilities in several industries such as material inventory, materials in process (WIP), and/or finished goods (finished goods) in material handling practices in warehouses and distribution facilities can have a significant impact on the overall profitability of an organization. Warehousing is the largest operational cost in an organization's supply chain. This can represent 2 to 5 percent of the company's selling costs [3]. Thus, the emphasis on optimizing the material handling process can help the company's profits. Efficient use of space, equipment, and labor in warehouses is a major concern for organizations looking to cut costs. Material handling involves the movement of materials, manually or mechanically in batches or one item at a time within the factory. Movement may be horizontal, vertical, or a combination of both. The movement of materials adds to the cost but not the product of value. The ideal plant would have an absolute minimum of material handling and use more mechanical material handling equipment. Domingo et al. [4] stated that labor shortages and rising wage costs require the most efficient use of labor. However, in material handling activities in the company's warehousing system, the company still uses a lot of human labor as its main energy so that material distribution activities tend to be slow and require a long time. This certainly requires the warehouse manager to carry out the efficiency of the material handling activities, because in a series of material handling activities there is still a waste of activity in preparing materials, especially in the printing sheet material which will be distributed to the production department. This process occurs when unloading old printing sheets, piling up preparing goods, this makes waiting time and causes production to delay the production process. So that waste identification needs to be done so that repairs can be carried out immediately and material handling activities can be more optimal and material distribution performance can be faster [5].
Presented in simple language, material handling is loading and unloading materials, moving, to be carried out safely and economically, with various types of handling and equipment [6]. One that was re-adopted by The American Material Handling Society is: Material handling is the art and science of collecting, storing, and storing substances in any form. The essential requirements of a good material handling system can be summarized as:
However, a material handling system is being widely used for different manufacturing and distribution processes. Material handling purpose is to give dynamism to static elements such as materials, products, equipment, layout, and human resources which make the production flow possible [7]. Focusing on the importance of an efficient Material Handling System (MHS) for manufacturing, ensuring the right product to the right place with the right quantity and condition, companies can not only refuse their operational costs but can also eliminate/reduce unnecessary buffers on the factory floor [8]. The time wasted in material handling activities will affect the organization
The concept of Lean Manufacturing is defined as a concept that focuses on reducing inventory and lead time. The production process is based on customer orders not based on estimates or estimates of market needs. This means that it is the demand that drives the product for production, not the forecasts of management estimates used to produce it. In contrast to Six Sigma, where Six Sigma focuses its orientation on improving product quality and consistency by reducing the flow that occurs in the manufacturing process. The key concepts of Lean Manufacturing are the cost reduction principle/value engineering and the reduction or elimination of the Seven Wastes (the seven deadly wastes). Seven wastes are waste of excess production, waste of waiting time, waste of transportation, waste of process (processing), waste of stock (waste of inventory), waste of movement. motion), waste reject, and spoilage (waste of defects and spoilage).
Womack and Jones [9] defines a value stream as a collection of several activities carried out to create a product through three critical management tasks, namely problem-solving tasks, information management tasks, and physical transformation tasks. Value stream mapping is an effective tool for assessing the condition of existing business processes and redesigning them based on the Lean concept [10]. The steps in creating a value stream mapping are shown in Figure 1 below.
Figure 1. Process value stream mapping [8]
Value stream mapping (VSM) is a lean manufacturing technique to analyze the flow of materials and information currently required to bring a product or service to the customer [11]. The baseline performance is studied in the measure phase using the VSM of the current chain. Also, brainstorming is performed to identify the list of the potential inputs, which are investigated in the analysis phase to verify the critical few negatively affecting the outputs such as product quality and flow. VSM is drawn for the future state. In the improvement phase, the critical inputs are studied to determine the solutions, which are implemented.
Meanwhile, to find the root cause of unnecessary activities is using the Root Cause Analysis method. Where Root Cause Analysis (RCA) is a tool used to identify and determine the root cause of a problem with the aim of building and implementing solutions that will prevent the problem from happening again [12-14]. The purpose of RCA is to help answer questions including what went wrong, how the error occurred, and most importantly why did the error occur. Besides being able to be used to identify operational risks, RCA can also be used to improve business processes [12]. The preparation of the RCA consists of several stages.
The stages of research methods are as follows:
1. Identification of the source of the risk
Process business is an activity of material handling.
Do the identification of the incident or potential incident in the case will affect the achievement of the objectives of the company or would potentially harm the company.
2. Defining the waste
The assessment is carried out to determine the value of the root cause of the risk by using the probability of waste.
3. Make Risk Maps
Used to indicate the position of the waste and determine the priority of the waste response.
4. Improvement
An increased follow-up to respond to waste.
4.1 Current state map
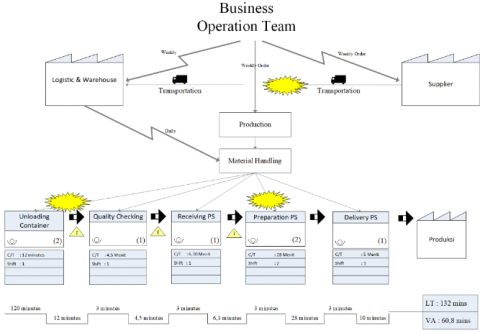
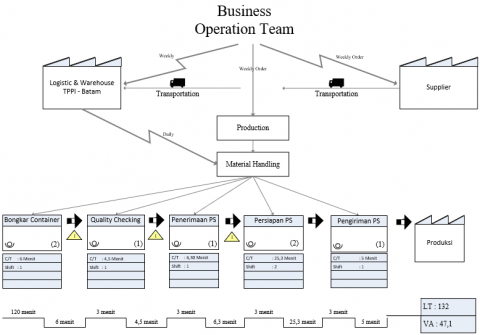
The current state map is a description of the material handling process that takes place within the company which includes the flow of materials and information. This is needed as an initial step in the process of identifying the occurrence of waste that occurs in the material handling process in the printing sheets warehouse, as shown in the image in Figure 2.
From Figure 2, it is known that 2 areas are the focus of research, namely the unloading container process and preparation printing sheets (PS) where there is a high time from each area of 12 minutes for container/pallet unloading and 28 minutes for PS preparation for each pallet. So, it is necessary to identify waste in the area and what are the roots of the emergence of waste.
Figure 2. Current value stream mapping activity of material handling
4.2 Identification waste & root cause
According to the observation, the authors can find out what problems must be solved and how these problems can be solved following the existing theory. Identification of problems that are always faced by material handling based on the results of interviews are as follows:
4.2.1 Transportation
The process of transferring printing sheets starts from the arrival of the forwarder, printing sheets warehouse to the delivery process to the order (production).
Table 1. Process moving printing sheets
|
No |
From |
To |
Type of Goods |
Tools |
|
1 |
From Container Yard |
Warehouse Area TPPI |
Container |
Trailer |
|
2 |
Warehouse Area TPPI |
Check Inspection |
Printing Sheets |
Forklift |
|
3 |
Check Inspection |
Receiving Printing sheets |
Printing Sheets |
Forklift |
|
4 |
Receiving Printing Sheets |
Stacking Printing Sheets at the store |
Printing Sheets |
Reach Truck |
|
5 |
stacking Printing Sheets at the store |
Preparation printing Sheets |
Printing sheets |
Reach Truck |
|
6 |
Preparation printing sheets |
Delivery Printing Sheets |
Printing Sheets |
Reach Truck |
|
7 |
Delivery Printing Sheets |
Receiving Produksi Area |
Printing Sheets |
Reach Truck |
According to Table 1, there are 7 activity processes in the printing sheets warehouse which include one process of container arrival from the forwarder and six transfers of printing sheets in interrelated parts. Each activity is carried out using tools such as trucks, forklifts, reach trucks, and pallet hand jacks.
Table 2. The activity of material handling in department
|
No |
Activity |
Time (minutes) |
|
|
Unstuffing Printing Sheets |
|
|
1 |
Shifting printing sheets with pallet-jack |
8.50 |
|
2 |
Bring the printing sheet to the checking area |
3.50 |
|
|
Total |
12.00 |
|
|
Checking Printing sheets |
|
|
1 |
Checking by QA |
02.50 |
|
2 |
Printing Label or barcode |
02.00 |
|
|
Total |
4.50 |
|
|
Received & Stacking Printing sheets |
|
|
1 |
Checking printing sheets approve stamp |
0.50 |
|
2 |
Type of printing sheets Label |
0.30 |
|
3 |
Stacking printing sheets to racking |
5.00 |
|
4 |
Racking location Update |
0.50 |
|
|
Total |
6.30 |
|
|
Preparation Printing Sheets |
|
|
1 |
Preparation printing sheets |
26.50 |
|
2 |
Update through MIF form |
1.50 |
|
|
Total |
28.00 |
|
|
Delivery Printing sheets |
|
|
1 |
Delivery to MH production area |
10.00 |
|
|
Total |
10.00 |
|
|
Total |
60.80 |
In Table 2, it is known that the material handling activities in the department in the printing sheets area with the activities of loading containers, checking, receiving, arranging, and sending printing sheets take a total of 60.8 minutes per pallet (2500 sheets). And for the week, material handling activities receive containers 3 times a week and incoming containers are 40 ft in size with a capacity of 48 pallets per container (stack 2). So that in the process of unloading for 1 container is 24 pallets x 12 minutes = 288 minutes/day (4,8 Hours/container).
In the checking section, random checks are carried out for each container, generally 10-15 pallets with each pallet requiring a checking time of 4.5 minutes, so that in 1 container it takes 12 pallets x 4.5 minutes = 54 minutes/day (0, 9 Hours/container). While the material handling reception takes 6.30 minutes for each pallet and this is done for 48 pallets so that in 1 container receipt it takes 48 pallets x 6.3 minutes = 302 minutes/container (5 hours/container).
In the preparation section, it takes 25.3 minutes per pallet, this is because many printing sheets have moved pallets because the request is not full pallet. Everyday material handling must prepare 40 pallets/day, so the time needed per day is 40 pallets x 28 minutes = 1120 minutes/day (19 hours/day).
And for delivery to the production MH area, the material handling section of the printing sheets has to rotate the building because the access road is always blocked by a lot of WIP goods piling up in the production area, and in this condition, the delivery time is 5 minutes for each shipment with 2 pallets at a time. So, the time needed for delivery is 20 pallets x 10 minutes = 200 minutes/day (3 hours/day).
4.2.2 Waiting
Delivery of printing sheets through forwarders from overseas is 3-4 times a week. And delays in the arrival of containers that often occur are caused by forwarders, such as: waiting for trucks to arrive, containers being closed by other containers so they are late for unloading, and waiting for ship documents to be completed by agents. This makes the material handler wait longer. The results of collecting information that the receipt of printing sheets containers from December 2018 – January 2019 obtained information of more than 5 cases per month with container delivery outside the specified time. Agreement from the forwarder and consignee that the arrival of the container entering the factory is not later than 03.00 pm, the exception is if there is a problem with the ship departing from the loading port or checking by customs on the condition that information must be given earlier to the consignee so that the consignee can change the time material handler work. The data results are shown in Table 3 below:
Table 3. Conditions of arrival
Table 3 shows, data is obtained that the delay in shipping container printing sheets by forwarders occurs repeatedly every week, 2018 container shipments to the factory started from 4.00 pm to the next day and in 2019 something similar happened so it can be said that the forwarder did not can meet the delivery hours by the agreed time and without any prior notification of delays. So that the production process becomes late and delivery to the customer becomes constrained.
4.2.3 Excess processing
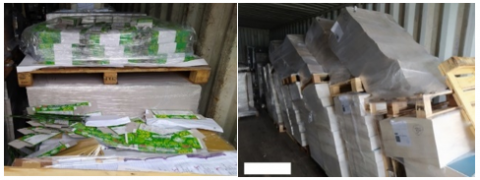
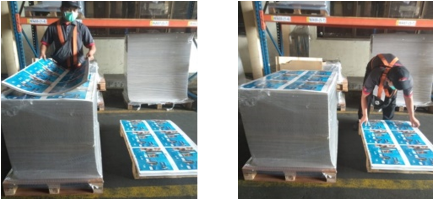
Long transportation and poor processes when loading and unloading printing sheets containers at the port resulted in the condition of the printing sheets in the containers falling and scatter. So, it’s needing to be re-arranged before unloading by material handling and requests from products that were not always full standard quantity pallets made additional work because material handling must divide the pallet quantity based on production needs and requests, of course, this adds to the work process and unloading time as shown in Figure 3 and Figure 4 below:
Figure 3. Items are scattered and fall position in the container
Figure 4. Manual transfer printing sheet to the new pallet
From Figure 4, it is known that material handling separates the quantity ordered by production manually and it can be seen that material handling work is carried out alone so that the potential for damaged goods and delays in delivery to production can occur.
4.3 Analysis of waste
4.3.1 Define
The results of the definition of the types of waste that occur in the printing sheets area can be described in Table 4 obtained from interviews and observations to the material handling team in carrying out daily activities are as follows:
Table 4. Result of identification of waste
|
Presfektif |
||
|
Transportation |
Waiting |
Excess Processing |
4.3.2 Root cause of waste
Root Cause analysis is done using 5 ways. By searching for the root of the problem using this method, the most basic causes can be identified.
Waste Transportation that occurs in the material handling process at Printing sheets store is carried out on the results of interviews and observations shown in Table 5.
Waste Waiting is a waste that often occurs in the process in the sheet printing area, so the 5 Ways analysis is focused on Table 6.
Waste excess processing is one of the wastes that occur in the company. The following in Table 7 is a 5 whys analysis conducted based on the results of interviews and observations.
Based on the table above, it is known that the root of excess processing that occurs is falling printing sheets and requests small qty that do not match the standard qty per pallet from the supplier. So, from the table of root causes of waste described above, it can be identified and summarized for risk assessment of the root cause of the problem to find out which root cause has a high level of risk as shown in Table 8.
From Table 8 it is known that the causes of waste in transportation, waiting and excess processing there are 9 causes where from each waste consists of three why waste occurs in the printing sheets area. So, the next step is to make a list of the root causes of each of these wastes, which are shown as follows in Table 9.
4.3.3 The frequency and impact of the root causes of waste
The root causes of waste in Table 9 are searched for the frequency of occurrence and their impact. After that, it is known which waste has the highest risk and then find a solution by making recommendations for improvement. The following in Table 10 is the frequency and impact of the root causes of the existing waste.
The next step is to assess the root causes of Waste risk, which is done by using the risk matrix shown in Table 11 below.
Table 5. Root cause of waste transportation
|
Type of Waste |
No |
Waste |
Why1 |
Why2 |
Why3 |
|
Transportation |
1 |
Unload area printing sheets is far from the warehouse |
1.1 |
1.1.1 |
1.1.1 |
|
Container parking is far from the Printing Sheets store |
Parking area blocked by another vehicle |
There is no special parking for container |
|||
|
1.2 |
1.2.1 |
|
|||
|
Road row is very narrow |
store printing sheets are side by side with finished goods store |
A lot of truck parking waiting for FG delivery |
|||
|
2 |
Delivery printing sheets to the production is far from PS store |
2.1. |
2.1.1 |
2.1.1.1 |
|
|
Access block by WIP products |
Production Store full with WIP products |
WIP is not proper tidy or stack |
|||
|
2.2 |
2.2.1 |
|
|||
|
One-way access for distribution printings sheets with WIP products |
Way Access become narrow |
|
|||
|
|
|
3.1 |
3.1.1 |
|
|
|
3 |
Shortage of unloading tools |
Sharing equipment for unloading printing sheets |
Shortage of Forklift for the support unloading process |
|
|
|
3.1 |
3.3.1 |
|
|||
|
Reach truck taking a long time for unloading printing sheets |
The limitation with the speed and capacity |
|
Table 6. Root cause of waste waiting
|
Type of Waste |
No |
Waste |
Why1 |
Why2 |
Why3 |
|
Waiting |
1 |
Late of incoming container printing sheets |
1.1 |
1.1.1 |
1.1.1.1 |
|
Late container unload by forwarder |
Barge comes late from overseas |
Barge queue for discharges and documentation |
|||
|
1.1.2 |
1.1.2.1 |
||||
|
Shortage of Chasis |
Waiting for Chasis return from other customers |
||||
|
1.1.3 |
1.1.3.1 |
||||
|
Waiting container release from custom |
The container is the red line so must check deeply |
||||
|
2 |
Require additional manpower for unload printing sheets |
2.1 |
2.1.1 |
2.1.1.1 |
|
|
Shortage manpower in printing sheets store |
Printing sheets big and thick |
The transfer printing sheets cannot do alone |
|||
|
3 |
Printing sheets still check by QA |
3.1 |
3.1.1 |
3.1.1.1 |
|
|
Checking area full and narrow |
A lot of Printing sheets coming |
Checking schedule is very tight |
Table 7. Root cause waste excess processing
|
Type of Waste |
No |
Waste |
Why1 |
Why2 |
Why3 |
|
Excess Processing |
1 |
Printing sheets fall and scatter inside the container |
1.1 |
1.1.1 |
1.1.1.1 |
|
A truck driver carrying fast |
Printing sheets stack with un same size |
Printing sheets un proper wrapping and tied on the pallet |
|||
|
2 |
Small qty request from production |
2.1 |
2.1.1 |
2.1.1.1 |
|
|
Production break-run process |
Not enough lead time for a process |
A lot of model queue |
|||
|
2.2 |
2.2.1 |
|
|||
|
Production running for sample |
Customer order with small qty |
|
Table 8. Identification cause waste
|
Perspective |
Code |
Identification Result of Waste |
|
Transportation |
R1 |
The position of the Parking container is assigned far from the unloading area. And blocked by other goods and trucks. Because the area shared for loading finished goods to delivery to customers |
|
R2 |
Delivery of printing sheets to the production areas is far and need to cross the WIP store |
|
|
R3 |
Transportation equipment to support distributing printing sheets to production areas is not enough |
|
|
Waiting |
R4 |
The arrival of containers printing sheets from forwarders late to the factory |
|
R5 |
Waiting for manpower from other sections that can help the process of unloading printing sheets |
|
|
R6 |
Waiting Quality check finished their checking of the Printing sheets. |
|
|
Excess Processing |
R7 |
Printing sheets fall and scattered inside the container during receiving from forwarder because of transportation or crane |
|
R8 |
Request printing sheets from production is always in small quantity so it is necessary to move or divide according to the order |
|
|
R9 |
Lack of material handling personnel for process preparation |
Table 9. Root cause of waste
|
Presfektif |
code |
Root Cause of Waste Result |
|
Transportation |
R1.1 |
No parking available for printing sheets containers |
|
R1.2 |
Location of the printing sheets warehouse next to the finished goods warehouse |
|
|
R1.3 |
Goods in the production store are not arranged neatly |
|
|
R.1.4 |
Access roads in narrow production areas |
|
|
R.1.5 |
Forklifts for unloading containers are not available |
|
|
R.1.6 |
Reach trucks for unloading have limited speed and capacity |
|
|
Waiting |
R.1.7 |
Ships queuing for unloading |
|
R.1.8 |
Lack of chassis for container shipping |
|
|
R.1.9 |
Goods are stuck at customs because they enter the red lane waiting for inspection |
|
|
R.1.10 |
Preparation work cannot be done alone by material handling |
|
|
R.1.11 |
Busy checking schedule by the QA team |
|
|
Excess Processing |
R.1.12 |
Printing sheets in containers are not wrapped tightly and tied properly |
|
R.1.13 |
Printing sheets queue at the production line |
|
|
R.1.14 |
The quantity ordered by the customer is small |
Table 10. The frequency and impact of the root causes of waste
|
Code |
Root Causes of Waste |
Frequency |
Impact |
|
R.1.1 |
No special parking available for printing sheets containers |
3 times a week |
Potential to cause road access to be narrow, jammed, and prone to accidents |
|
R.1.2 |
Location of the printing sheets warehouse next to the finished goods warehouse |
Everyday |
Making access roads for distribution of printing sheets narrow and prone to accidents |
|
R.1.3 |
Goods in the production store are not arranged neatly |
Everyday |
Potentially WIP Goods hit by a forklift or reach truck |
|
R.1.4 |
Access roads in narrow production areas |
Everyday |
Potentially WIP Goods hit by a forklift or reach truck |
|
R.1.5 |
Forklifts for unloading containers are not available |
3 times a week |
Potentially unloading containers will take a long time or delivery of FG to customers will be stressful |
|
R.1.6 |
Reach trucks for unloading have limited speed and capacity |
3 times a week |
Potentially unloading containers will take a long time or delivery of FG to customers will be stressful |
|
R.1.7 |
Ships queuing for unloading |
3 times a week |
Potential delivery of containers to the factory to be late |
|
R.1.8 |
Lack of chassis for container shipping |
3 times a week |
Potential delivery of containers to the factory to be late |
|
R.1.9 |
Goods are stuck at customs because they enter the red lane waiting for inspection |
3 times a week |
Potential delivery of containers to the factory to be late |
|
R.1.10 |
Preparation work cannot be done alone by material handling |
Everyday |
Potentially slow delivery of printing sheets to production |
|
R.1.11 |
Busy checking schedule by the QA team |
3 times a week |
Potentially slow delivery of printing sheets to production |
|
R.1.12 |
Printing sheets in containers are not wrapped tightly and tied properly |
3 times a week |
Potentially slow delivery of printing sheets to production |
|
R.1.13 |
Printing sheets queue at the production line |
Everyday |
Potentially slow delivery of printing sheets to production |
|
R.1.14 |
The quantity ordered by the customer is small |
Everyday |
Potentially slow delivery of printing sheets to production |
Table 11. Risk assessment of root causes of waste
|
Code |
Root Causes of Waste |
Likelihood (L) |
Consequence (C) |
(L) |
(C) |
(L) x (C) |
|
R.1.1 |
No special parking available for printing sheets containers |
Almost Certain |
Minor |
5 |
2 |
10 |
|
R.1.2 |
Location of the printing sheets warehouse next to the finished goods warehouse |
Almost Certain |
Minor |
5 |
2 |
10 |
|
R.1.3 |
Goods in the production store are not arranged neatly |
Almost Certain |
Moderate |
5 |
3 |
15 |
|
R.1.4 |
Access roads in narrow production areas |
Moderate |
Minor |
3 |
2 |
6 |
|
R.1.5 |
Forklifts for unloading containers are not available |
Almost Certain |
Major |
5 |
4 |
20 |
|
R.1.6 |
Reach trucks for unloading have limited speed and capacity |
Rare |
Minor |
1 |
2 |
2 |
|
R.1.7 |
Ships queuing for unloading |
UnLikely |
Minor |
2 |
2 |
4 |
|
R.1.8 |
Lack of chassis for container shipping |
Rare |
Minor |
1 |
2 |
2 |
|
R.1.9 |
Goods are stuck at customs because they enter the red lane waiting for inspection |
Rare |
Minor |
1 |
2 |
2 |
|
R.1.10 |
Preparation work cannot be done alone by material handling |
Almost Certain |
Major |
5 |
4 |
20 |
|
R.1.11 |
Busy checking schedule by the QA team |
Rare |
Minor |
1 |
2 |
2 |
|
R.1.12 |
Printing sheets in containers are not wrapped tightly and tied properly |
Almost Certain |
Major |
5 |
4 |
20 |
|
R.1.13 |
Printing sheets queue at the production line |
Moderate |
Moderate |
3 |
3 |
9 |
|
R.1.14 |
The quantity ordered by the customer is small |
Likely |
Major |
4 |
4 |
16 |
4.3.4 Risk matrix root causes of waste
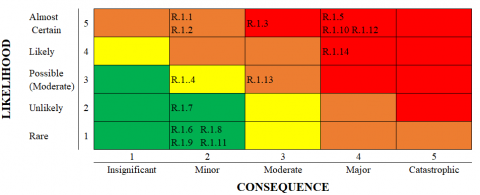
The Risk Matrix was created to find out the grouping of waste that occurs, where the roots of the grouping of waste are grouped based on the level of risk in the risk matrix which is shown in Figure 5 below:
Figure 5. Risk matrix root causes of waste remark
|
= Extreme The solution is immediately sought by involving the leadership and management of the team |
|
|
= High The handling is by providing a special parking area and making a line for laying goods |
|
|
= Moderate Negotiating with consumers for minimum orders |
|
|
= Low Take control with regular communication and updates |
4.3.5 Improvement recommendation
The waste contained in material handling activities in the printing sheets area is transportation, waiting, and excess processing. Waste that has been obtained from the results of interviews and observations becomes an input for the company in the future. From Figure 6 the value-added decreased from the previous total of 60.8 minutes to 47.1 minutes, this was due to improvements in the area so that transportation, waiting and excess processes became smaller and more reliable, so that the strategy improvements given in Table 12, is found that 14 causes of waste in the printing sheets area in material handling activities are:
Figure 6. Value stream mapping improvement
Table 12. Repair strategy
|
code |
Root Cause of Waste |
Repair Strategy |
|
R.1.1 |
No special parking available for printing sheets containers |
1. Define and create a special area for printing sheets. container parking 2. Give a line or mark the area that is the parking location to make it clearer 3. The container parking area is not too far from the printing sheets warehouse for easy loading |
|
R.1.2 |
Location of the printing sheets warehouse next to the finished goods warehouse |
1. Provide lorry access for shipments when there is an incoming container 2. Always improve to the team so as not to block the access road to store printing sheets |
|
R.1.3 |
Goods in the production store are not arranged neatly |
1. Use standard pallets to arrange goods on the production floor 2. Make a line for placing things neatly 3. Avoid placing items that block the access road 4. Avoid items in a high stack |
|
R.1.4 |
Access roads in narrow production areas |
1. Use pallets to arrange goods on the production floor 2. Make a line for placing things neatly 3. Avoid sticking items that block the access road 4. Avoid items in a high stack |
|
R.1.5 |
Forklifts for unloading containers are not available |
1. Submission of proposals for forklift rentals to support loading and unloading printing sheets |
|
R.1.6 |
Reach trucks for unloading have limited speed and capacity |
1. Avoid using reach trucks to unload containers for safety factors 2. The reach truck is only used in the warehouse |
|
R.1.7 |
Ships queuing for unloading |
1. More communication with forwarders and agents to always update the information to TPPI logistics |
|
R.1.8 |
Lack of chassis for container shipping |
1. More communication with forwarders and agents to always update the information to TPPI logistics |
|
R.1.9 |
Goods are stuck at customs because they enter the red lane waiting for inspection |
1. More communication with forwarders and agents to always update the information to TPPI logistics |
|
R.1.10 |
Preparation work cannot be done alone by material handling |
1. Request to the management team for additional material handling |
|
R.1.11 |
Busy checking schedule by the QA team |
1. Add an inspector if there are a lot of printing sheets to make work faster. 2. The location of the barcode printer is available in the checking area |
|
R.1.12 |
Printing sheets in containers are not wrapped tightly and tied properly |
1. Request the supplier for full wrapping and tied to avoid falling goods 2. Goods are arranged in containers tightly to avoid shifting while traveling 3. If the goods are not full in the container so that they are propped up so that the goods do not move |
|
R.1.13 |
Printing sheets queue at the production line |
1. The MH production team must immediately withdraw the goods from the receiving area 2. Goods to be arranged according to the request of the machine 3. Checking the model and qty at the reception at the receiving area |
|
R.1.14 |
The quantity ordered by the customer is small |
1. Purchasing orders to suppliers according to production needs 2. Production must order according to the incoming qty from the supplier 3. If the purchasing order is outside of production requirements, a standard qty pallet must be made and production must follow the standard qty. |
4.3.6 Control
With the determination of the improvement steps (Improved), the next step is to design a monitoring system mechanism to implement improvements that will be carried out in the target of achieving increased material handling performance in the printing sheets area. Where the targets set are the Transportation, Waiting, and Excess Processing processes. In the improvement stage, 14 process areas that need to be improved are obtained, so that a conclusion is drawn based on the operation management decision that the control stages are shown in the Table 13 below:
Table 13. Control stages
|
Presfektif |
Control Mechanism |
|
Transportation |
1. The logistics manager supervises the performance of Material handling employees after repairs are made as to the basis for determining KPI |
|
2. Supervise incoming containers to always park in the designated area |
|
|
3. Supervise the production MH to follow the instructions given not to pile up goods on the road |
|
|
4. Supervise rental forklifts to maximize activities from unloading and distributing printing sheets |
|
|
5. Always improve the material handling team at every morning briefing to work safely and safely |
|
|
6. Reach truck to be used inside the building to avoid damage and other risks |
|
|
Waiting |
1. Monitoring the incoming printing sheets container from the forwarder |
|
2. Monitor and ensure suppliers follow requests in the preparation of goods in containers |
|
|
3. Maintain and improve communication with forwarders regarding the arrival and processing of incoming containers |
|
|
4. Ensure and monitor performance with additional MH in the printing sheet area for more optimal performance |
|
|
5. Always improve and communicate with the QA team as the target of inspection is also on time so that MH becomes fast in distributing printing sheets |
|
|
Excess Processing |
1. Ensuring suppliers for wrapping and tied tightly so that the goods do not easily fall and fall |
|
2. Ensure and monitor the performance of MH Production to immediately withdraw the printing sheets sent by MH Logistic so that they do not pile up in the production line |
|
|
3. Ensure that the schedule from the planner for running production is not asked for loose qty |
Based on the results of research and discussions that have been carried out regarding the material handling performance improvement project at packaging box manufacture in the Printing sheets work area using Value Stream Mapping (VSM), the following conclusions can be drawn:
As a follow-up to the results of this technical report, the authors recommend that more in-depth research be carried out in a case study on the company so that the results and performance of material handling are more optimal and the targets are clearer. Apart from that, the company's management must support the results and input that comes from employees in improving performance and productivity improvements.
[1] Hompel, M.T., Thorsten, S. (2007). Warehouse Management: Automation and Organization of Warehouse and Order Picking Systems. Springer. https://doi.org/10.1007/978-3-540-35220-4
[2] Hasibuan, R.P., Kusrini, E. (2020). Model design supplier relationship performance measurement. The Eurasia Proceedings of Educational and Social Sciences, 19(1): 11-22.
[3] Frazelle, E.H. (2002b). World-Class Warehousing and Material Handling. McGraw-Hill.
[4] Domingo, R., Alvarez, R., Pena M.M., Calvo, R. (2007). Material Flow Improvement in a lean assembly line: a case study. Assembly Automation, 27(2): 141-147. https://doi.org/10.1108/01445150710733379
[5] Kusrini, E., Sugito, E., Rahman, Z.M., Setiawan, T., Hasibuan, R.P. (2020). Risk mitigation on product distribution and delay delivery: A case study in an Indonesian manufacturing company. IOP Conference Series: Materials Science and Engineering, 722: 12015.
[6] Siddhartha, R. (2008). Introduction to Material Handling. New Age International Publisher, Kolkata.
[7] Stecke, K.E. (1985). Design, planning, scheduling, and control problems of flexible manufacturing systems. Annals of Operations Research, 3(1): 1-12. https://doi.org/10.1007/BF02023765
[8] Putra, F.M.A.M., Ridwan, A.Y., Astuti, M.D. (2019). Material handling performance measurement and metrics for internal milk-run area using overall transportation effectiveness. Case study: Automotive industry. IOP Conference Series: Materials Science and Engineering, 598(1): 012080.
[9] Womack, J.P., Jones, D.T. (2003). Lean Thinking: Banish Waste and Create Wealth in your corporation. Second Edition. London: Free Press Business.
[10] Locher, D.A. (2008). Value Stream Mapping for Lean Development: A How-To Guide for Streamlining Time to Market. New York: Taylor & Francis Group.
[11] Salah, S., Rahim, A. (2019). Implementing lean six sigma in supply chain management. In: An Integrated Company-Wide Management System. Springer, Cham. https://doi.org/10.1007/978-3-319-99034-7_6
[12] Doggett, M.A. (2005). Root cause analysis: A framework for tool selection. Quality Management Journal, 12(4): 34-45. https://doi.org/10.1080/10686967.2005.11919269
[13] Jing, G.G. (2008). Digging for the root cause. ASQ Six Sigma Forum Magazine, 7(3): 19-24.
[14] Heuvel, L.N., Lorenzo, D.K., Hanson, W.E., Jackson, L.O., Rooney, J.J., Walker, D.A. (2008). Root Cause Analysis Handbook: A Guide to Efficient and Effective Incident Management. Third Edition. Rothstein Associates, Incorporated.