Meriem Harkat | Safia Alleg* | Rafik Chemam | Sonia Azzaza | Majda Mokhtari | Essebti Dhahri
© 2021 IIETA. This article is published by IIETA and is licensed under the CC BY 4.0 license (http://creativecommons.org/licenses/by/4.0/).
OPEN ACCESS
Nanocrystalline and thermally stable hydroxyapatite (HA) powder with nominal composition of Ca10(PO4)6(OH)2 was prepared by wet chemical route from calcium hydroxide Ca(OH)6 and mono ammonium phosphate NH4H2PO4 as calcium and phosphate sources, respectively. The effect of calcination temperature on the structure, microstructure, molecular bonding, thermal behavior and morphology was investigated by X-ray diffraction patterns (XRD), Fourier Transform Infra-Red (FT-IR), Raman spectroscopy, thermogravimetry (TGA), differential thermal analysis (DTA) and scanning electron microscopy (SEM) coupled with energy dispersive X-ray spectroscopy (EDS) analysis. The XRD patterns of the as-prepared and calcined powders exhibit a single phase of hydroxyapatite. The crystallite size of as-prepared and calcined HA is in the range of 44-182 nm. FT-IR and Raman spectroscopy results are in good agreement with XRD ones. The EDS analysis reveals the presence of all elements. The thermal stability of the synthesized powders is evidenced by TGA/DTA scans which show a weight loss smaller than 2%.
hydroxyapatite, wet chemical route, XRD, Rietveld refinement, SEM
Biomaterials are widely used to repair, fill, extend and reconstruct damaged tissue. The most promising replacement biomaterials are those with bioactive properties such as calcium phosphate-based bioceramics groups (hydroxyapatite HA (Ca10(PO4)6(OH2) and tricalcium phosphate TCP), owing to their good properties such as biocompatibility, osteoconductivity, bioactivity, non-toxicity and non-inflammatory [1, 2]. Therefore, its synthesis has received a great deal of interest both in academic and industrial areas [3-7]. In general, HA is prepared by two main approaches. The first one is solid state reaction which produces oxyapatite instead of HA and must be controlled by water vapor flow, and the second one belongs to wet chemical route including aqueous precipitation, hydrothermal techniques and hydrolysis of other calcium phosphates. The wet chemical route is widely used owing to its low temperature synthesis, its ability to generate nanocrystalline powders and the fact that it ensures a convenient fusion of the apatite crystals as well as a homogenous molecular mixing [2, 6, 8].
Ca(NO3)2H2O, (NH4)2HPO4 and H3PO4 precursors have been used as calcium and phosphate sources, respectively in many studies [8-13]. It has been reported that the optimum temperature of calcination for HA is 600℃. Above this temperature, HA decomposes into tetracalicum phosphate, tricalcium phosphate, calcium oxide and amorphous calcium phosphate. Some of these compounds are undesirable in medical applications because of their fast dissolution in vivo which accelerates the implant failure [14].
The aim of the present work is to propose a cheap and quick method for the synthesis of highly nanocrystalline and thermally stable HA powder by the wet chemical route using Ca(OH)2(H2O)6 and NH4H2PO4 as calcium and phosphate sources, respectively. The structure, microstructure, morphology and thermal stability of the as-prepared and calcined powders were investigated by means of X-ray diffraction (XRD), Fourier Transform Infra-Red (FT-IR), Raman spectroscopy, thermogravimetry, differential thermal analysis (TGA/DTA) and scanning electron microscopy (SEM) coupled with energy dispersive X-ray spectroscopy (EDS).
2.1 Powder synthesis
Calcium hydroxide Ca(OH)2.(H2O)6, monoamonium dihydrogen phosphate NH4H2PO4 and ammonia NH4OH were used to prepare nanocrystalline HA powders. Calcium and phosphorous precursors were dissolved separately in distilled water. The aqueous NH4H2PO4 solution was added by drop wise to Ca(OH)2.(H2O)6 aqueous solution and was subjected to hot magnetic agitation at room temperature for 2 hours. An appropriate amount of ammonium solution NH4OH was added to keep the pH close to 9-10.The precipitate was then washed with distilled water several times to eliminate impurities and then filtered using Buchner funnel and vacuum pump. After filtration, the product HA1 was dried at 60℃ overnight. The as-dried HA1 powder was crushed using an agate mortar and then calcined at 600, 800 and 1000℃ for 2 h. These temperatures are assigned, respectively, to HA2 (600℃), HA3 (800℃) and HA4 (1000℃) samples. The obtained powders were compacted into pellets of 5 mm in diameter under a pressure of 50 MPa using a uniaxial hydraulic press. Figure 1 displays the steps for samples preparation.
Figure 1. Synthesis method of hydroxyapatite samples
2.2 Characterization techniques
The phase identification of the raw and calcined HA powders was performed by XRD on a PanAlytical Empyrian diffractometer, in a (q-q) Bragg-Brentano geometry, using a CuKα radiation (λ=1.5406 Å) and a step size of 1° from 5° to 139°. Molecular bonding properties of the powders were examined with FTIR and Raman spectroscopy analysis using Brucker instrument, between 4000 and 400 cm-1 for the FTIR and from 100 to 3500 cm-1 for the Raman spectroscopy. Powder morphology was followed by a Vega3Tescan SEM apparatus equipped with energy dispersive X-ray spectroscopy (EDS) analysis. The weight loss and thermal stability of the HA powders were studied by means of TGA/DTA SDT600 instrument, under argon atmosphere, in the temperature range of 82-1200℃ and a heating rate of 10℃/min.
2.3 Phase analysis by the Rietveld method
The Rietveld's refinement [15, 16] of the XRD patterns is achieved by the MAUD program [17]. The peak shapes can be affected by both the sample (crystallite size, strain/stress, and defects) and the instrument (geometry, radiation source, etc.). The crystallite size and the root mean square microstrain (r.m.s.) were evaluated using the isotropic model. The shape of the peaks in the experimental diffraction patterns was well described by an asymmetric pseudo-Voigt function [16]. The instrumental parameters, including three Caglioti parameters for full-width at half-maximum (FWHM), two asymmetry factors and two parameters for Gaussian content of peak profiles, were fixed to the values obtained from the standard material lanthanum boride. The background of each pattern was modeled as a third-order polynomial function. The peak positions were corrected for zero-shift error by successive refinements. Then, the crystal structure parameters such as lattice parameters, phase proportion, crystallite size, r.m.s. (root mean square) microstrain, atomic positions (x, y, z), site occupancy factor, (SOF) and Debye–Waller factor (B) were refined.
The selection of the most satisfactory fitting is made on the base of the minimization of the difference between the observed and simulated powder diffraction patterns which was carried out by using the reliability parameters Rwp (weighted residual factor), RB (Bragg factor) and Rexp (expected residual factor). The goodness of fit (GoF) is obtained by comparing Rwp with Rexp (Gof = Rwp / Rexp). Refinement continues till convergence is reached with the value of the quality factor, GoF approaching 1, which confirms the goodness of refinement.
3.1 XRD analysis
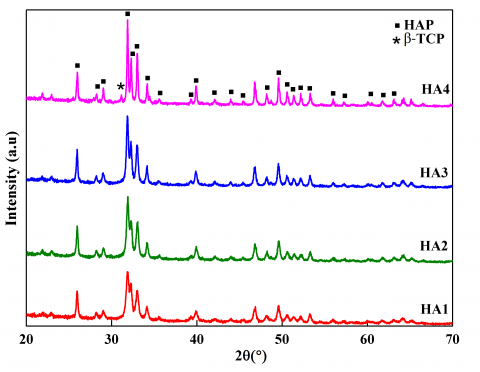
The XRD patterns of the as-prepared and calcined HA powders at different temperatures are shown in Figure 2. The diffraction peaks are characteristic of the calcium hydroxyapatite crystals. As the temperature increased from 600°C to 1000°C, several peaks of the hydroxyapatite become more distinct and also the width of the peaks become narrower which suggests an increase in the crystallite size of the coherent diffraction domains. In addition, a very small additional peaks situated at 2θ=27° and 2θ =31° are observed for the calcined sample at 1000℃. These peaks belong to β-Tricalcium phosphate (β-TCP) phase with chemical formula Ca3(PO4)2 and a volume fraction of about 4%. The formation of this phase may be due to the partially decomposition of carbonated hydroxyapatite into b-TCP during the calcination process at 1000℃ [6, 12, 13, 18-20].
Figure 2. XRD patterns of the as-prepared and calcined HA powders
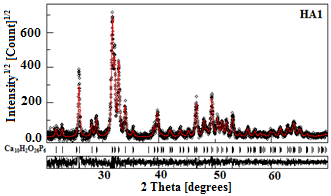
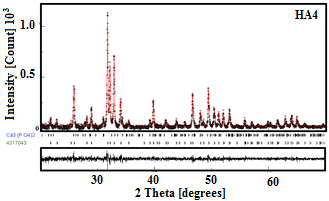
The typical refinement plots of raw and calcined HA powders are shown in Figure 3. The best Rietveld refinement of the HA1, HA2 and HA3 patterns is obtained by the introduction of hexagonal hydroxyapatite nanocrystalline phase with cell parameters a ꞊ b ꞊ 9.432 Å and c ꞊ 6.881 Å and space group P63/m. However, for HA4 sample, the best refinement is obtained with two phases: hexagonal hydroxyapatite and hexagonal b-TCP phase with the space group R3c:H and lattice parameters a ꞊ b ꞊ 10.4352 Å and c ꞊ 37.4029 Å. Because the peaks’ broadening is related to the microstructural characteristics (crystallite size and microstrain), we have applied the Popa approach for the anisotropic microstructure analysis [21], implemented in the MAUD code as “Popa rules”. It resulted that each sample is constituted of elongated nanocrystallites (NC) which can be approximated by circular ellipsoids. The deduced structural and microstructural parameters from the Rietveld refinement of the XRD patterns are summarized in Table 1. One observes an increase in the average crystallite size of the HA powders with increasing the calcination temperature. The higher value of crystallite size (182 nm) was reached for HA4 sample. Similar phenomenon was observed previously [11, 22].
Figure 3. Rietveld refinement of the XRD patterns of HA1 and HA4 powders
Table 1. Lattice parameters (a, c), crystallite size (d), porosity (P) and density (r, g/cm3)
|
Sample |
HA1 |
HA2 |
HA3 |
HA4 |
|
a (Å) (±10-3) |
9.4234 |
9.4174 |
9.4196 |
9.4210 |
|
c (Å) (±10-3) |
6.8869 |
6.8851 |
6.8832 |
6.8817 |
|
d (nm) (±2) |
44 |
52 |
64 |
182 |
|
ρm |
--- |
1.91 |
1.51 |
1.58 |
|
ρX-ray |
3.12 |
3.14 |
3.11 |
3.11 |
|
P |
--- |
0.39 |
0.51 |
0.49 |
Small fluctuations in lattice parameters a and c of HA phase are observed with increasing the calcination temperature. The lattice distortion can be confirmed by the Debye-Waller factor changes during calcination process. The Debye-Waller parameter B is a measure of the displacement of atoms from their ideal positions. It consists of static and thermal components. According to the diffraction theory derived by Krivoglaz [23], BS is related to the static displacement of the atom from the equilibrium position caused by defects such as vacancies, interstitials and dislocations. However, BT is the contribution from the thermal vibrations of the atom around the equilibrium lattice site and is grain size independent [24]. It was reported that the static DWP in various NC samples increases by l00-900% compared to the equilibrium values [25] due to the existence of the lattice distortion in the nanocrystalline lattice.
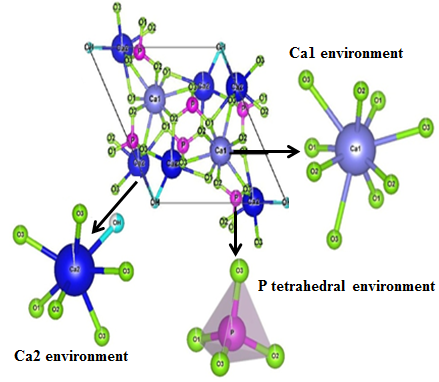
The lattice distortion can be confirmed also by the atomic coordinate changes during the calcination process. The deduced atomic coordinates from the Rietveld refinement indicate that the local arrangement for the nanocrystalline structures is slightly different from that in perfect crystal. In fact, the increase of the calcination temperature may lead to a drift of atoms from their equilibrium positions. Table 2 shows small changes in the atomic coordinates (x, y, z), and occupancy of the calcined HA at 1000℃ compared to the raw sample for some elements. It is well known that the structure of hexagonal HA consists of Ca atoms distributed in two sites: site (I) and site (II). In the first site, Ca1 is located and surrounded by six atoms of oxygen (O1(2), O2(2), O3(2)) connected to phosphate groups, with mean distances of 2.409 Å, and related to three other atoms of oxygen (O3(3)) distanced by 2.821 Å. In the second site, calcium Ca2 is surrounded by six oxygen atoms (O1, O2, O3 (4)) and one atom of oxygen related to OH group; the mean distances between Ca2, atoms of oxygen and OH group are 2.461 Å and 2.720 Å, respectively. As depicted in Figure 4, the tetrahedral arrangement links Ca1 to Ca2. It consists of P atoms related to four atoms of oxygen (O1, O2, O3 (2)) distanced by 1.534 Å. The obtained inter-atomic distances are in good agreement with those reported earlier [26].
Table 2. Atomic positions (x, y, z) and occupancy (Occ.) in the raw and calcined HA at 1000℃ (HA4)
|
Sample |
Atom |
x |
y |
z |
Occ. |
|
Raw HA
|
Ca1 Ca2 P O1 O2 O3 OH |
0.3333 0.2500 0.3984 0.3285 0.5851 0.3432 0 |
0.6666 -0.0055 0.3695 0.4885 0.4600 0.257 0 |
0.00 0.25 0.25 0.25 0.25 0.068 0.193 |
0.3333 1 0.5 0.5 0.5 1 0.195 |
|
HA4
|
Ca1 Ca2 P O1 O2 O3 OH |
0.3333 0.2500 0.3981 0.3281 0.5859 0.3368 0 |
0.6666 -0.0047 0.3667 0.4841 0.4625 0.2508 0 |
0.0017 0.25 0.25 0.25 0.25 0.0658 0.181 |
0.3253 1 0.5 0.5 0.5 1 0.217 |
Figure 4. Unit cell and environment atoms of Ca1, Ca2 and P of HA sample
The determination of the porosity in the studied samples was performed by using the following relation [27]:
$P=1-\frac{{{\rho }_{m}}}{{{\rho }_{X-ray}}}$ (1)
where, ρm is the bulk density and ρX-ray is the X-ray density. ρm is calculated by the following relation [27]:
${{\rho }_{m}}=\frac{m}{\pi {{r}^{2}}h}$ (2)
where, m is the mass of pellet; r is the radius and h is the thickness of the pellet. The calculated porosity values are found to be in the range of 0.39–0.49 (Table 1).
3.2 FT-IR spectroscopy
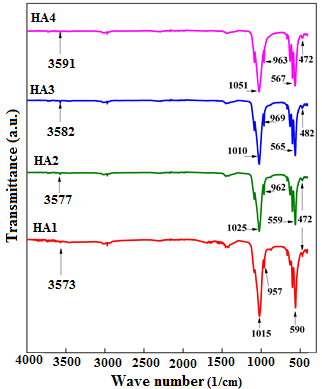
FT-IR spectroscopy is a very useful tool for investigating vibrational properties of the synthesized materials. The band positions and absorption peak not only depend on the chemical composition and structure of the samples but on their morphology also [28]. FT-IR spectra of raw and calcined HA samples in the range from 400 to 4000 cm-1 are shown in Figure 5. Analysis of spectra was done on the basis of the published results of NPs in the literature. Hence, the peak situated at 1015 cm-1 can be attributed to ν1 stretching mode of (P-O) group [8, 11, 12, 14, 29]. The observed peaks at 472, 590 and 957 cm-1 might be assigned, respectively, to ν3 asymmetric stretching of P-O group, ν2 symmetric and ν4 asymmetric deformation of O-P-O bond [8, 11, 12, 14, 29]. The bands assigned to the stretching mode of hydroxyl group O-H are depicted in the range of 470-663 cm-1 and at 3573 cm-1. Several works have reported the same peaks positions of nano-hydroxyapatite but with characteristic peaks of carbonate group [12]. The FT-IR results confirm the XRD ones.
Figure 5. FT-IR spectra of the as-prepared and calcined HA powders at different temperatures
3.3 Raman spectroscopy
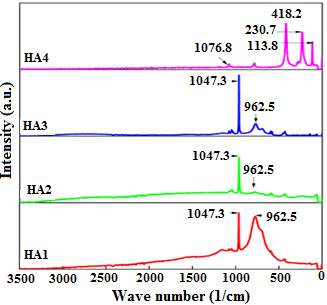
Figure 6 displays the Raman spectra of raw and calcined HA at different temperatures from 100 to 3500 cm-1. HA is an intense Raman scatter and shows very little signal noise with small amount of fluorescence in HA1 and HA2 samples. The vibrational normal modes of tetrahedron are well known and gives rise to four different frequencies: ν1, ν2, ν3, ν4. In fact, ν1=962 cm-1 and ν3=1047 cm-1 frequencies correspond to symmetric and asymmetric stretching of P-O group whereas ν2= 428 cm-1 and ν4=594 cm-1 can be linked, respectively, to the doubly and triply degenerated O-P-O bending character [30-41]. Beside the important reduction of the intensity of the peak positioning at 962 cm-1 with the increase of the calcination temperature, it is observed the appearance of new peaks at 230 and 418 cm-1 frequencies. These assignments can be associated with internal P-O group of the β-TCP phase, whereas the less intense peak at 130 cm-1 is due to the external lattice mode. This result is in good agreement with XRD and FT-IR ones.
Figure 6. Raman spectra of the as-prepared and calcined HA powders at different temperatures
3.4 Thermal analysis
Thermal analysis is usually used to identify the working temperature range at which bioceramics are applicable and to determine the temperature of phase transformation. The latter depends largely on the synthesis techniques of the HA powder [30]. TGA/DTA analyses shown in Figure 7 were conducted to confirm the thermal stability of the synthesis powder HA1. TGA scan shows a total mass loss of about 1.54% in the temperature range of 31-1200℃. In the temperature range of 31-500℃, the maximum weight loss of about 0.8% can be ascribed to the evaporation of the adsorbed water. However, the mass loss (0.08%) between 500 and 800℃, can be linked to the loss of lattice water and finally, between 800 and 1200℃, the weight loss of about 0.66% might be attributed to the beginning of the decomposition of Ca10(PO4)6 to Ca3(PO4)2. DTA curve of the as-prepared powder exhibits an obvious thermal stability owing to the total absence of endothermic and exothermic peaks. This mass loss confirms the XRD results of the calcined powder at 1000℃ as well as the peaks positioning in the Raman spectra of the same sample. The low percentage of the weight loss proves the thermal stability of the synthesis powder.
Figure 7. TGA/DTA curves of the raw HA powder
3.5 Morphology
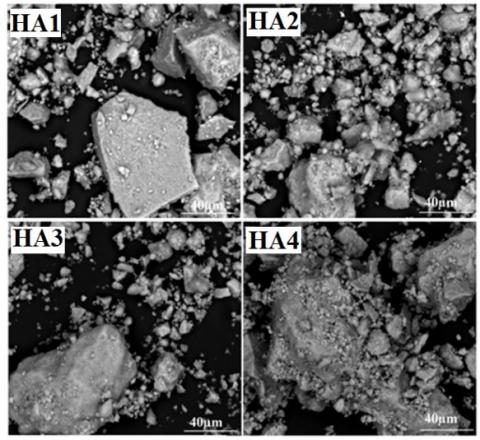
Figure 8a shows SEM micrographs of raw and calcined HA powders at different temperature. For the HA1 sample, the particles which have non-spherical shape are in nanometer range with mean size of ~ 170 nm in length and ~ 90 nm in width. All elements (Ca, P, O) are present in this powder as it is illustrated in the cartography (Figure 8b). As the calcination temperature increases, the morphology of particles for all samples is clearly irregular with plate-like morphology and the most of the hydroxyapatite particles are agglomerated (Figure 9). The average size of these poly-dispersive agglomerations increases and varies from 1 to 8 µm for the smallest one, and from 20 to 50 µm for the biggest one.
Figure 8. SEM micrograph and cartography of Ca, P and O in the raw HA powder
Figure 9. SEM images of the raw and calcined HA powders
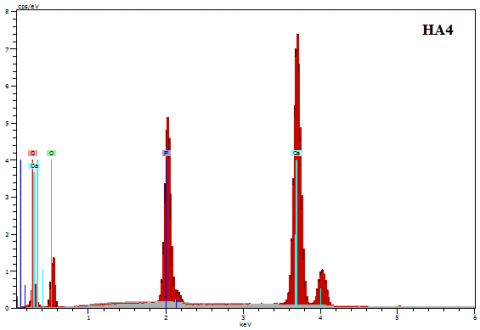
Figure 10. Typical EDS spectra of raw and calcined HA
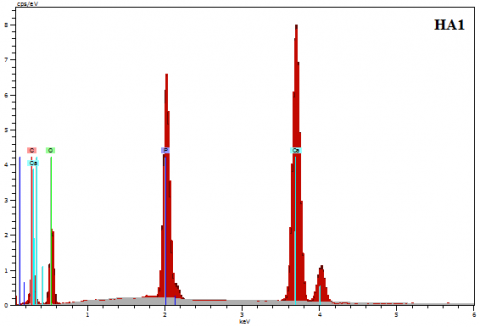
Elemental analysis of the HA powders was performed by EDS. The measurements were performed on several zones of the powders. The qualitative analysis shows the presence of the three elements Ca, O, and P (Figure 10). With increasing the calcination temperature, the percentage of calcium and phosphorous elements varies slightly (Table 3). Moreover, it is important to highlight that no additional peaks are detected in all EDS spectra, indicating the absence of impurities and excludes any contamination from the preparation media or atmosphere.
Table 3. Elemental analysis
|
Element (wt. %) |
HA1 |
HA2 |
HA3 |
HA4 |
|
Ca |
32.51 |
41.56 |
45.74 |
46.8 |
|
P |
12.75 |
14.0 |
15.46 |
15.4 |
|
O |
54.75 |
44.44 |
38.8 |
37.8 |
A quick, easy, simple and cheap method has been used to prepare nanocrystalline and thermally stable HA powder. The XRD results reveal the presence of a single phase of HA up to 800℃. A small amount (~ 4%) of β-TCP secondary phase is observed at 1000°C. The SEM micrographs show that the powder consists of nanoparticles which agglomerate on a random basis with increasing calcination temperature. Both the FT-IR and Raman spectroscopies exhibit the characteristic bands of HA. TGA/DTA scans reveal a weight loss of about 1.54% in the temperature range of 10-1200℃.
This work has been supported by the DGRSDT/MESRS Algeria.
|
a, b, c |
Lattice parameters, Å. |
|
R3c:H |
Space group. |
|
d |
Crystallite size, nm. |
|
P |
Dimensionless Porosity. |
|
x, y, z |
Atomic positions |
|
Greek symbols |
|
|
λ |
Wave length, Å. |
|
ρm |
Bulk density, g/cm3. |
|
ρX-ray |
X-ray density |
|
ν |
Frequency, cm-1. |
|
r |
Density, g/cm3. |
|
Subscripts |
|
|
XRD |
X ray diffraction |
|
FTIR |
Fourier transform infrared spectroscopy |
|
SEM |
Scanning electron microscopy |
|
EDS |
Energy dispersive X-ray spectroscopy |
|
TGA |
Thermogravimetry analysis |
|
DTA HA |
Differential thermal analysis (DTA) Hydroxyapatite |
|
GoF |
Goodness of fit |
|
Rexp |
Expected residual factor |
|
RB |
Bragg factor |
|
Rwp |
Weighted residual factor |
|
r.m.s |
Root mean square |
|
FWHM |
Full width half maximum |
|
TCP |
Tricalcium phosphate |
|
SOF |
Site occupancy factor |
|
B |
Debye Waller factor |
|
NC |
Nanocrystallite |
[1] Haider, A., Haider, S., Han, S.S., Kang, I.K. (2017). Recent advances in the synthesis, functionalization and biomedical applications of hydroxyapatite: review. RSC Advances, 7: 7442-7458. https://doi.org/10.1039/C6RA26124H
[2] Fihri, A., Len, C., Varma, R.S., Solhy, A. (2017). Hydroxyapatite: A review of syntheses, structure and applications in heterogeneous catalysis. Coordination Chemistry Reviews, 347: 48-76. https://doi.org/10.1016/j.ccr.2017.06.009
[3] Wu, S.C., Hsu, H.C., Hsu, S.K., Chang, Y.C., Ho, W.F. (2015). Effects of heat treatment on the synthesis of hydroxyapatite from eggshell powders. Ceramics International, 41(9): 10718-10724. https://doi.org/10.1016/j.ceramint.2015.05.006
[4] Piccirillo, C., Castro, P.M.L. (2017). Calcium hydroxyapatite-based photocatalysts for environment remediation: Characteristics, performances and future perspectives. Journal of Environmental Management, 193: 79-91. https://doi.org/10.1016/j.jenvman.2017.01.071
[5] Ben-Arfa, A.E.B., Salvado, I.M.M., Frade, J.R., Pullar, C.R. (2016). Fast route for synthesis of stoichiometric hydroxyapatite by employing the Taguchi method. Materials and Design, 109: 547-555. https://doi.org/10.1016/j.matdes.2016.07.083
[6] Suparto, I.H., Putri, D.K. (2015). Synthesis of Hydroxyapatite from Rice Fields Snail Shell (bellamyajavanica) through wet method and pore modification using chitosan. Procedia Chemistry, 17: 27-35. https://doi.org/10.1016/j.proche.2015.12.120
[7] Prezas, P.R., Melo, B.M.G., Costa, L.C., Valente, M.A., Lanc, M.C., Ventura, J.M.G., Pinto, L.F.V., Graça, M.P.F. (2017). TSDC and impedance spectroscopy measurements on hydroxyapatite, beta-tricalcium phosphate and hydroxyapatite/beta-tricalcium phosphate biphasic bioceramics. Applied Surface Science, 424(1): 28-38. https://doi.org/10.1016/j.apsusc.2017.02.225
[8] Yeltena, A., Yilmaza, S. (2016). Various parameters affecting the synthesis of the hydroxyapatite powders by the wet chemical precipitation technique. Materials Today: Proceedings, 3(9): 2869-2876. https://doi.org/10.1016/j.matpr.2016.07.006
[9] Agougui, H., Aissa, A., Debbabi, M., Grusselle, M., Thouvenot, R. (2010). Surface modification of mixed hydroxuapatites Ca(10-x)Nix(PO4)6(OH)2 by grafting phenyl phosphonic dichloride. Annales de Chimie Sciences des Matériaux, 35(4): 195-208. http://dx.doi.org/10.3166/acsm.35.195-208
[10] Sendi, N., Bachoua, H., Badraoui, B., Elaloul, E. (2013). Physico-chemical characterization of nickel substituted calcium hydroxyapatites. Annales de Chimie Sciences des Matériaux, 38(3-4): 95-104. http://dx.doi.org/10.3166/acsm.38.95-104
[11] Abidi, S.S.A., Murtaza, Q. (2014). Synthesis and characterization of nano-hydroxyapatite powder using wet chemical precipitation reaction. Journal of Materials Science Technology, 30(4): 307-310. https://doi.org/10.1016/j.jmst.2013.10.011
[12] Ramesha, S., Natashaa, A.N., Tana, C.Y., Banga, L.T., Niakana, A., Purbolaksonoa, J., Chandranc, H., Chinga, C.Y., Rameshd, S., Tenge, W.D. (2015). Characteristics and properties of hydroxyapatite derived by sol-gel and wet chemical precipitation methods. Ceramics International, 41(9): 10434-10441. https://doi.org/10.1016/j.ceramint.2015.04.105
[13] Kramer, E., Podurgiel, J. (2014). Control of hydroxyapatite nanoparticle morphology using wet synthesis techniques: Reactant addition rate effects. Materials Letters, 131: 145-147. https://doi.org/10.1016/j.matlet.2014.05.105
[14] Chandanshive, B.B., Rai, P., Rossi, A.L., Ersen, O., Khushalani, D. (2013). Synthesis of hydroxyapatite nanotubes for biomedical applications. Materials Science and Engineering, 33(5): 2981-2986. https://doi.org/10.1016/j.msec.2013.03.022
[15] Rietveld, H.M. (1967). Line profiles of neutron powder-diffraction peaks for structure refinement. Acta Crystallographica, 22: 151-152. https://doi.org/10.1107/S0365110X67000234
[16] Rietveld, H.M. (1969). A profile refinement method for nuclear and magnetic structures. Journal of Applied Crystallography, 2: 65-71. https://doi.org/10.1107/S0021889869006558
[17] Lutterotti, L., Scardi, P., Maistrelli, P. (1992). LSI - A computer program for simultaneous refinement of material structure and microstructure. Journal of Applied Crystallography, 25: 459-462. https://doi.org/10.1107/S0021889892001122
[18] Fathi, M.H., Hanifi, A., Mortazavi, V. (2008). Preparation and bioactivity evaluation of bone-like hydroxyapatite nanopowders. Journal of Materials Processing Technology, 202(1-3): 536-542. https://doi.org/10.1016/j.jmatprotec.2007.10.004
[19] Ungureanu, D.N., Angelescu, N., Ion, R.M., Stoian, E.V., Rizescu, C.Z. (2011). Synthesis and characterization of hydroxyapatite nanopowders by chemical precipitation. Recent Researches in Communications, Automation, Signal Processing, Nanotechnology, Astronomy and Nuclear Physics, 296-301.
[20] Mansour, F., El-Dek, S.I., Ahmed, M.A., Abd-Elwahab, S.M., Ahmed, M.K. (2015). Effect of preparation conditions on the nanostructure of hydroxyapatite and brushite phases. Applied Nanoscience, 6: 991-1000. https://doi.org/10.1007/s13204-015-0509-4
[21] Popa, N.C. (1998). The (hkl) dependence of diffraction-line broadening caused by strain and size for all Laue groups in Rietveld refinement. Journal of Applied Crystallography, 31: 176-180. https://doi.org/10.1107/S0021889897009795
[22] Sanosh, K.P., Chu, M.C., Balakrishnan, A., Kim, T.N., Cho, S.J. (2009). Preparation and characterization of nano-hydroxyapatite powder using sol gel method. Bulletin of Material Science, 32(5): 465-470. https://doi.org/10.1007/s12034-009-0069-x
[23] Krivoglaz, M. (1969). Theory of X-Ray and Thermal-Neutron Scattering by Real Crystals. Plenum Press, New York.
[24] Qian, H., Wang, S.C., Zhao, Y.H., Lu, K. (2002). Microstrain effect on thermal properties of nanocrystalline Cu. Acta Materialia, 50(13): 3425-3434. https://doi.org/10.1016/S1359-6454(02)00155-6
[25] Lu, K., Zhao, Y.H. (1999). Experimental evidences of lattice distortion in nanocrystalline materials. Nanostructured Materials, 12(1-4): 559-562. https://doi.org/10.1016/S0965-9773(99)00183-X
[26] Dhand, V., Rhee, K.Y., Park, S.J. (2014). The facile and low temperature synthesis of nanophase hydroxyapatite crystals using wet chemistry. Materials Science and Engineering, 36: 152-159. https://doi.org/10.1016/j.msec.2013.11.049
[27] Mahmood, A., FarooqWarsi, M., Naeem Ashiq, M., Ishaq, M. (2013). Substitution of La and Fe with Dy and Mn in multiferroic La1-xDyxFe1-yMnyO3 nanocrystallites. Journal of Magnetism and Magnetic Materials, 327: 64-70. https://doi.org/10.1016/j.jmmm.2012.09.033
[28] Yang, Z., Ye, Z.Z., Xu, Z., Zhao, B.H. (2009). Effect of the morphology on the optical properties of ZnO nanostructures. Physica E: Low-Dimensional Systems and Nanostructures, 42(2): 116-119. https://doi.org/10.1016/j.physe.2009.09.010
[29] Khalida, M., Mujahida, M., Aminb, S., Rawatc, R.S., Nusaird, A., Deenc, G.R. (2013). Effect of surfacetant and heat treatment on morphology surface area and crystallinity in hydroxyapatite nanocrystals. Ceramics International, 39(1): 39-50. https://doi.org/10.1016/j.ceramint.2012.05.090
[30] Jansen, J.A., Leon, B. (2009). Thin calcium phosphate coatings for medical implants. New York: Springer. https://doi.org/ 10.1007/978-0-387-77718-4
[31] Slosarczyk, A., Paluszkiewicz, C., Gawlicki, M., Paszkiewicz, Z. (1997). The FTIR spectroscopy and QXRD studies of calcium phosphate based materials produced from the powder precursors with different Ca/P ratios. Ceramics International, 23(4): 297-304. https://doi.org/10.1016/S0272-8842(96)00016-8
[32] Elliot, J.C. (1994). Structure and Chemistry of the Apatites and Other Calcium Orthophosphates. Studies in Inorganic Chemistry, Elsevier.
[33] Cusco, R., Guitian, F., de Aza, S., Arttis, L. (1998). Differentiation between Hydroxyapatite and /I-Tricalcium phosphate by means of µ-Raman spectroscopy. Journal of the European Ceramic Society, 18(9): 1301-1305. https://doi.org/10.1016/S0955-2219(98)00057-0
[34] Koutsopoulos, S. (2002). Synthesis and characterization of hydroxyapatite crystals: A review study on the analytical methods. Journal of Biomedical Materials Research, 62(4): 600-612. https://doi.org/10.1002/jbm.10280
[35] Sauer, G.R., Zunic, W.B., Durig, J.R., Wuthier, R.E. (1994). Fourier transform Raman spectroscopy of synthetic and biological calcium phosphates. Calcified Tissue International, 54: 414-420. https://doi.org/10.1007/BF00305529
[36] Tsuda, H., Arends, J. (1993). Raman spectra of human dental calculus. Journal of Dental Research, 72(12): 1609-1613. https://doi.org/10.1177/00220345930720121401
[37] Griffith, W.P. (1970). Raman studies on rock-forming minerals. Part II. Minerals containing MO3, MO4, and MO6 groups. Journal of the Chemical Society A: Inorganic, Physical, Theoretical, 286-291. https://doi.org/10.1039/J19700000286
[38] de Aza, P.N., Guitian, F., Santos, C., de Aza, S., Cusco, R., Artus, L. (1997). Vibrational investigation of calcium phosphate compounds: Comparison between hydroxyapatite and β-tricalcium phosphate. Chemistry of Materials, 9(4): 916-922. https://doi.org/10.1021/cm9604266
[39] Rehrnan, I., Smith, R., Hench, L.L., Bonfield, W. (1995). Structural evaluation of human and sheep bone and comparison with synthetic hydroxyapatite by FT-Raman spectroscopy. Journal of Biomedical Materials Research, 29(10): 1287-1294. https://doi.org/10.1002/jbm.820291016
[40] O’Shea, D.C., Bartlett, M.L., Young, R.A. (1974). Compositional analysis of apatites with laser-raman spectroscopy: (OH, F, Cl) apatites. Archives of Oral Biology, 19(11): 995-1006. https://doi.org/10.1016/0003-9969(74)90086-7
[41] Liu, D., Troczynski, T., Tseng, J.W. (2001). Water-based sol-gel synthesis of hydroxyapatite: Process development. Biomaterials, 22(13): 1721-1730. https://doi.org/10.1016/S0142-9612(00)00332-X