Vaka Gopi* | Kagita Kumara Swamy | Arepalli Peda Gopi | Vejendla Lakshman Narayana
© 2020 IIETA. This article is published by IIETA and is licensed under the CC BY 4.0 license (http://creativecommons.org/licenses/by/4.0/).
OPEN ACCESS
In present making of construction industry at a high pace. The tendency of world influenced the high raised buildings. In modern days one of the most common element is deep beam, constructed a small span to depth ratio. The transfer girders most of used in deep beams. In an experimental program consists of 12 deep beam specimens are carried out for shear strength behavior investigation of Reinforced Concrete sandwich deep beam concealed with insulation pad in various depths 200mm and 300mm and 400mm. in the experimental program effective length, depth, the width of the specimens, width of bearing plates, longitudinal reinforcement as 1% to maintain constantly and horizontal reinforcement as varies as 0.15% and 0.25% and 0.35%. We are considered shear span to depth ratio of deep beam is 0.95. The main aim of the experimental study the influence of longitudinal shear reinforcement along with vertical and horizontal shear reinforcement on the shear strength, shear ductility of RC sandwich deep beams of insulation pads placed at different depths.
deep beam, shear reinforcement, insulation pad, crack pattern, diagonal crack
Deep beams are simple beams and load carrying to structural elements. In which major amount of load will be carried to the supports of deep beams by a compressive force combining the load and the reaction beam. Consequently, the strain distribution is never again thought to be direct, and the shear mishappening wind up unique when contrasted with pure flexure. Reinforced concrete deep beams have helpful applications in tall structures, seaward structures, and establishments. Especially the utilization of profound shafts at the lower levels in tall structures for private and business purposes has expanded quickly in view of their accommodation and economic proficiency. Based on some experimental results variation of width of deep beam it doesn’t affect the shear strength of specimen because of this only in my present study we are varying the depth of polystyrene (200, 300, 400 mm) in middle portion of the deep beam and the observe the shear strength behavior, then compare the experimental results with control specimens.
To increase the height of the deep beam by reduction of shear strength. And also, web reinforcement also plays a main role in size effect of deep beam [1]. In strut and tie modal, size of shear strength reinforced concrete deep beam expression used [2]. Along udl and concentrated loads on deep beam we understand the horizontal reinforcement distribution along the size of the deep beam influence the mode of failure sudden flexural to diagonal shear failure [3]. According to base on shear transfer mechanism to develop the shear strength expression of deep beam through find the strut – tie model [4]. For both strut boundary and strut geometry play an important role in controlling size effect [5]. Prove that variation of a/dratio, will effect on shear strength of deep beam under failure load [6]. Discussion about the increases the shear strength of deep beam with alternative web reinforcement with different percentages [7].
The extension otherwise bent up the flexural reinforcement beyond the support reactions as to achieve the strut and tie action to provide adequate anchorage in deep beam. (The mix design of Deep beam shown in Table 1). As per IS 456-2000 [8] the minimum shear [9] reinforcement will be taken in in horizontal and vertical shear reinforcement is 0.15%, 0.25%, and 0.35%. The spacing of 8mm diameter vertical and horizontal stirrups for the above minimum vertical and horizontal shear reinforcement was 575 mm, 285 mm, and 180mm and 275 mm, 135 mm, 90 mm center-to-center as shown in Table 2.
Table 1. Summary of concrete mix design
|
Description |
Type |
|
Cement type |
OPC 53 grade |
|
Aggregate type |
Crushed granite and natural washed sand |
|
Fine aggregate content |
710kg/m3 |
|
Cement content |
420 kg/m3 |
|
Coarse aggregate content |
1127kg/m3 |
|
Slump for concrete |
100 mm |
|
Water/cement ratio |
0.45 |
Figure 1. Plan, elevation of sandwich deep beam
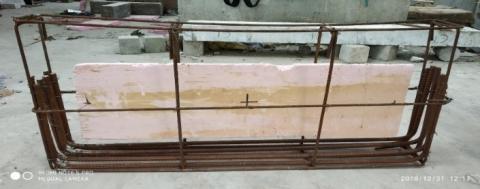
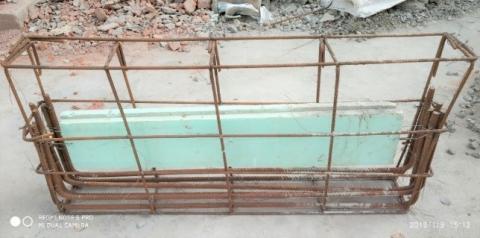
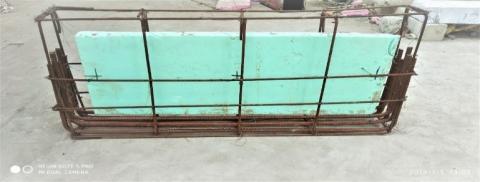
The shear reinforcement of deep beam in vertical and horizontal 0.12% and 0.2 of c/s using HYSD bars. The percentage of vertical and horizontal reinforcement with addition to the 200mm, 300mm, 400mm polystyrene depths of deep beam. Three percentages 0.15%, 0.25%, 0.35% shear reinforcement percentages in horizontal and vertical direction applied. To study the shear strength and crack behavior of the deep beam. And another form of varying vertical and horizontal shear reinforcement percent (0.15%, 0.25% and 0.35%) in the web [10] was used. The reinforcement details of shear reinforcement percent (0.15%, 0.25% and 0.35%) is shown in Figure 2 to Figure 13.
Figure 2. Reinforcement details of 0.15% control deep beam
Figure 3. Reinforcement details of 0.15%-200mm deep beam
Figure 4. Reinforcement details of 0.15%-300mm deep beam
Figure 5. Reinforcement details of 0.15%-400mm deep beam
Figure 6. Reinforcement details of 0.25% control deep beam
Figure 7. Reinforcement details of 0.25%-200mm deep beam
Figure 8. Reinforcement details of 0.25%-300mm deep beam
Figure 9. Reinforcement details of 0.25%-400mm deep beam
Figure 10. Reinforcement details of 0.35% control deep beam
Figure 11. Reinforcement details of 0.35%-200mm deep beam
Figure 12. Reinforcement details of 0.35%-300mm deep beam
Figure 13. Reinforcement details of 0.35%-400mm deep beam
This work expects to give experimental evidence on the shear behavior of Reinforced concrete deep beams [11] to allow a superior comprehension of the impacts of fluctuating the depth of the sandwich sheet. The issues will likewise permit an estimation of the present code arrangements and help distinguish their controls.
Note: a/d - shear span to depth ratio, B - width of specimen in mm, D - depth of specimen in mm, ⍴_v and ⍴_h - percentage of vertical and horizontal web reinforcement [12], Ahst and Avst- area of vertical and horizontal shear reinforcement in mm2, nh and nv - number of stirrups in vertical and horizontal, Svandsh center to center spacing between vertical and horizontal shear reinforcement in mm. All the beams maintain 6 bars of 16mm diameter steel bars @ 95mm from base of the beam in tension zone in two layers c-c distance of 75mm and Ast 1206.37 mm2 for all control and sandwich specimens.
The test specimens consisted of four simply supported beams (shown in Figure 1) 600 mm deep and 200 mm wide and effective span Leff of 1035 mm the beams had a tension steel area As = 300 mm2, providing ρ = 0.25 percent. All the beams have the same shear span by depth ratio (a/d = 0.875) and effective length by depth ratio (Leff/d = 1.725) and varies the depth of polystyrene (dp) at different depths of 200 mm, 300 mm, 400 mm of length (Lp) 1000 mm and width (Wp) of 50 mm placed at the middle of the cage. At locations of loading or support point, a local reinforcement cage was provided to prevent premature crushing or bearing failure. One variation is introduced, viz., depth of sandwich depth 200 mm, 300 mm, 400 mm and their cross-sections. While the concrete mix design is given in Table 1. The reinforcement details of sandwich deep beam shown in Figure 2 to Figure 13.
The testing of beam under three-point loading with 2000KN capacity loading. The testing point will be observing the shear behavior of beam with different shear reinforcement percentages respective sandwich depths. All beams were tested under gradually applied loading under 28days curing period. The deflections of the beam observed mid span of the beam by appropriate LVDT. The load at mid span or diagonal points a definitive shear cracks of the deep beam noted.
6.1 Modes of failure of 0.15% sandwich deep beam specimens
6.1.1 Deflections
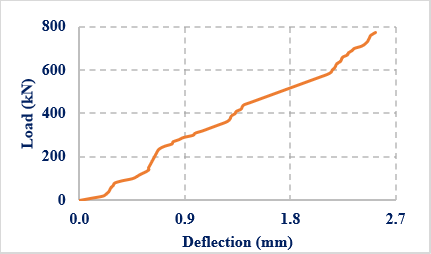
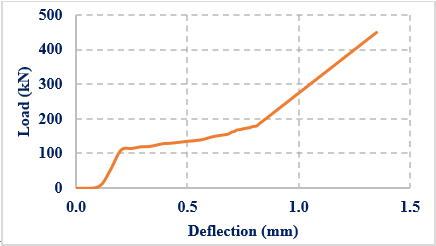
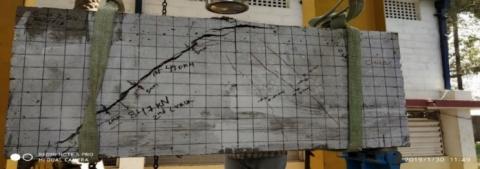
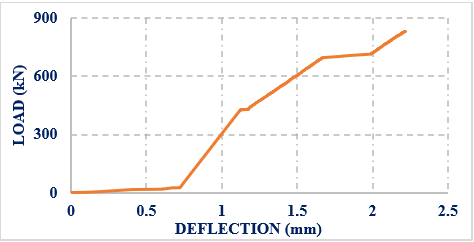
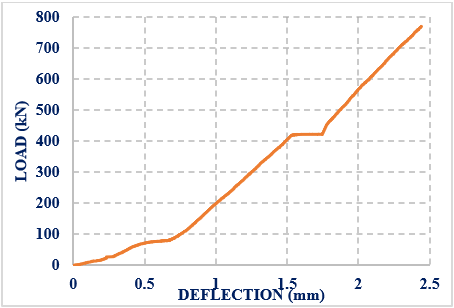
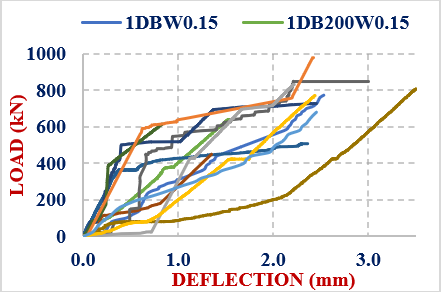
Figure 14 shows the behavior of the control specimen (DBW0.15) under the initial and ultimate loading condition at 490 kN and 773 kN load. It shows deflection of 1.66 mm at an initial diagonal crack load of 490 kN and 2.53 mm at the ultimate diagonal crack load 773 kN. Table 3 show the experimental load values. Figure 15 shows the behavior of DB200W0.15 under initial and ultimate loading condition at 359 kN and 639.1 kN load. It shows deflection of 0.915 mm at the initial diagonal crack load of 359 kN and 2.153 mm at ultimate diagonal crack load 639.1 kN. Figure 16 shows the behavior of DB300W0.15 under initial and ultimate loading condition at 327 kN and 507.1 kN load. It shows deflection of 0.329 mm at the initial diagonal crack load of 327 kN and 2.01 mm at ultimate diagonal crack load 507.1 kN. Figure 17 shows the behavior of DB400W0.15 under initial and ultimate loading condition at 315 kN and 430 kN load. It shows deflection of 0.3 mm at an initial diagonal crack load of 315 kN and 1.35 mm at ultimate diagonal crack load 507.1 kN. Figure 18 shows the shear strength [13] comparison of 0.15% control specimen along with varying insulation pad depths of 200 mm, 300 mm, 400mm specimens shows that 1DBW0.15 specimen gives better results compare other specimens. And DB200W0.15 shear strength [14] results are nearly equal to control specimen remaining will fail at 327 kN, 315 kN. When increasing the depth of core material decreases the shear strength of specimens. Details of specimens are shown in Table 2.
Table 2. Details of specimens
|
S. No |
Beam Designation |
⍴s % |
⍴h&⍴v% |
Ahst |
Avst |
ns |
nh |
nv |
Sv |
Sh |
|
1 |
1DBW0.15 |
1 |
0.15 |
201.06 |
301.59 |
6 |
4 |
6 |
575 |
550 |
|
2 |
1DB200W0.15 |
1 |
0.15 |
201.06 |
301.59 |
6 |
4 |
6 |
575 |
550 |
|
3 |
1DB300W0.15 |
1 |
0.15 |
201.06 |
301.59 |
6 |
4 |
6 |
575 |
550 |
|
4 |
1DB400W0.15 |
1 |
0.15 |
201.06 |
301.59 |
6 |
4 |
6 |
575 |
550 |
|
5 |
2DBW0.25 |
1 |
0.25 |
301.59 |
402.12 |
6 |
6 |
8 |
383.3 |
275 |
|
6 |
2DB200W0.25 |
1 |
0.25 |
301.59 |
402.12 |
6 |
6 |
8 |
383.3 |
275 |
|
7 |
2DB300W0.25 |
1 |
0.25 |
301.59 |
402.12 |
6 |
6 |
8 |
383.3 |
275 |
|
8 |
2DB400W0.25 |
1 |
0.25 |
301.59 |
402.12 |
6 |
6 |
8 |
383.3 |
275 |
|
9 |
3DBW0.35 |
1 |
0.35 |
402.12 |
502.65 |
6 |
8 |
10 |
287.5 |
137.5 |
|
10 |
3DB200W0.35 |
1 |
0.35 |
402.12 |
502.65 |
6 |
8 |
10 |
287.5 |
137.5 |
|
11 |
3DB300W0.35 |
1 |
0.35 |
402.12 |
502.65 |
6 |
8 |
10 |
287.5 |
137.5 |
|
12 |
3DB400W0.35 |
1 |
0.35 |
402.12 |
502.65 |
6 |
8 |
10 |
287.5 |
137.5 |
Figure 14. Load vs deflectionof 0.15% control specimen
Figure 15. Load vs deflectionof 0.15% - 200 mm deep beam
Figure 16. Load vs deflectionof 0.15% - 300 mm deep beam
Figure 17. Load vs deflectionof 0.15% - 400 mm deep beam
Figure 18. Shear strength comparison of 0.15% deep beam
6.1.2 Crack patterns, failure modes and crack widths
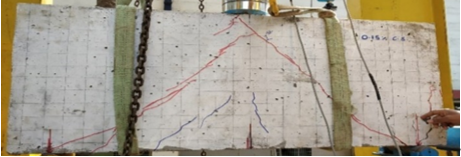
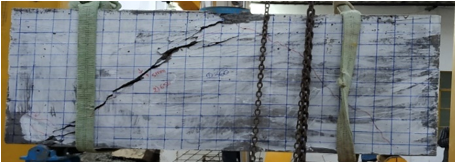
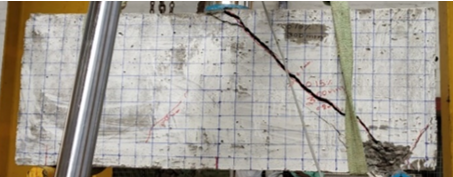
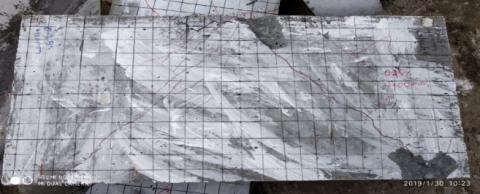
Figure 20 shows a crack pattern of 0.15% 200 mm specimen of 0.02 mm, 0.03 mm at initial loading point of 359 kN and 0.2 mm, 0.4 mm crack width at 639.1 kN. Figure 21 shows a crack pattern of 0.15% 300 mm specimen of 0.02 mm, 0.035 mm at initial loading point of 327 kN and 0.2 mm, 0.4 mm crack width at 507 kN. Figure 22 shows a crack pattern of 0.15% 400 mm specimen of 0.02 mm, 0.03 mm at initial loading point of 315 kN and 0.2 mm, 0.4 mm crack width at 430 kN. Details of experimental data shown in Table 3.
The ultimate load of 1DBW0.15 with initial crack of 1DB200W0.15, 1DB300W0.15, and 1DB400W0.15 specimens 36.60%, 46.40%, 42.30%, 40.75%. That shear strength [15] of 1DB200W0.15 gives better comparative results compare to other specimens of 0.15% sandwich deep beam group.
Figure 19. Ultimate loading condition 0.15% deep beam
Figure 20. Ultimate loading condition 0.15%- 200 mm deep beam
Figure 21. Ultimate loading condition 0.15%- 300 mm deep beam
Figure 22. Ultimate loading condition 0.15%- 400 mm deep beam
6.2 Modes of failure of 0.25% sandwich deep beam specimens
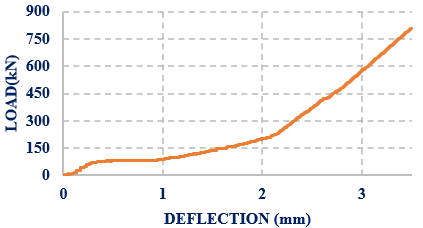
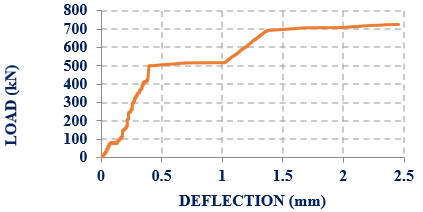
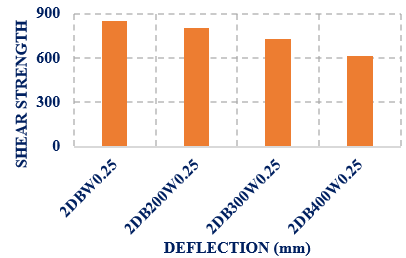
Figure 23 shows the behaviour of the control specimen (2DBW0.25) under the initial and ultimate loading condition at 490 kN and 847.8 kN load. It shows deflection of 0.93 mm at an initial diagonal crack load of 490 kN and 2.22 mm at the ultimate diagonal crack load 847.8 kN. Table 3 show the experimental load values. Figure 24 shows the behaviour of 2DB200W0.25 under initial and ultimate loading condition at 427.9 kN and 805.4 kN load. It shows deflection of 2.67 mm at the initial diagonal crack load of 805.4 kN and 3.5 mm at ultimate diagonal crack load 805.4 kN. Figure 25 shows the behaviour of 2DB300W0.25 under initial and ultimate loading condition at 409 kN and 727.3 kN load. It shows deflection of 0.356 mm at the initial diagonal crack load of 409 kN and 2.45 mm at ultimate diagonal crack load 727.3 kN. Figure 26 shows the behaviour of 2DB400W0.25 under initial and ultimate loading condition at 345 kN and 613.3 kN load. It shows deflection of 0.26 mm at an initial diagonal crack load of 345 kN and 0.831 mm at ultimate diagonal crack load kN. Figure 27 shows the shear strength comparison of 0.25% control specimen along with varying insulation pad depths of 200 mm, 300 mm, 400mm specimens shows that 2DBW0.25 specimen gives better results compare other specimens. And 2DB200W0.25 shear strength results are nearly equal to control specimen remaining will fail at 427.7 kN, 490 kN. When increasing the depth of core material decreases the shear strength of specimens.
Figure 23. Load vs deflectionof 0.25% control specimen
Figure 24. Load vs deflectionof 0.25%-200mm deep beam
Figure 25. Load vs deflectionof 0.25%-300mm deep beam
Figure 26. Load vs deflectionof 0.25%-400 deep beam
Figure 27. Shear strength comparison of 0.25% deep beam
6.2.1 Crack patterns, failure modes and crack widths
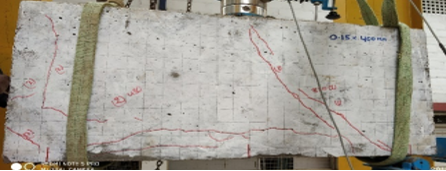
Figure 29 shows a crack pattern of 0.25% 200 mm specimen of 0.01 mm, 0.02 mm at initial loading point of 427.9 kN and 0.1 mm, 0.3 mm crack width at 805.4 kN. Figure 30 shows a crack pattern of 0.25% 300 mm specimen of 0.02 mm, 0.03,0.04 mm at initial loading point of 409 kN and 0.2 mm,0.3mm, 0.4 mm crack width at 727.3 kN. Figure 31 shows a crack pattern of 0.25% 400 mm specimen of 0.03 mm, 0.04 mm at initial loading point of 345 kN and 0.1 mm, 0.3 mm crack width at 613.3 kN.
The ultimate load of 2DBW0.25 with initial crack of 2DB200W0.25, 2DB300W0.25, and 2DB400W0.25 specimens 42.20%, 49.52%, 51.75% and 59.30%. That shear strength of 2DB200W0.25 gives better comparative results compare to other specimens of 0.25% sandwich deep beam group.
Figure 28. Ultimate loading condition 0.25 deep beam
Figure 29. Ultimate loading condition 0.25%- 200 mm deep beam
Figure 30. Ultimate loading condition 0.25%-300 mm deep beam
Figure 31. Ultimate loading condition 0.25%- 400 mm deep beam
6.3 Modes of Failure of 0.35% sandwich deep beam specimens
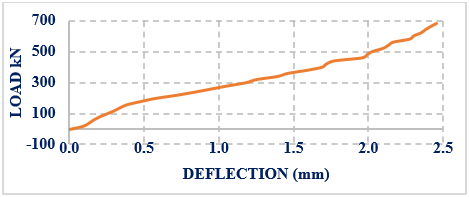
Figure 32 shows the behaviour of the control specimen (3DBW0.35) under the initial and ultimate loading condition at 500 kN and 978.4 kN load. It shows deflection of 0.542 mm at an initial diagonal crack load of 490 kN and 2.42 mm at the ultimate diagonal crack load 978.4 kN. Table 3 show the experimental load values.
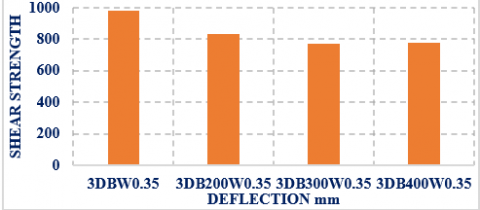
Figure 33 shows the behaviour of 3DB200W0.35 under initial and ultimate loading condition at 467.9 kN and 831.6 kN load. It shows deflection of 1.238 mm at the initial diagonal crack load of 467.9 kN and 2.22 mm at ultimate diagonal crack load 831.6 kN. Figure 34 shows the behaviour of 3DB300W0.35 under initial and ultimate loading condition at 400 kN and 771 kN load. It shows deflection of 1.485 mm at the initial diagonal crack load of 400 kN and 2.439 mm at ultimate diagonal crack load 771 kN. Figure 35 shows the behaviour of 3DB400W0.35 under initial and ultimate loading condition at 440 kN and 780 kN load. It shows deflection of 1.77 mm at an initial diagonal crack load of 440 kN and 2.453 mm at ultimate diagonal crack load 780 kN. Figure 36 shows the shear strength comparison of 0.35% control specimen along with varying insulation pad depths of 200 mm, 300 mm, 400mm specimens shows that 3DBW0.35 specimen gives better results compare other specimens. And 3DB200W0.35 shear strength results are nearly equal to control specimen remaining will fail at 500 kN, 467.9 kN When increasing the depth of core material decreases the shear strength of specimens.
Figure 32. Load vs deflection for 0.35% control specimen
Figure 33. Load vs deflection for 0.35%-200mm deep beam
Figure 34. Load vs deflection for 0.35%-300mm deep beam
Figure 35. Load vs deflection for 0.35%-400mm deep beam
Figure 36. Shear strength comparison of 0.35% deep beam
6.3.1 Crack patterns, failure modes and crack widths
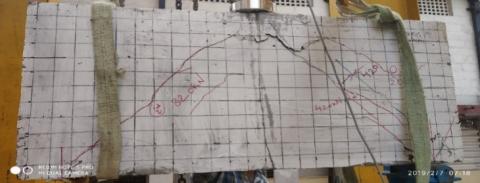
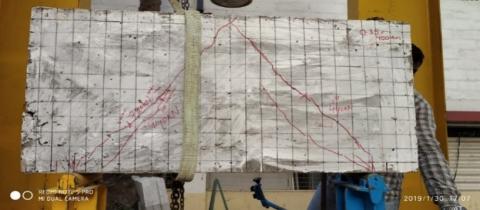
Figure 38 shows a crack pattern of 0.35% 200 mm specimen of 0.02 mm, 0.03 mm, 0.05mm at initial loading point of 467.9 kN and 0.1 mm, 0.3 mm crack width at 831.6 kN. Figure 39 shows a crack pattern of 0.35% 300 mm specimen of 0.03 mm,0.004 mm at initial loading point of 400 kN and 0.2 mm,0.3mm, 0.4 mm crack width at 771 kN.Figure 40 shows a crack pattern of 0.35% 400 mm specimen of 0.02 mm, 0.04 mm at initial loading point of 440 kN and 0.1 mm, 0.3 mm crack width at 780 kN.
Figure 37. Ultimate loading condition 0.35 deep beam
Figure 38. Ultimate loading condition 0.35%- 200 mm deep beam
Figure 39. Ultimate loading condition 0.35%- 300 mm deep beam
Figure 40. Ultimate loading condition 0.35%- 400 mm deep beam
The ultimate shear strength [12] of 3DBW0.35 shows that 3DB200W0.35 has 47.82%, 3DB300W0.35 has 40.8%, and 3DB400W0.35 has 44.97%. In that 3DB200W0.35 had high shear strength influence of 47.82 % and 3DB300W0.35 had low shear strength influence on ultimate shear strength 40.8% of deep beam. Details of initial crack, ultimate crack of shear strength percentages (0.15%, 0.25%, and 0.35%) as shown in Table 3.
Figure 41 shows the shear behavior of reinforced concrete [16, 17] deep beams with different shear reinforcement percentages of 0.15%, 0.25%, and 0.35% along vertical and horizontal direction of the beam, in that control specimens of 3DBW0.35 shows better results compare to 1DBW0.15 and 2DBW0.25 due to increase in percentage in 3DBW0.35 along web shear reinforcement. And compare the other beams other than control specimens 0.35% web reinforcement shows better results compare to beams.
Table 3. Details of experimental data
|
Beam Designation |
Vd |
Vu |
Δi |
Δu |
Wi |
Wu |
Mode of Failure |
|
DBW0.15 |
490 |
773 |
1.6 |
2.53 |
0.01, 0.03 |
0.1, 0.2 |
DSF |
|
DB200W0.15 |
359 |
639.1 |
0.915 |
2.15 |
0.02, 0.03 |
0.2, 0.4 |
DSF |
|
DB300W0.15 |
327 |
507.1 |
0.329 |
2.01 |
0.03, 0.05 |
0.3,0.4 |
DSF |
|
DB400W0.15 |
315 |
430 |
0.3 |
1.35 |
0.02, 0.03 |
0.2,0.3 |
DSF |
|
2DBW0.25 |
490 |
847.8 |
0.93 |
2.2 |
0.02,0.03 |
0.2, 0.3 |
DSF |
|
2DB200W0.25 |
427.9 |
805.4 |
2.67 |
3.5 |
0.01,0.02 |
0.1, 0.3 |
DSF |
|
2DB300W0.25 |
409 |
727.3 |
0.356 |
2.45 |
0.02, 0.03, 0.04 |
0.2, 0.3, 0.4 |
DSF |
|
2DB400W0.25 |
345 |
613.3 |
0.26 |
0.83 |
0.03, 0.04 |
0.1, 0.3 |
DSF |
|
3DBW0.35 |
500 |
978.4 |
0.542 |
2.42 |
0.01, 0.03 |
0.2, 0.3 |
DSF |
|
3DB200W0.35 |
467.9 |
831.6 |
1.238 |
2.22 |
0.02, 0.03, 0.05 |
0.1, 0.3 |
DSF |
|
3DB300W0.35 |
400 |
771 |
1.485 |
2.43 |
0.03,0004 |
0.2, 0.3, 0.4 |
DSF |
|
3DB400W0.35 |
440 |
780 |
1.77 |
2.45 |
0.02, 0.04 |
0.1, 0.3 |
DSF |
Note: Vd states that initial diagonal crack load in kN, Vu states that ultimate diagonal crack load in kN, Δi states that initial deflection in mm, Δu states that final deflection mm, Wi states that initial crack load crack width in mm, Wu states that ultimate load crack width in mm, and DSF states that diagonal shear failure of deep beam.
Figure 41. Load vs Deflection comparison of 0.15%, 0.25%, and 0.35% reinforcement deep beams
The present study displays the discoveries of an experimental program concocted to research the variation of insulation pad depths in the centre of the deep beams. The width of a deep beam is unimportant on shear conduct for a/d proportion 0.95. At the initial and ultimate stage ofloading diagonal crack dominates the flexural crack:
[1] Zhang, N., Tan, K.H. (2007). Size effect in RC deep beams: Experimental investigation and STM verification. Engineering Structures, 29(12): 3241-3254. https://doi.org/10.1016/j.engstruct.2007.10.005
[2] Rao, G.A., Sundaresan, R. (2012). Evaluation of size effect on shear strength of reinforced concrete deep beams using refined strut-and-tie model. Sadhana, 37(1): 89-105. https://doi.org/10.1007/s12046-012-0068-2
[3] Karihaloo, B.L. (1995). Fracture mechanics & structural concrete. Longman Scientific and Technical Publishers, John Wiley, USA. https://doi.org/10.1007/bf00035376
[4] Daniel, I.M., Gdoutos, E.E. (2009). Failure modes of composite sandwich beams. Major Accomplishments in Composite Materials and Sandwich Structures, Springer, Dordrecht. https://doi.org/10.1007/978-90-481-3141-9_9
[5] Rao, G.A., Sundaresan, R. (2014). Size dependent shear strength of reinforced concrete deep beams based on refined strut-and-tie model. Advanced Materials Research, 931-932: 468-472. https://doi.org/10.4028/www.scientific.net/AMR.931-932.468
[6] Tan, K.H., Cheng, G.H., Zhang, N. (2008). Experiment to mitigate size effect on deep beams. Magazine of Concrete Research, 60(10): 709. https://doi.org/10.1680/macr.2007.00030
[7] Oh, J.K., Shin, S.W. (2001). Shear strength of reinforced high-strength concrete deep beams. Structural Journal, 98(2): 164-173. https://doi.org/10.14359/10184
[8] IS: 456 – 2000, Code of practice for Plain and Reinforced Concrete, Bureau of Indian Standards, New Delhi, India. https://doi.org/10.14359/15584
[9] David, B.B., Tuchscherer, R.G., Huizinga, M., Bayrak, O. (2014). Minimum web reinforcement in deep beams. ACI Structural Journal, 111(1): 224-225. https://doi.org/10.14359/51684409
[10] Tan, K.H., Kong, F.K., Teng, S., Guan, L. (1995). High-strength concrete deep beams with effective span and shear span variations. Structural Journal, 92(4): 395-405. https://doi.org/10.14359/991
[11] Birrcher, D.B., Tuchscherer, R.G., Huizinga, M., Bayrak, O. (2013). Minimum web reinforcement in deep beams. ACI Structural Journal, 110(2). https://doi.org/10.14359/51684409
[12] Albidah, A., Abadel, A., Abbas, H., Almusallam, T., Al-Salloum, Y. (2019). Experimental and analytical study of strengthening schemes for shear deficient RC deep beams. Construction and Building Materials, 216: 673-686. https://doi.org/10.1016/j.conbuildmat.2019.05.024
[13] Duthinh, D. (2000). Shear strength of high-strength concrete walls and deep beams. No. NIST Interagency/Internal Report (NISTIR)-6495. https://doi.org/10.6028/nist.ir.6495
[14] Leon, R.J., Rao, G.A. (2013). Performance of RC deep beams with different combinations of web reinforcement. Applied Mechanics and Materials, 343: 21-26. https://doi.org/10.4028/www.scientific.net/AMM.343.21
[15] CSA Committee A23.3, Design of Concrete Structures: Structures, Canadian Standards Association. https://doi.org/10.3403/00785263u
[16] ACI Committee 318. Building Code Requirements for Structural Concrete (ACI 318-08) (318R-08) and Commentary. American Concrete Institute, Farmington Hills, MI, 2008, p. 465. https://doi.org/10.1201/9781420007657.ch36
[17] ACI Committee 318. Building Code Requirement of Reinforced Concrete. Farmington Hills, MI: American ConcreteInstitute, 2014. https://doi.org/10.2749/101686612x13291382990967