Harikrishna Ponnam* | Jakeer Hussain Shaik
© 2020 IIETA. This article is published by IIETA and is licensed under the CC BY 4.0 license (http://creativecommons.org/licenses/by/4.0/).
OPEN ACCESS
The exact discovery of R-peak becomes very much crucial while extracting prominent features from Electrocardiogram (ECG) signal. However, identification of R-peaks precisely becomes more challenging due to contamination of noise and fragmented QRS complexes. This paper presents an improved method of marking R-peaks. Initially, an efficient Fourier Decomposition Methodology (FDM) is used for removing noise. The accuracy of finding R-peaks can be improved by enhancing the QRS complexes using Teager Energy Operator. Hilbert Transform and Zero Cross Detector (ZCD) are used for marking the R-peaks. The MIT-BIH arrhythmia database is used for validating the proposed scheme and attained 99.97% accuracy, 99.98% of sensitivity and 99.98% of positive predictivity. The findings proved that proposed method is superior as compared to the proven techniques in the literature.
Fourier decomposition method, Hilbert Transform, Teager Energy Operator, Zero Cross Detector, R-peaks
The ECG signal is evolved as an extensively used rapid investigation tool to monitor cardiac abnormalities. It can give useful information about the functionality of the cardiovascular system. The threat of cardiovascular diseases is growing in India. The occurrence of cardiovascular diseases in India was estimated to be 5.45 cores in the year 2016 [1]. The ECG signal analyses and accurate detection of feature points take a big part in the identification of cardiac abnormalities. The standard ECG signal consists of five characteristic waves: P wave, Q wave, R wave, S wave and T wave. Ascertaining accurate R-peaks becomes a benchmark for the extraction of remaining all fiducial points [2]. Nonetheless, Morphology of the ECG gets affected owing to the variation in the characteristic waves and noise interference. So, computer-aided diagnosis is required to precisely delineate the R-wave to assist physicians and doctors with appropriate medical intervention. Conventionally, the wave functions were identified by both time and frequency domain signal processing technique [3, 4].
In recent developments, various wavelets transform techniques [5], time-frequency distribution of S-transform [6, 7], Circulant matrix-based continuous wavelet transform [8]. and convolution window [9] was used for ascertain R-peaks. However, correct marking of the R-peaks remains an open problem.
The primary objective of this work is to emphasizing the R wave and suppressing the effect of other wave functions while delineating the R-waves. In this work simple and efficient FDM is used for preprocessing of the ECG signal. The combination of Teager Energy Operator (TEO), Hilbert Transform (HT) and Zero Cross Detector (ZCD) is used for implementing the peak finding Logic. In our proposed work, FDM has applied for denoise the ECG signal by suppressing the BW and PLI. In the subsequent stage, TEO is calculated to enhance the R-waves. At last, Hilbert Transform and Zero Cross Detector are used for reliable estimation of R-waves and its peak positions.
The reminder of the paper has been ordered as follows. We will present the previous research concerning to field of R-peak identification in the second section. Section 3, presented proposed R-peak identification methodology. Performance assessment this work and shown results in Section 4. In section 5 the work is concluded.
The reliable finding of R-peaks is the most significant part while extracting characteristics of the ECG signal. Hence numerous R-peak finding techniques are proposed in the literature. At first, identification of the QRS complex was established by Pan and Tompkins [10] using linear filtering and nonlinear processing techniques. Linear filtering composed by high pass and low pass filters is used for attenuate the noise. Differentiation, squaring and moving window integration are employed in nonlinear processing to generate the signal which consists of slope, amplitude and width information of QRS complex. Adaptive thresholds are used for marking the R-peaks in the signal. Hamilton and Tompkins [11] have refined the decision rules to improve the efficiency of marking R-peaks. Later various derivative-based approaches [4-11] have been developed for locating R-peaks. Another method Empirical Mode Decomposition (EMD) decomposes the signal into different functions and process at different frequency ranges [8], but it has a problem of low frequency resolution. Digital filters [12-14] also implemented for the elimination of noise and improving accuracy. These are optimum compared with standard FIR filters. Nonlinear energy operator and simple thresholding technique has also been used for efficient marking of R-Peaks [15-17]. Fractional Stock well transform is a combination of fractional fourier transform and Stockwell transform has been used by Bajaj and Kumar [18]. It becomes a popular tool for analyzing the time varying signals. Shannon Energy Envelope (SEE) is the average spectrum energy, and it is an improved method of marking R-peaks [19, 20]. The quality of the ECG signal determines the proficiency of identifying R-waves and its peaks. Over decades the proposed techniques have mainly two parts: the preprocessing stage and peak finding logic. Preprocessing of the signal is mainly employed for denoising the signal and enhancing the required wave function. For efficient detection of R-peaks, a peak finding method is used. Various preprocessing techniques peak finding methods are described in the literature but reliable identification of R-peaks remains an open challenge. The combination of Fourier decomposition methodology and Teager Energy Operator is used at the preprocessing stage and Hilbert Transform and Zero Cross Detector are used at the second stage for reliable identification of R-peaks.
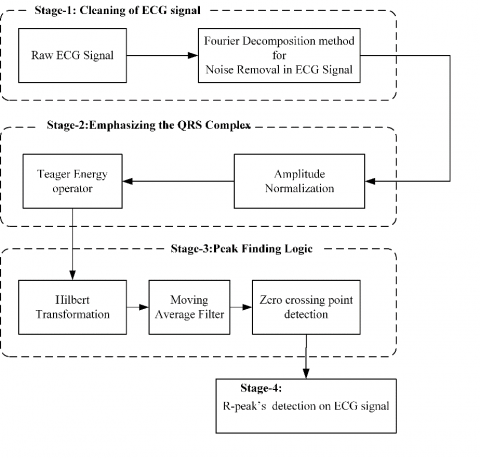
The proposed method for accurate identification of R-Peaks is depicted in Figure 1. It consists of four different stages i.e. cleaning of ECG signal, Emphasizing the QRS complex, Peak finding logic and R-peaks detection. Initially, Fourier Decomposition Method (FDM) is applied as a part of preprocessing to remove the noise. The FDM uses DFT and IDFT based zero-phase filter bank, to break down the given signal into multiple frequency bands and regenerate filtered signal from the required frequency components. Furthermore, FDM is the most effective way of cleaning the ECG signal. It can be done by eradicating the BW and PLI [21]. An amplitude normalization and Teager Energy Operator (TEO) is calculated in the second stage to emphasize the QRS complexes. TEO gives instantaneous frequency of the signal and also more sensitive to sudden changes. Initially, it was used for nonlinear signal processing and found many applications in speech signal analysis. It will also reduce the effect of P- peak and T-peak while detecting R-peaks. The generated TEO Signal enhances the R-wave function and plays a significant part in finding the R-peaks in the proposed algorithm. The third stage is designed using the combination of HT and ZCD for detection of R-peaks. Accurate detection of local maxima is possible by finding Zero cross points on the Hilbert Transformation of TEO signal. Finally, the original R-peaks on ECG signal can be detected by projecting zero cross points on to the original ECG signal. The following subsections describe all the stages in detailed.
3.1 Fourier decomposition method for noise suppression
The ECG signals can be distorted by multiple noise sources, which include PLI, BW, electrode contact noise and motion artifacts, etc. Owing to these noises the reliable identification of R-Peaks becomes complicated. Different methodologies are formulated in the literature over the years to remove PLI and BW from the ECG signal. Some of these methods use high pass filters for removing PLI and low pass filters to remove BW. However, these methods generate computational delays and nonlinear phase distortion [22-25]. This can be addressed by exploiting the advantage of Zero phase filter bank [26]. Another popular approach is signal decomposition using discrete wavelet transforms [27-29] for ECG denoising, but noise is present at various levels of detailed coefficients. Thus, removing these coefficients eliminates the noise and sometimes it leads to loss required information also. In this paper, we are using FDM which clearly outperformed all other methods. FDM decomposes the given signal into a set of various frequency bands [21].
Figure 1. Block diagram of improved R-peak marking method
Figure 2. Block diagram of Frequency Decomposition Method
The Discrete Fourier Transform (DFT) based zero-phase filter bank is used for implementing the FDM. The block diagram of the FDM technique using Zero phase filtering is described in Figure 2.
The given ECG signal y[n] is break down into a set of orthogonal frequency bands using the following signal decomposition
$y[n]=b_{0}+\sum_{i=1}^{M} y_{i}[n]$ (1)
Here b0 is average value of the Signal y[n], and {y1[n], y2[n], y3[n], … yk[n]} are Fourier intrinsic band functions. Consider frequency below 0.7 Hz as baseline wander frequency and 50 Hz and above as powerline interference. The frequency response of ith band in the filter-bank can be obtained by defining Hi[k] = 1 for the required band of frequencies and zero for the range of noise frequencies (below 0.7 Hz and above 50Hz). Mathematically the filter bank can be defined as
$\left.\begin{array}{rl}
\mathrm{H}_{\mathrm{i}}[\mathrm{k}]=0, & \left(\mathrm{k}_{\mathrm{i}-1}+1\right) \leq \mathrm{k} \leq\left(\mathrm{N}-\mathrm{k}_{\mathrm{i}}\right) \\
=0, & \left(\mathrm{N}-\mathrm{k}_{\mathrm{i}}\right) \leq \mathrm{k} \leq \mathrm{N}-\mathrm{k}_{\mathrm{i}-1}-1 \\
=1, & \text { otherwise }
\end{array}\right\}$ (2)
where, i is 1, 2…M using inverse discrete Fourier transform (IDFT) operation, the signal components yj[n] are obtained as
$\mathrm{y}_{\mathrm{i}}[\mathrm{n}]=\sum_{\mathrm{k}=0}^{\mathrm{N}-1}\left[\mathrm{H}_{\mathrm{i}}[\mathrm{k}] \mathrm{Y}[\mathrm{k}] \exp \left(\frac{\mathrm{j} 2 \pi \mathrm{kn}}{\mathrm{N}}\right)\right]$ (3)
where, Y[k] is discrete Fourier transform of y[n].
The proposed zero phase filter bank preserve the significant features like positions of all peaks. So that we can extract meaningful information from filtered ECG signal. However, the computational complexity also reduced by implementing the required DFT and IDFT using fast Fourier transform (FFT) algorithm. Figure 3 illustrate the performance of FDM for Denoising the ECG signal. Figure 3 (a) depicts the Original ECG signal y[n], Figure 3 (b) shows the 0.2Hz frequency noise which resembles the BW, Figure 3 (c) illustrate the 50Hz frequency noise which resembles the PLI, Figure 3 (d) shows the noise contaminated signal generated by adding all the above three signal. The filtered ECG signal is shown in Figure 3 (e) after applying FDM.
3.2 Amplitude normalization and Teager energy signal generation
This is the second step of the proposed method to identify R-peak. In this step, we implemented both amplitude normalization and generation of TEO signal for emphasizing the QRS complexes in the ECG signal. Normalization of the signal is useful for better discrimination of positive peaks and negative peaks. By doing this we can limit the signal amplitude to [-1, 1]. We normalize the signal y (n) by
$\check{\mathrm{y}}(\mathrm{n})=\frac{\mathrm{y}(\mathrm{n})}{\max _{\mathrm{n}-1}^{\mathrm{N}}(|\mathrm{y}[\mathrm{n}]|)}$ (4)
Figure 3. Illustration of denoising ECG signal
Figure 4. Identifying R-peaks using proposed method
where, each sample of y (n) is divided by maximum value of the signal. Amplitude normalization improves the detection of negative R-peaks. The primary purpose of generating TEO signal is to boost the original amplitudes of R-peaks. It was originally created by Kaiser [21]. TEO for a signal $\breve{\mathrm{y}}(\mathrm{n})$ in its discrete form can be generated by using following equation:
$\Psi_{y}[n]=\breve{y}(n)^{2}-\breve{y}(n-1) * \breve{y}(n+1)$ (5)
The TEO has been commonly used as a peak detector in many applications. Using TEO, it is possible to reduce the effect of P and T waves for reliable identification of R-peaks.
3.3 Accurate R-peak detection
From many years, the position of R-peaks is detecting by comparing the amplitude of the signal with the predefined threshold values. The secondary threshold value and search back methods are also exploited for reduction of errors. Nevertheless, in the case of diseased patient with varying wave function characteristics the search back mechanism with the second threshold value also does not give efficient results. In this work, HT and ZCD are used to construct a novel automatic R-peaks finding technique. The Figure 4 depicts how the HT signal identifies the R-peaks by marking its zero crossing points using Zero Cross Detector. This eliminates the complexity of comparison with various threshold values.
The HT of given signal z (t) is defined as
$\tilde{z}(t)=H[z(t)]=\frac{1}{\pi t} * z(t)=\frac{1}{\pi} \int_{-\alpha}^{\alpha} \frac{z(\tau)}{t-\tau} d \tau$ (6)
The process of finding R-peaks is depicted in Figure 4. Filtered ECG signal is shown in the Figure 4 (a). How the QRS complexes are enhanced in generated TEO signal is depicted in Figure 4 (b). Figure 4 (c) Illustrating the positive zero crossing points in the HT signal. Figure 4 (c) shows the identified R-peaks on the given ECG signal. Locating R-Peaks is difficult in the case of fragmented QRS complexes and low-frequency drift in the signal. To overcome this HT signal is passed through the Moving Average filter. The location of positive zero crossing points on the HT signal represents the R-peaks. which can resemble the positions of R-Peaks. By projecting these locations on the ECG signal, we can find the R-Peaks with ±20 samples. By searching the point which is more away from the zero-dc line in the searching window of ±20 samples of the identified R-peak locations in the previous test we can find the original R-peak locations.
The proposed work is evaluated using the well-known Massachusetts Institute of Technology-Beth Israel Hospital (MIT-BIH) arrhythmia database [30]. This repository contains 48 ECG recordings, which are sampled at a rate of 360 Hz. The quality of these records is acceptable for performing the performance evaluation of proposed method. It was implemented on MATLAB 2018a. To validate the proposed work, we considered different performance metrics. Which are percentage of sensitivity (Se), percentage of positive predictivity (+P), percentage of detection error rate (DER) and percentage of accuracy (ACC) are chosen. The performance metrics are calculating using the following equations.
$\begin{array}{c}
\operatorname{Se}(\%)=\frac{T P}{T P+F N} X 100 \% \\
+P(\%)=\frac{T P}{T P+F P} X 100 \% \\
D E R(\%)=\frac{F P+F N}{T P} X 100 \% \\
A C C(\%)=\frac{T P}{T P+F P+F N} X 100 \%
\end{array}$
Here the true positive (TP) represents the exact identification of R-peaks, false positive (FP) represents the number of false identified R-peaks, false negative (FN) represents the number of missing R-peaks. The experimental results for illustrating the efficiency of the proposed method are summarized in Table 1. The observed error rate of 0.19%, which is optimum among the methodologies taken from the proven literature. The records which are having baseline below the origin are giving more error rate. Record 232 has a number of long pauses, although our method performed well as shown in the Figure 5. The ECG record 232 is depicted in Figure 5 (a). Filtered ECG record 232 is shown in Figure 5 (b). TEO signal generated is depicted in Figure 5 (c). Figure 5(d) Illustrating the positive zero crossing points on HT signal. The Identified R-peaks on record-232 is shown in Figure 5 (e).
It was observed that an accuracy of 99.97%, the sensitivity of 99.98% and positive prediction of 99.98% is achieved with the proposed method. The efficiency of the given R-peaks finding technique is compared with other exiting methodologies and summarized in Table 2. It shows the significant improvement compared with the techniques which use the non-linear filtering in their preprocessing stage [15-18]. and comparable results with the Fractional Fourier transform [14], S-transform [19], and wavelet transforms [20]. The proposed methodology works well in the presence of high frequency PLI and low frequency BW without affecting other features of the ECG signal.
Table 1. Performance evaluation of the proposed R-peak finding method using MIT-BIH arrhythmia database
|
Record No. |
Total (beats) |
TP (beats) |
FN (beats) |
FP (beats) |
DER (%) |
Se (%) |
+P (%) |
Accuracy (%) |
|
100 |
2273 |
2273 |
0 |
0 |
0.00 |
100 |
100 |
100 |
|
101 |
1865 |
1864 |
1 |
0 |
0.05 |
99.95 |
100 |
99.95 |
|
102 |
2187 |
2187 |
0 |
0 |
0.00 |
100 |
100 |
100 |
|
103 |
2084 |
2084 |
0 |
0 |
0.00 |
100 |
100 |
100 |
|
104 |
2229 |
2229 |
0 |
0 |
0.00 |
100 |
100 |
100 |
|
105 |
2572 |
2571 |
1 |
0 |
0.04 |
99.96 |
100 |
99.96 |
|
106 |
2027 |
2027 |
0 |
1 |
0.05 |
100 |
99.95 |
99.95 |
|
107 |
2137 |
2137 |
0 |
0 |
0.00 |
100 |
100 |
100 |
|
108 |
1763 |
1761 |
2 |
1 |
0.17 |
99.89 |
99.94 |
99.83 |
|
109 |
2532 |
2532 |
0 |
0 |
0.00 |
100 |
100 |
100 |
|
111 |
2124 |
2124 |
0 |
0 |
0.00 |
100 |
100 |
100 |
|
112 |
2539 |
2539 |
0 |
0 |
0.00 |
100 |
100 |
100 |
|
113 |
1795 |
1795 |
0 |
0 |
0.00 |
100 |
100 |
100 |
|
114 |
1879 |
1879 |
0 |
0 |
0.00 |
100 |
100 |
100 |
|
115 |
1953 |
1952 |
1 |
1 |
0.10 |
99.95 |
99.95 |
99.90 |
|
116 |
2412 |
2409 |
3 |
1 |
0.17 |
99.88 |
99.96 |
99.83 |
|
117 |
1535 |
1535 |
0 |
0 |
0.00 |
100 |
100 |
100 |
|
118 |
2278 |
2278 |
0 |
1 |
0.04 |
100 |
99.96 |
99.96 |
|
119 |
1987 |
1987 |
0 |
0 |
0.00 |
100 |
100 |
100 |
|
121 |
1863 |
1863 |
0 |
0 |
0.00 |
100 |
100 |
100 |
|
122 |
2476 |
2476 |
0 |
0 |
0.00 |
100 |
100 |
100 |
|
123 |
1518 |
1518 |
0 |
0 |
0.00 |
100 |
100 |
100 |
|
124 |
1619 |
1619 |
0 |
0 |
0.00 |
100 |
100 |
100 |
|
200 |
2601 |
2601 |
0 |
0 |
0.00 |
100 |
100 |
100 |
|
201 |
1963 |
1963 |
0 |
0 |
0.00 |
100 |
100 |
100 |
|
202 |
2136 |
2136 |
0 |
0 |
0.00 |
100 |
100 |
100 |
|
203 |
2980 |
2978 |
2 |
0 |
0.07 |
99.9 |
100 |
99.93 |
|
205 |
2656 |
2656 |
0 |
0 |
0.00 |
100 |
100 |
100 |
|
207 |
1862 |
1862 |
0 |
0 |
0.00 |
100 |
100 |
100 |
|
208 |
2955 |
2951 |
0 |
2 |
0.07 |
100 |
99.93 |
99.93 |
|
209 |
3005 |
3005 |
0 |
0 |
0.00 |
100 |
100 |
100 |
|
210 |
2650 |
2648 |
2 |
0 |
0.08 |
99.92 |
100 |
99.92 |
|
212 |
2748 |
2744 |
0 |
0 |
0.00 |
100 |
100 |
100 |
|
213 |
3251 |
3251 |
0 |
0 |
0.00 |
100 |
100 |
100 |
|
214 |
2262 |
2261 |
1 |
1 |
0.09 |
99.96 |
99.96 |
99.91 |
|
215 |
3363 |
3363 |
0 |
0 |
0.00 |
100 |
100 |
100 |
|
217 |
2208 |
2207 |
1 |
0 |
0.05 |
99.95 |
100 |
99.95 |
|
219 |
2154 |
2154 |
0 |
0 |
0.00 |
100 |
100 |
100 |
|
220 |
2048 |
2048 |
0 |
0 |
0.00 |
100 |
100 |
100 |
|
221 |
2427 |
2427 |
0 |
0 |
0.00 |
100 |
100 |
100 |
|
222 |
2483 |
2483 |
0 |
0 |
0.00 |
100 |
100 |
100 |
|
223 |
2605 |
2604 |
1 |
0 |
0.04 |
99.96 |
100 |
99.96 |
|
228 |
2053 |
2051 |
2 |
0 |
0.10 |
99.90 |
100 |
99.90 |
|
230 |
2256 |
2256 |
0 |
0 |
0.00 |
100 |
100 |
100 |
|
231 |
1571 |
1569 |
2 |
0 |
0.13 |
99.87 |
100 |
99.87 |
|
232 |
1780 |
1780 |
0 |
3 |
1.011 |
100 |
98.99 |
98.99 |
|
233 |
3079 |
3077 |
2 |
0 |
0.06 |
99.94 |
100 |
99.94 |
|
234 |
2753 |
2753 |
0 |
0 |
0.00 |
100 |
100 |
100 |
|
Total |
1,09,496 |
109467 |
21 |
11 |
0.19 |
99.98 |
99.98 |
99.97 |
Table 2. Comparison of R-peak identification methods
|
Ref. |
Methodology |
|
|
FP (beats) |
FN (beats) |
Se (%) |
+P (%) |
Acc (%) |
|
|
Preprocessing Stage |
Improving the QRS Complex |
Peaks identification method |
|
|
|
|
|
|
[14] |
Median filter and SG smoothing filtering |
RMS value of third power of ECG |
Threshold based Peak detection |
428 |
509 |
99.50 |
99.56 |
99.08 |
|
[15] |
Filtering with LPF and HPF |
Teager Energy Operator |
Threshold based Peak detection |
33 |
285 |
99.74 |
99.97 |
99.71 |
|
[16] |
Digital FIR Filtering’ |
Squaring, MA Filter and Normalization |
Adaptive Threshold Operation |
182 |
184 |
99.83 |
99.83 |
99.66 |
|
[17] |
Shift Invariant Wavelet Transform (ShIWT) |
Nonlinear Energy Operator (NEO) |
Simple Thresholding Operation |
254 |
264 |
99.75 |
99.76 |
99.52 |
|
[18] |
Fractional Fourier Transform |
Fractional Stock well Shannon energy (FrSS) |
Threshold based on the FrSS envelope and search back method |
67 |
46 |
99.95 |
99.93 |
99.89 |
|
[19] |
Discrete Wavelet Transform |
Modified Shannon Energy Envelope |
Peak Energy determination |
99 |
79 |
99.93 |
99.91 |
99.83 |
|
[20] |
S-Transform |
Shannon Energy Envelope |
Threshold based Peak detection |
97 |
171 |
99.84 |
99.81 |
99.66 |
|
Proposed Method |
Fourier decomposition method |
Teager Energy operator |
Hilbert Transform and positive zero cross point detection technique |
11 |
21 |
99.98 |
99.98 |
99.97 |
Figure 5. Illustration of R-peaks identified on record-232 using proposed method
An improved peak finding methodology for the reliable detection of R-peaks described in four stages, which exploits the advantages of Fourier decomposition, Teager Energy Operator and Hilbert Transform. The preprocessor is implemented based on Fourier decomposition method using Zero phase filter bank which can eliminate the PLI and BW more efficiently without affecting required peak positions and other features of the signal. The QRS complexes are improved by TEO that significantly increases the accuracy of R-peaks detection. The HT and positive ZCD are used for identification of R-peaks. Comparison of amplitude thresholds is not required in this approach. The experimental results are presented and compared with the existing studies. The standard MIT-BIH database is used for evaluating the effectiveness of the proposed method. The proposed methodology improved the results and achieved accuracy of 99.97%, sensitivity of 99.98% and positive predictivity of 99.98%. From Table 2, it is observed that the proposed method gives a higher accuracy as compare to the existing methods.
[1] Rangayyan, R.M. (2015). Biomedical Signal Analysis, 2. John Wiley & Sons. http://dx.doi.org/10.1002/9781119068129
[2] Rangayyan, R.M. (2002). Biomedical Signal Analysis. Wiley-IEEE Press. http://dx.doi.org/10.1109/9780470544204
[3] Zidelmal, Z., Amirou, A., Adnane, M., Belouchrani, A. (2012). QRS detection based on wavelet coefficients. Computer Methods and Programs in Biomedicine. Elsevier Ireland Ltd, 107(3): 490-496. http://dx.doi.org/10.1016/j.cmpb.2011.12.004
[4] Ponnam, H., Shaik, J.H. (2020). Circulant matrix-based continuous wavelet transform for achieving low complexity electrocardiogram feature extraction in health monitoring applications. Journal of Computational and Theoretical Nanoscience, 17(1): 254-259. http://dx.doi.org/10.1166/jctn.2020.8659
[5] Harikrishna, P., Hussain, S.J. (2019). A comprehensive review on accurate QRS and T wave detection techniques for confirming cardiac abnormalities. 2019 International Conference on Recent Advances in Energy-Efficient Computing and Communication. (ICRAECC). http://dx.doi.org/10.1109/ICRAECC43874.2019.8995091
[6] Bouaziz, F., Boutana, D. Benidir, M. (2014). Multiresolution wavelet-based QRS complex detection algorithm suited to several abnormal morphologies. IET Signal Processing, 8(7): 774-782. http://dx.doi.org/10.1049/iet-spr.2013.0391
[7] Biswal, B. (2017). ECG signal analysis using modified S-transform. Healthcare Technology Letters, 4(2): 68-72. http://dx.doi.org/10.1049/htl.2016.0078
[8] Li, H.Q., Wang, X.F., Chen, L., Li, E.B. (2014). Denoising and R-peak detection of electrocardiogram signal based on EMD and improved approximate envelope. Circuits, Systems, and Signal Processing, 33(4): 1261-1276. http://dx.doi.org/10.1007/s00034-013-9691-3
[9] Kaur, A., Agarwal, A., Agarwal, R., Kumar, S. (2019). A novel approach to ECG R-peak detection. Arabian Journal for Science and Engineering. Springer Berlin Heidelberg, 44(8): 6679-6691. http://dx.doi.org/10.1007/s13369-018-3557-8
[10] Pan, J., Tompkins, W.J. (1985). A real-time QRS detection algorithm. IEEE Transactions on Biomedical Engineering, BME-32(3): 230-236. http://dx.doi.org/10.1109/TBME.1985.325532
[11] Hamilton, P.S., Tompkins, W.J. (1986). Quantitative investigation of QRS detection rules using the MIT/BIH arrhythmia database IEEE Transactions on Biomedical Engineering, BME-33(12): 1157-1165. http://ds.doi.org/10.1109/TBME.1986.325695
[12] Fedotov, A.A., Akulova, A.S., Akulov, S.A. (2016). Effective QRS-detector based on Hilbert transform and adaptive thresholding. XIV Mediterranean Conference on Medical and Biological Engineering and Computing 2016, pp. 140-144. http://ds.doi.org/10.1007/978-3-319-32703-7
[13] Meyer, C., Gavela, J.F., Harris, M. (2006). Combining algorithms in automatic detection of QRS complexes in ECG signals. IEEE Transactions on Information Technology in Biomedicine, 10(3): 468-475. http://dx.doi.org/10.1109/TITB.2006.875662
[14] Sharma, L.D., Sunkaria, R.K. (2016). A robust QRS detection using novel pre-processing techniques and kurtosis based enhanced efficiency. Measurement: Journal of the International Measurement Confederation. Elsevier Ltd, 87: 194-204. http://dx.doi.org/10.1016/j.measurement.2016.03.015
[15] Beyramienanlou, H., Lotfivand, N. (2018). An efficient Teager Energy operator-based automated QRS complex detection. Journal of Healthcare Engineering. http://dx.doi.org/10.1155/2018/8360475
[16] Yakut, Ö., Bolat, E.D. (2018). An improved QRS complex detection method having low computational load. Biomedical Signal Processing and Control, 42: 230-241. http://dx.doi.org/10.1016/j.bspc.2018.02.004
[17] Bouny, L.E., Khalil, M., Adib, A. (2018). R peak detection based on wavelet transform and nonlinear energy operator. International Conference on Advanced Information Technology, Services and Systems, pp. 104-112. http://dx.doi.org/10.1007/978-3-030-11914-0_11
[18] Bajaj, A., Kumar, S. (2019). QRS complex detection using fractional Stockwell transform and fractional Stockwell Shannon energy. Biomedical Signal Processing and Control. Elsevier Ltd, 54: 101628. http://dx.doi.org/10.1016/j.bspc.2019.101628
[19] Park, J.S., Lee, S.W., Park, U. (2017). R peak detection method using wavelet transform and modified Shannon energy envelope. Journal of Healthcare Engineering. http://dx.doi.org/10.1155/2017/4901017
[20] Zidelmal, Z., Amirou, A., Ould-Abdeslam, D, Moukadem, A., Dieterlen, A. (2014). QRS detection using S-Transform and Shannon energy. Computer Methods and Programs in Biomedicine, 116(1): 1-9. http://dx.doi.org/10.1016/j.cmpb.2014.0 4 .008
[21] Singhal, A., Singh, P., Fatimah, B., Pachori, R.B. (2020). An efficient removal of power-line interference and baseline wander from ECG signals by employing Fourier decomposition technique. Biomedical Signal Processing and Control, 57: 101741. http://dx.doi.org/10.1016/j.bspc.2019.101741
[22] Kim, J.H., Lee, H.J., Min, K.J. (2018). Semi-real-time removal of baseline fluctuations in electrocardiogram (ECG) signals by an infinite impulse response low-pass filter (IIR-LPF). Journal of Supercomputing, 74(12): 6785-6793. http://dx.doi.org/10.1007/s11227-018-2608-y
[23] Singh, P., Srivastava, I., Singhal, A., Gupta, A. (2019). Baseline wander and power-line interference removal from ECG signals using Fourier decomposition method. Machine Intelligence and Signal Analysis, 25-36. http://dx.doi.org/10.1007/978-981-13-0923-6_3
[24] Abrar, M., Khan, W.E. (2018). Digital filtering techniques for power-line interference removal from ECG signals. 2018 Conference on Information Communications Technology and Society, ICTAS 2018, pp. 1-6. http://dx.doi.org/10.1109/ICTAS .2018.8368750
[25] Sharma, R.R., Pachori, R.B. (2018). Baseline wander and power line interference removal from ECG signals using eigenvalue decomposition. Biomedical Signal Processing and Control, 45(May): 33-49. http://dx.doi.org/10.1016/j.bspc.2018.05.002
[26] Wang, J., Ye, Y.Q., Pan, X., Gao, X.D., Zhuang, C. (2014). Fractional zero-phase filtering based on the Riemann-Liouville integral. Signal Processing. 98: 150-157. http://dx.doi.org/10.1016/j.sigpro.2013.11.024
[27] Zhang, D., Wang, S.S., Li, F., Wang, J. (2019) An ECG signal de-noising approach based on wavelet energy and sub-band smoothing filter. Applied Sciences (Switzerland), 9(22). http://dx.doi.org/10.3390/APP9224968
[28] Lin, H., Liang, S., Ho, Y., Lin, Y., Ma, H. (2013). Discrete-wavelet-transform-based noise reduction and R wave detection for ECG signals. 2013 IEEE 15th International Conference on e-Health Networking, Applications and Services (Healthcom 2013), pp. 355-360. http://dx.doi.org/10.1109/HealthCom.2013.6720700
[29] El Hanine, M., Abdelmounim, E., Haddadi, R., Belaguid, A. (2014). Electro CardioGram signal denoising using Discrete Wavelet Transform. International Conference on Multimedia Computing and Systems, pp. 1065-1070. http://dx.doi.org/10.1109/ICMCS.2014.6911270
[30] Moody, G.B., Mark, R.G. (2001). The impact of the MIT-BIH arrhythmia database. IEEE Engineering in Medicine and Biology Magazine, 20(3): 45-50. http://dx.doi.org/10.1109/51.932724