A.S.A. Elmaryami* | Hafied M.B. Khalid | Abdulhakim Alamaria | Osama Alashebe | S.S. Ali | A.S. Salem | R.A. Khaled | H.O. Mokhtar
OPEN ACCESS
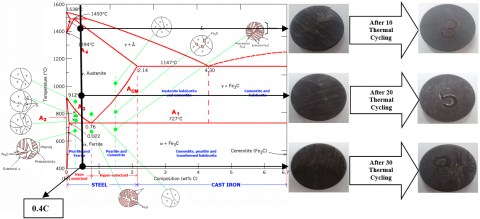
The effect of thermal cycling was carried out on steel bars (0.4 C %). A single run was performed at a lower temperature of 32℃ and an upper temperature of 500℃ cooled in water, seawater (previous results) and oil (new results). For several numbers of cycles up to 30 cycles for an accurate determination of heating and cooling times. The effect of thermal cycling on the corrosion rate was evaluated. The effect of thermal cycling on the following properties was evaluated the corrosion rate. The comparison between the effect of thermal cycling on carbon steel (0.4 C %) seawater and water-cooled (previous results as shown in references [1, 2]) and the effect of thermal cycling on carbon steel (0.4 C %) water-cooled (new results) has been studied. From the obtained test results (previous and in this paper, it was found that: the type of corrosion is uniform attack; corrosion rate of the first stage gradually increases with the number of thermal cycling up to 15 cycles, then it takes steady-state up to 30 cycles. It was found that the rate of corrosion (previous results, seawater and water-cooled) is more than the rate of corrosion of the new results, oil-cooled respectively.
thermal cycling, corrosion rate, heat treatment, quenching, carbon steel, oil cooled
Carbon steel is a special type of steel that, as the name suggests, has a higher concentration of carbon than other types of steel. Most types of steel have a relatively low carbon content of about 0.05% to 0.3%. In comparison, carbon steel has a carbon content of up to 2.5% [1, 2]. Two-and-a-half percent carbon may sound insignificant, but it introduces several attractive benefits that aren’t found elsewhere [3]. Corrosion of mild steel in different medium namely Sulfuric acid, Nitric Acid, NaCl solution was studied experimentally, where the experimental result shows that the corrosiveness of mild steel is most in nitric acid then in sulfuric acid then NaCl. The corrosiveness in nitric is high because of its high oxidizing nature and then it follows to the sulfuric acid then NaCl [4]. The general corrosion rate may be measured using immersion tests or electrochemical tests. The basis of these tests is to calculate the resistance to polarization (Rp) in a voltage vs. current plot and to convert these values to corrosion rates using Faraday’s law. It is concluded that the way the corrosion rate is calculated does not greatly impact the absolute value of the corrosion rate. Variations in the acquired data (current, potential) from one experiment to another seem more important than the manner in which data is fitted with the Rp slope [5]. The quantification of active corrosion rate of steel in concrete structures through nondestructive methods is a crucial task for scheduling maintenance/repair operations and for achieving accurate service life predictions. Measuring the polarization resistance of corroding systems and using the Stern-Geary equation to calculate the corrosion current density of active steel is a widely used method for this purpose. a practical numerical model for predicting corrosion rate of uniformly depassivated steel in concrete is developed. The model is built on Stern's earlier work that an optimum anode‐to‐cathode ratio exists for which the corrosion current on the metal surface reaches a maximum value. The developed model, which represents the corrosion rate as a function of concrete resistivity and oxygen concentration, is validated using experimental data obtained from the literature [6]. The loss rate is directly linked to the corrosion rate which in turn depends on the climate. Assuming that the corrosion rate is averaged at a yearly basis, the rate of structural deterioration can be predicted by considering residual load-bearing areas. Examples will be presented on corroded beams at different degrees, in order to illustrate de principle of recalculation based in the reduced cross section and the consideration of the bond loss [7].
The corrosion resistance of new multilayer metallic materials with internal protector against pitting. Using an electron microscope method, the mechanism of the layers’ corrosive destruction has been experimentally substantiated. The authors have suggested chemical and electrochemical methods of accelerated corrosion tests allowing for determining the corrosion destruction rate. The electrochemical method reveals the limiting stage of the process and allows calculating the mass corrosion index and substantiating the choice of protector for the specific corrosive medium. The chemical method allows for quantitative assessment of the internal protector’s effectiveness and for defining the multilayer/monometallic material corrosion resistance ratio [8]. Concept of reinforced concrete (RC) to be a durable material has been changed in last few decades as many RC structures are found showing distresses like cracking, spalling, de-laminations etc. The possible reason may be due to corrosion of reinforcement in costal chloride laden environment as well as in industrial CO2 laden areas. Corrosion of reinforcement inside the concrete is not visible unless there is crack formation. After the formation of crack in concrete the residual life of the structural member is hardly 5 to 10 years. But corrosion of reinforcement inside the concrete can be known instrumentally from early stage before making any structural damage. For calculation of residual strength of RC members for integrity appraisal, many models have been proposed. However, accuracy of the model depends on the amount and distribution of corrosion of reinforcement in existing structures. This is also a difficult process to assess the above parameters. Present study discusses various methods for corrosion measurement in the field to the real structures and calculations of corresponding mass loss. This mass loss can be utilized satisfactorily for calculation of residual flexural strength of RC member in flexure on bond loss as well as strength loss on corrosion [9]. Values of the free corrosion potential or half-cell potential, Ecorr [V], of the embedded reinforcing steel and of the electrical concrete resistance, Re [Ω], are obtained as preliminary steps of the Rp measurements. Values of the concrete resistivity, ρ [Ωm], can be calculated from Re values providing the geometrical arrangement of the electrodes enables this calculation [10]. The corrosion behavior of carbon steel had been investigated in the river of Sukabumi Region, West Java. The corrosion rates of those steels were measured by weight loss method after exposure for certain periods of time in various depth of water (0 meters and 1 meter). The surface morphology and the composition of their corrosion product were characterized using scanning electron microscopy (SEM), XRD (X-ray diffract meter) and energy dispersive spectroscopy (EDS). After exposure, the entire surface of carbon steel was covered by corrosion product in all depth of water. On the basis of results, the corrosion rate of those steels was 19.86 mpy for 0 meters of depth and 7.01 mpy for 1 meter of depth after exposure for 76 days, respectively, which means the no protective oxides on the surface of carbon steel at 0 meters [11]. The state-of-the-art in modeling of internal corrosion of oil and gas pipelines made from carbon steel is reviewed. The review covers the effects of: electrochemistry, water chemistry, formation of protective scales and scales, temperature, flow, steel, water condensation, glycol/methanol and localized attack. Various mathematical modeling strategies are discussed [12]. The research is focused on a minimum-impact technique for calculating corrosion rate of the battleship’s steel hull by analyzing physical and chemical properties of marine encrustation covering the exposed hull. An equation is derived that allows concretion thickness, density, and total iron content to be used to calculate corrosion rate of steel hull plate [13]. The research evaluates the effect that uncertainties in measurements of time, weight, and surface area have on the determination of the corrosion rate of metal fasteners in contact with wood. Three different types of nails were driven into alkaline copper quaternary (ACQ)-treated wood and exposed to 26.7°C (80°C) at 100% relative humidity environment for up to 1 year. It was observed that uncertainties in measurement of corrosion rate of less than 5 % could be obtained in 6 months of testing. The work gives a description of the methods used as well as recommendations for future corrosion exposure tests in wood [14].
A study of the constitution and structure of all steels and irons must first start with the Iron-Carbon Equilibrium Diagram, the Iron- Carbon Constitutional Diagram should extend from 100 percent Iron to 100 percent cementite (6.67C%) [15, 16], the plain carbon steels (0.4%C) were used, shown in Figure 1.
Figure 1. Iron-carbon equilibrium diagram
3.1 Materials
In this work hypo-eutectoid carbon steel (0.4%C) has been used their chemical composition are given in Table 1.
Table 1. Chemical composition of the used sample [1, 2]
|
Carbon, C |
0.40% |
|
Iron, Fe |
98.51 - 98.98% |
|
Manganese, Mn |
0.60 - 0.90% |
|
Phosphorous, P |
≤ 0.040% |
|
Sulfur, S |
≤ 0.050% |
3.2 Thermal cycled experiments:
Thermal cycled experiments were conducted for:
To study the effect of thermal cycling [10, 20, and 30 times] on the corrosion rate, oil-cooled.
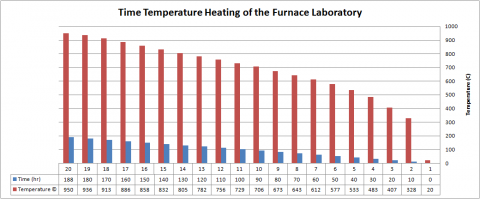
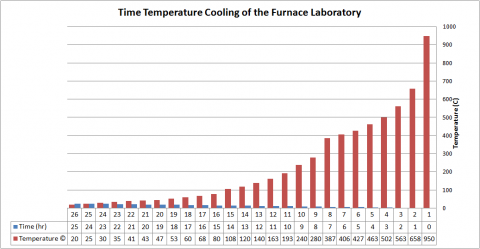
The thermal cycling was carried out in the Material Science Laboratory at The Bright Star University, the details of the furnace are: [Gallenhamp, Cat. No. (FSW - 670 - 010 J), APP. No. (7B9714 B)]. England, S302AU. For this furnace, the heating and cooling rate was recorded as shown in Figure 2 and Figure 3 respectively [1, 2].
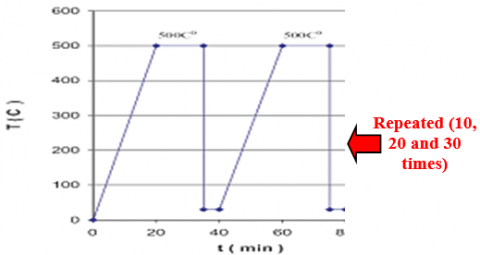
Figure 4. T.T. Diagram show the [10, 20 and 30 cycled cooled in oil]
The samples were each divided in to three groups, and each group were subjected to a different number of thermal cycling (10, 20, and 30 cycles). All samples were subjected to the same heating cycle, in which the samples were heated below A1 to 500℃ and held in the furnace for 15 min. Three samples of each heating cycle were cooled in oil. The total time of a single cycle was 40 min, as shown in Figure 4.
3.2.1 Corrosion testing
Thousands of corrosion tests are made every year. The value and reliability of the data Obtained depend on details involved. Unfortunately, many tests are not conducted or reported properly, and the information obtained is misleading. Corrosion rate has been measured by using the weight loss method for thus a [(Bulgur) calvarias (Varese) DEC.MIN.24-1-2003 N0 205295] were used. The difference between the weight sample after and before subjected it to thermal cycling then removal the corroded layer by a piece of wood (softer than steel).
This loss of weight (ΔW) is considered as weights of corroded materials were:
Losses of corrosion $\%=\Delta W / W_{0} * 100$
where, ΔW: losses of weight (mgr) due to thermal cycling, W0: original weight (gram).
4.1 The effect of thermal cycling on corrosion rate
The samples subjected to a number of thermal cycling 10, 20, and 30 cycles then exposure to corrosion attack for (one week about 168 hr).
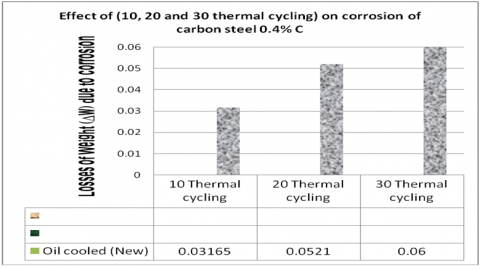
We used oil as a cooling media, Figure 5 shows the effect of thermal cycling on corrosion rate oil cooled. The increasing of thermal cycling leads to increase the corrosion rate for carbon steel. This increase can be divided in two stages:
In the first stage the corrosion rate increases gradually with increasing thermal cycling up to 10 cycles. Above that (more than 10 cycles) the corrosion rate increasing slowly until 30 cycles. This behaviour can be attributed to the increase in the amount of residual stresses, this amount of residual stress increases with increasing cycles up to (10 cycles) and then there is slowly increasing in residual stresses after that. The lead to introduce residual stresses which have strong influence on corrosion rate.
Based on the above results, it can be safely concluded that thermal cycling introduced residual stresses which leads to increase in corrosion rate. Stages by increasing the number of cycles corrosion rate increases through two depending on amount of thermal cycling.
The comparison between the effect of thermal cycling sea water cooled and water-cooled (previous results [1, 2]) and the effect of thermal cycling oil-cooled (in this manuscript) shown in Figure 6.
Figure 5. The effect of 10, 20 and 30 thermal cycling on corrosion rate, oil cooled
Figure 6. The effect of 10, 20, and 30 thermal cycling on corrosion rate, seawater, water and oil-cooled
The results of this investigation show that:
(1) Thermal cycling causes uniform corrosion attack for plain carbon steel.
(2) Corrosion rate of the first stage gradually increases with the number of thermal cycling up to 15 cycles, then it takes steady state up to 30 cycles.
(6) The rate of corrosion (previous results: seawater and water-cooled) more than (corrosion's results in this work, oil-cooled).
The authors wish to gratefully acknowledge to the Bright Star University, El-Brega, Libya for supporting this work.
[1] Elmaryami, A.S.A., Saad, A.S., Omar, M.H., Ali, K.R. (2020). Corrosion rate calculation of carbon steel (0.4%C) after subjected to thermal cycling, sea water cooled. Journal of Multidisciplinary Engineering Science and Technology (JMEST), 7(6): 11991-11996.
[2] Elmaryami, A., Salem, S.A., Saad, A.S., Omar, M.H., Ali, K.R. (2020). Effect of thermal cycling on corrosion rate of carbon steel (0.4% C), water cooled. Engineering & Technology Review, 1(1): 28-34. https://doi.org/10.47285/etr.v1i1.44
[3] Monroe Engineering Products, AS9100D & ISO 9001: 2015 | CAGE: 06197 2990 Technology Dr Rochester Hills, MI 48309, 2020.
[4] Ahmed, I., Islam, A., Ali, N. (2017). Determination of corrosion rate of mild steel in different medium measuring current density. International Conference on Mechanical Engineering and Renewable Energy, Chittagong, Bangladesh, pp. 18-20.
[5] Wong, L.L., Martin, S.I., Rebak, R.L.B. (2006). Methods to calculate corrosion rates for alloy 22 from polarization resistance experiments. ASME Pressure Vessels and Piping Conference, 47586: 571-580. https://doi.org/10.1115/PVP2006-ICPVT-11-93421
[6] Ghods, P., Isgor, O.B., Pour-Ghaz, M. (2007). A practical method for calculating the corrosion rate of uniformly depassivated reinforcing bars in concrete. Materials and Corrosion, 58(4): 265-272. https://doi.org/10.1002/maco.200604010
[7] Rodriguez, J., Ortega, L., Izquierdo, D., Andrade, C. (2006). Calculation of structural degradation due to corrosion of reinforcements. Measuring, Monitoring and Modeling Concrete Properties, 527-536. https://doi.org/10.1007/978-1-4020-5104-3_64
[8] Grachev, V.A., Rozen, A.E., Perelygin, Y.P., Kireev, S.Y., Los, I.S., Rozen, A.A. (2018). Measuring corrosion rate and protector effectiveness of advanced multilayer metallic materials by newly developed methods. Heliyon, 4(8): e00731. https://doi.org/10.1016/j.heliyon.2018.e00731
[9] Nayak, S. (2017). Calculation of Mass Loss on Corrosion of Reinforcement through Field Measurement. NIGIS * CORCON 2017 * 17-20 September * Mumbai, India.
[10] Andrade, C., Alonso, C. (2004). Test methods for on-site corrosion rate measurement of steel reinforcement in concrete by means of the polarization resistance method. Materials and Structures, 37(9): 623-643. https://doi.org/10.1007/BF02483292
[11] Royani, A., Prifiharni, S., Nuraini, L., Priyotomo, G., Purawiardi, I., Gunawan, H. (2019). Corrosion of carbon steel after exposure in the river of Sukabumi, West Java. IOP Conference Series: Materials Science and Engineering, 541(1): 012031.
[12] Nešić, S. (2007). Key issues related to modelling of internal corrosion of oil and gas pipelines-A review. Corrosion Science, 49(12): 4308-4338. https://doi.org/10.1016/j.corsci.2007.06.006
[13] Russell, M.A., Conlin, D.L., Murphy, L.E., Johnson, D.L., Wilson, B.M., Carr, J.D. (2006). A minimum-impact method for measuring corrosion rate of steel-hulled shipwrecks in seawater. International Journal of Nautical Archaeology, 35(2): 310-318. https://doi.org/10.1111/j.1095-9270.2006.00101.x
[14] Zelinka, S.L. (2007). Uncertainties in corrosion rate measurements of fasteners exposed to treated wood at 100% relative humidity. Journal of Testing and Evaluation, 35(1): 106-109. https://doi.org/10.1520/JTE100040
[15] Bhadeshia, H., Honeycombe, R. (2006). Steels: Microstructure and Properties. Third Edition.
[16] Elmaryami, A.S., Omar, B. (2012). Developing 1-dimensional transient heat transfer AXI-symmetric mm to predict the hardness, determination LHP and to study the effect of radius on E-LHP of industrial quenched steel bar. Heat Transfer Phenomena and Applications, 153-182. https://doi.org/10.5772/51947