Nicola Germano* | Camilla Lops | Sabino Matera | Sergio Montelpare | Guido Camata
OPEN ACCESS
This work aims to expose the mesoscale-microscale numerical approach for defining the boundary conditions for more accurate building energy simulations. Three models are examined (Pleim-Xiu, Blackadar and MRF-LSM) and compared with the data recorded by the anemometer located at the University “G. d’Annunzio” in Pescara. The city of Pescara, situated on the coast in the centre of Italy, is selected to analyse the wind pattern. The main object of this work is providing more detailed information through the results obtained by CFD analyses. Two computational cylindrical domains, with a diameter of 8 km, are evaluated: the first domain models only the land topography whereas the other also involves buildings located inside the area. Both domains are divided into 12 circular sectors of 30° to consider the various directions of the inlet wind. The calibration of virtual anemometers on real data allows the creation of a more accurate profile of the inlet wind and temperature for better energy simulations, especially in case of buildings with Double Skin Façade (DSF). The MM5 weather forecast model is adopted to evaluate the wind pattern and distribution, while CFD analyses are performed using the STAR-CCM+ software.
macroscale, microscale, computational fluid dynamic (CFD), coupling, building energy simulation (BES)
In the 20th century, the increasing of the urbanisation and the consequent expansion of the cities produced a significant alteration of the natural environment. For this reason, urban areas have lost the ecological balance with their surroundings with a consequent increase in discomfort conditions for the inhabitants.
This has led the alteration of local winds and turbulence and the creation of phenom of the Urban Heat Island (UHI), responsible for the local temperature increment compared to the surrounding areas [1].
The effects of urbanisation and local wind fields have been studied through observational and simulation approaches [2].
In the last years, thanks to the increase of computational resources, numerical simulations have become very popular [3]. This popularity is justified by their ability in performing analyses based on different scenarios and the possibility to take information on each investigated variable inside the computational domain [4].
In this work, a coupled Macroscale-Microscale procedure is carried out to better estimate physical quantities which profoundly affect the accuracy of Building Energy Simulations (BES).
2.1 The Mesoscale approach
Macroscale analyses were performed with the MM5 software. This software, developed by the Pennsylvania State University (PSU) and the National Center for Atmospheric Research (NCAR), is the PSU/NCAR Mesoscale Model Fifth Generation (MM5) [5].
Three different Planetary Boundary Layer (PBL) were studied. The first PBL is Pleim-Xiu land surface model [6], the second is Blackadar [7], and the last one is Medium Range Forecast land surface model (MRF-LSM) [8].
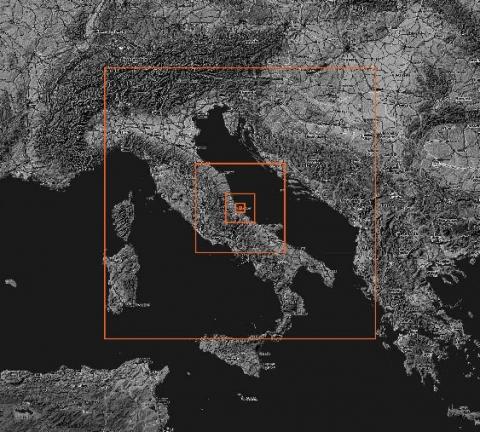
This study was conducted considering as case study the city of Pescara, situated on the coast in the centre of Italy (Figure 1). The collection of datasets used in these simulations cover one year from 1st July 2016 to 30th June 2017.
Figure 1. The centre of the domain
Five nested domains (Figure 2) have been adopted with the same centre (42.465447 lat, 14.226763 long) and an equal number of points (31 x 31). From domain 1 to domain 5 there is an increase in the spatial resolution with a ratio 1 to 3. The data relating to the information on the domains are shown in Table 1.
Table 1. Domain information
|
Domain |
Grid Spacing |
Grid Points |
Domain Extension |
|
D5 |
0.4 [km] |
31 x 31 |
12 x 12 [km2] |
|
D4 |
1.2 [km] |
31 x 31 |
36 x 36 [km2] |
|
D3 |
3.6 [km] |
31 x 31 |
108 x 108 [km2] |
|
D2 |
10.8 [km] |
31 x 31 |
324 x 324 [km2] |
|
D1 |
32.4 [km] |
31 x 31 |
972 x 972 [km2] |
Figure 2. Domain nesting
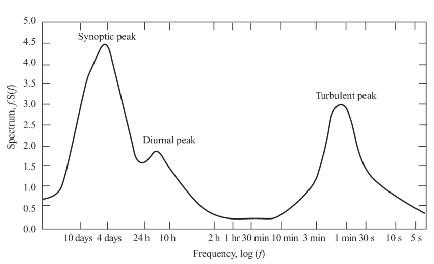
With the one-way nesting procedure, it was possible to consider meteorological phenomena from the synoptic scale to the local level. The wind speed spectrum shown in Figure 3 (constructed by Van Der Hoven in 1975) [9] highlights that on it is possible to study the main phenomena that occur weekly or monthly the synoptic scale. In contrast to Domain 1, the last domain (D5) covers the region closest to the area of interest. The higher resolution of this domain allows studying phenomena with 12h or 24h frequencies such as breezes.
Figure 3. Wind Spectrum Farm Brookhaven based on the work by Van der Hoven
The input meteorological data are the NCEP (National Centers for Environmental Prediction) ds083.2 datasets which belong to FNL (Final Global Data Assimilation System) category. These data are available from 1999 to present day and have a grid resolution of 1° x 1° with a time interval of 6 hours (00:00, 06:00, 12:00, 18:00 UTC).
The MM5 outputs, with a 4 minutes time step, are post-processed to obtain data with 10 minutes time step. This step allows the comparison of these data with the data collected with the real anemometer located at the University "G. d’Annunzio "in Pescara (Italy).
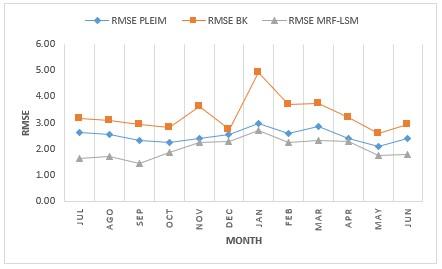
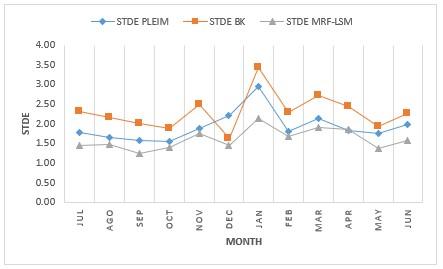
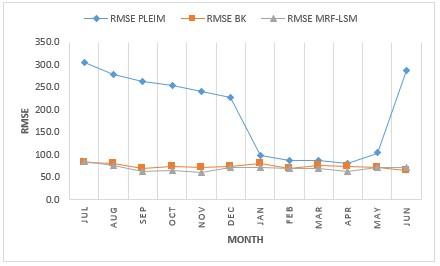
In this work, the data are extracted at five different levels; in particular at 10m, 30m, 71m, 122m and 204m. Wind speed and direction, temperature, pressure and humidity are selected for the calculation of monthly data of RMSE (Root Mean Square Deviation), BIAS and STDE (Standard Deviation).
For the sake of brevity, only the results of wind speed and direction (for each PBL analysed) are reported in the following lines.
Figure 4. RMSE wind velocity
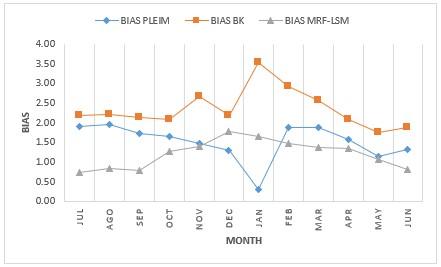
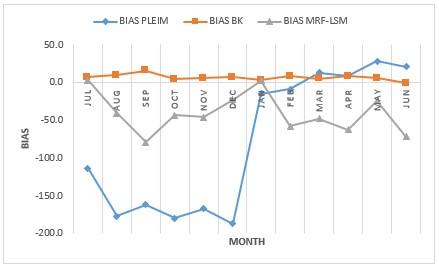
Figure 5. BIAS wind velocity
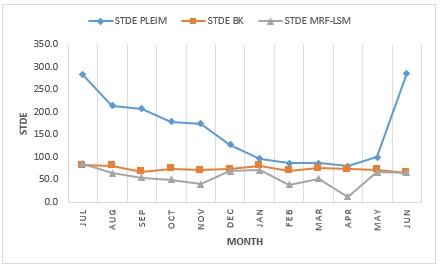
Figure 6. STDE wind velocity
Analysing the wind speed pattern, it can be seen that the results obtained with the Blackadar model are those that deviate most from the real data.
The results of wind directions highlight the unusual behaviour of the outputs obtained with the Pleim-Xiu model. Further simulations should be conducted to investigate the principal reasons for this trend.
The Pleim-Xiu model turns out to be the worst also by considering the temperature results.
Instead, the Blackadar model is the one that most deviates from the real values by analysing the pressure, while a similar trend for all models about the humidity results is obtained.
The analyses have shown that the MRF-LSM model is the most accurate if compared to a real anemometer. Using this model, in fact, standard error, standard deviation and BIAS are the lowest recorded.
Figure 7. RSME wind direction
Figure 8. BIAS wind direction
Figure 9. STDE wind direction
2.2 The Microscale approach
Microscale analyses were conducted with the commercial software STAR-CCM+.
The regional cartography (CTR) was used for the realisation of the computational domain. In the CTR the buildings are represented with their real shape, and therefore no approximations have been made as often happens in similar studies.
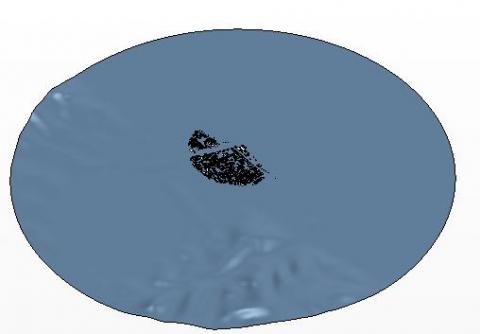
The CFD domain is a cylindrical volume with a diameter equal to 8 km and 0.8 km heigh. It is located into the smallest Mesoscale domain (Domain 5) with the same centre.
Two different computational domains were analysed. The first domain models only the land topography. The second one considers the topography and the buildings located in the area under study (Figure 10).
Figure 10. CFD domain (terrain and buildings)
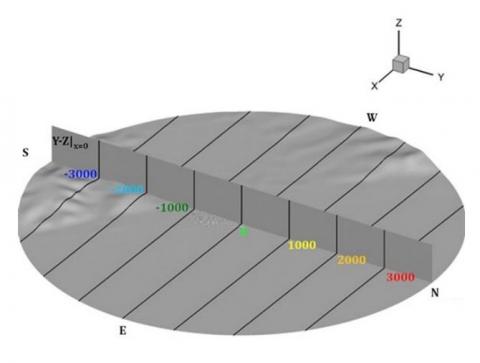
Each domain was divided into 12 circular sectors of 30° to consider the various directions of the inlet wind.
The lateral boundary conditions assume the amount of "velocity inlet" or "pressure outlet", according to the analysed direction. So, six sectors have the inlet value and the other six the outlet one for each direction.
The domain base surface was defined as "Wall" condition as well as the buildings (if any). The domain upper surface was set as "symmetry plane".
In this work, a polyhedral mesh was used in combination with the prismatic mesh. This second mesh was inserted for modelling the areas near the buildings in order to improve the turbulence propagation.
The results of the CFD analysis were plotted, taking into consideration seven plans distant 1 km from each other, as shown in Figure 11.
Figure 11. Section plans
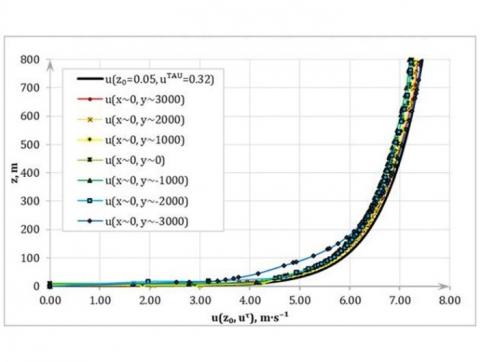
Figure 12. CFD domain only terrain wind speed along the plane Y-Z|x=0
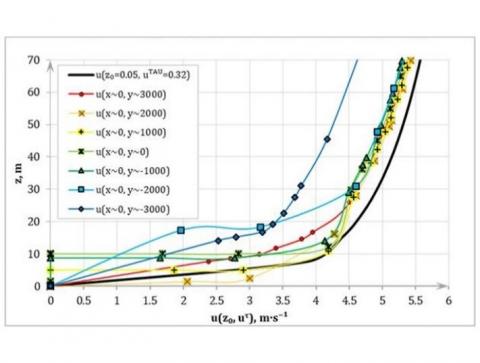
Figure 13. CFD domain terrain and buildings wind speed along the plane Y-Z|x=0
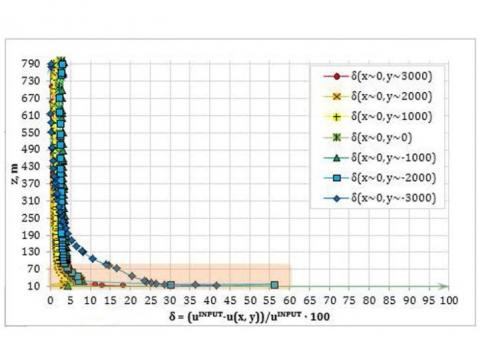
Figure 14. The relative difference between the input and calculated speed
Analysing the velocity profiles along the plane Y-Z|x=0, a deceleration near the ground of the inlet wind occur (from the north in this case).
The points near the buildings (y = 0, y = -1000) show a decrease of speed around 10 m caused by the presence of the buildings themselves.
The difference between the estimated wind speed and the inlet wind speed is more significant where there are considerable altitude differences (y=-2000, y=-3000) and it always tends to cancel out as the altitude increases.
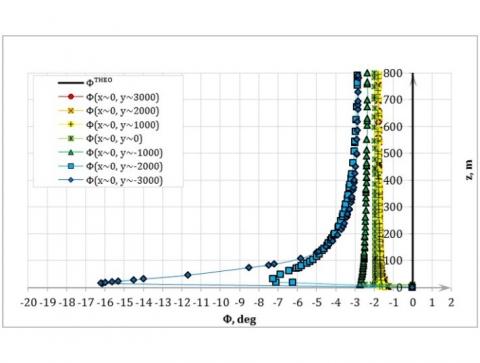
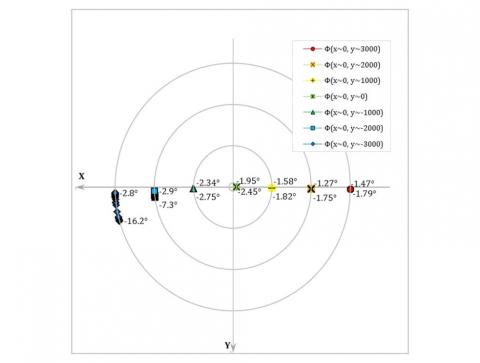
The graph of the relative directional inflow (Figure 15) shows a maximum rotation of 16° on the North-South axis. This is due to the difference in altitude of the terrain and the presence of the buildings. The rotation, in fact, decreases with increasing height.
Figure 15. Relative directional inflow (wind from the North)
The aim of this work was the evaluation of the results from the macroscale-microscale coupling procedure useful for more accurate energy analyses.
The work was divided into two parts: in the first part macroscale analyses were conducted; while in the second part, microscale analyses were run.
Macroscale analyses with MM5 allowed studying several PBLs. In particular, three different PBLs was considered, and the MRF-LSM model has shown better results if compared to Blackadar and Pleim-Xiu.
CFD analyses were performed with Star-CCM+. Two computational domains have been created: one without buildings and one with buildings. The results of these analyses, with the calibration of virtual anemometers on real data, has allowed the creation of a more accurate profile of the inlet wind and temperature for more precise energy simulations, especially in case of buildings with Double Skin Façade (DSF).
[1] Oke, T.R. (1987). Boundary Layer Climates. New York: Routledge.
[2] Mirzaei, P.A., Haghighat, F. (2010). Approaches to study urban heat island - Abilities and limitations. Building and Environment, 45(10): 2192-2201. https://doi.org/10.1016/j.buildenv.2010.04.001
[3] Souch, C., Grimmond, S. (2006). Applied climatology: Urban climate. Progress in Physical Geography: Earth and Environment, 30(2): 270-279. https://doi.org/10.1191/0309133306pp484pr
[4] Montelpare, S., D’Alessandro, V., Lops, C., Costanzo, E., Ricci, R. (2017). A Mesoscale-Microscale approach for the energy analysis of buildings. Journal of Physics: Conference Series, 1224(1). https://doi.org/10.1088/1742-6596/1224/1/012022
[5] Georg, G.A., Dudhia, J., Stauffer, D.R. (1994). A description of the Fifth-generation Penn State/NCAR Mesoscale Model (MM5). University Corporation for Atmospheric Research, p. 121. https://doi.org/10.5065/D60Z716B
[6] Xiu, A., Pleim, J.E. (2001). Development of a land surface model. Part I: Application in a mesoscale meteorological model. Journal of Applied Meteorology and Climatology, 40(2): 192-209. https://doi.org/10.1175/1520-0450(2001)040<0192:DOALSM>2.0.CO;2
[7] Zhang, D., Anthes, R.A. (1982). A high-resolution model of the planetary boundary layer - sensitivity tests and comparisons with SESAME-79 data. Journal of Applied Meteorology and Climatology, 21(11): 1594-1609. https://doi.org/10.1175/1520-0450(1982)021<1594:AHRMOT>2.0.CO;2
[8] Hong, S.Y., Pan, H.L. (1996). Nonlocal boundary layer vertical diffusion in a medium- range forecast model. Monthly Weather Review, 124(10): 2322-2339. https://doi.org/10.1175/1520-0493(1996)124<2322:NBLVDI>2.0.CO;2
[9] Burton, T., Sharpe, D., Bossanyi, E. (2001). Wind Energy Handbook. John Wiley & Sons, Ltd.