Silvia Luciani | Gianluca Coccia* | Sebastiano Tomassetti | Mariano Pierantozzi | Giovanni Di Nicola
OPEN ACCESS
I-V curves allow to estimate the performance of photovoltaic modules and strings. On site, I-V curves are usually obtained under operating conditions (OPCs), i.e. at variable solar radiation and module temperature. Thus, OPC curves must be translated into standard test conditions (STCs), at a global irradiance of 1000 W/m2 and a module temperature of 25 °C. The translation allows to estimate the deviation between the power of the examined module and that declared by the manufacturer. A possible translation procedure requires two correction parameters: Rs’, the internal series resistance, and k’, the corresponding temperature coefficient. The aim of this work is to estimate the correction parameters using calculation methods based on an error minimization routine, rather than carrying out specific experimental tests such as those proposed by IEC 60891. A set of brand-new photovoltaic modules was therefore experimentally characterized determining their I-V curves by means of an indoor solar flash test device based on a class A+ AM 1.5 solar simulator. Using the OPC and STC I-V curves as a dataset, the minimization routine allowed to estimate the correction parameters of the photovoltaic modules being considered. The procedure should be also effective using real, on-site I-V data.
flash test, I-V curve, minimization, OPC, STC
During their lifetime, photovoltaic (PV) plants are subject to a normal degradation of their components, and they are consequently characterized by loss of power, with a decrease of the expected production [1]. In order to prevent and evaluate failures and loss of production, specific tests can be carried out on the different components of PV systems, and specifically on the PV modules. Among such tests, the so-called flash tests allow to assess the actual I-V (current-voltage) curve of a PV module [2].
I-V curves represent an important instrument to estimate the performance of strings and PV modules. In fact, from the comparison between I-V curves measured on-site and the I-V curves declared by the module manufacturer in the datasheet, it is possible to detect decreases of performance and to control the degradation of PV devices.
On-site I-V curves are performed by commercial I-V curve tracers, based on the international standard IEC 60891 [3]. I-V curves, measured according to the provided operating conditions (OPCs), have to be translated into standard test conditions (STCs), consisting in a global irradiance (G) equal to 1000 W/m2, and a module temperature (T) equal to 25°C. The correction at STC conditions is essential to estimate the deviation between the power of the examined module and the maximum power declared by the manufacturer.
The standard IEC 60891 proposes three correction procedures to translate OPC measures into STC measures. The second procedure, which is generally performed by commercial I-V curve tracers, requires two different correction parameters: Rs’, the internal series resistance of the test specimen, and k’, the corresponding temperature coefficient. According to IEC 60891, the two parameters can be determined experimentally, in natural or simulated sunlight.
Based on the authors’ knowledge, academic research concerning the evaluation of the parameters Rs’ and k’ is rather scarce. As will be shown by the analysis of some relevant studies found in literature, research mainly focused on experimental procedures for the determination of temperature coefficients and correction parameters as indicated in IEC 60891. However, it is difficult to find reference values for the correction parameters, and no estimation model was proposed. Given the fact that the two correction parameters are not provided by manufacturers in datasheets, a study focused on these parameters could have both an academic and a technical interest.
Abella and Chenlo [4] tried to determine correction parameters by means of a solar simulator. Temperature coefficients and correction parameters were extrapolated from the I-V curves obtained with a class AAA solar simulator at irradiances from 700 to 1200 W/m2 at a defined temperature (25°C), and at temperatures from 20°C to 50°C at a given irradiance (1000 W/m²). From the I-V curves measured at a defined irradiance and various temperatures, the correction parameter k and k’ of the IEC 60891 correction procedures 1 and 2 were calculated. The authors showed the values of k and k’ and the relative errors in the determination of the maximum power with the correction procedures. With procedure 1, the value of k that allowed to obtain the minimum dispersion of the maximum power (0.5%) was 0.0039 Ω.°C-1, while with procedure 2, the value of k’ that allowed to obtain the minimum dispersion of the maximum power (0.4%) was 0.00345 Ω.°C-1. From the I-V curves measured at a given temperature and different irradiance values, the correction coefficients Rs for procedure 1 and Rs’ for procedure 2 were calculated. According to procedure 1, the value of Rs that gave the minimum dispersion of maximum power (0.4%) was 0.36 Ω, whereas with the second procedure the value of Rs’ that gave the minimum dispersion of power was 0.35 Ω.
Paghasian and TamizhMani [5] carried out a study to validate the accuracy of four translation procedures: the three procedures proposed in the standard IEC 60891, and a procedure developed by NREL. Correction parameters were determined for four different module technologies, namely mono-Si, a-Si, CdTe, and CIGS. The parameters were obtained experimentally, with natural sunlight. To obtain data at various irradiance levels, different mesh screens with varying light transmittance were used with known transmittance values. To assess performance at different temperatures, instead, the test module was pre-cooled in an environmental chamber, then a series of I-V measurements were carried out under sunlight while the module warmed up naturally. In a previous work, Paghasian [6] provided the values of Rs’, k’ and a (the irradiance correction for Voc) for different PV modules technologies: mono-Si (0.5 Ω, -0.045 Ω.°C-1, -0.075), a-Si (-17 Ω, -0.09 Ω.°C-1, -0.0095), CdTe (1.5 Ω, -0.7 Ω.°C-1, -0.1) and CIGS (2.85 Ω, -0.005 Ω.°C-1, -0.06), determined according to the IEC 60891.
In their work, Trentadue et al. [7] followed the standard IEC 60891 to determine the internal series resistance and investigated repeatability and uncertainty of the results for a number of typical PV technologies. The authors investigated three aspects of experimental contributions to variation in the determination of series resistance of PV devices. The temperature variation of the PV devices had a major influence on uncertainty, but with careful device temperature control it can be contained to 5%. The noise present in the I-V curves was shown to lead to a variation in series resistance of 5%. A comparison between different solar simulator systems displayed repeatability of 5%, except for CIGS thin-film technologies, which were characterized by variations up to 15%. Uncertainty for the determination of the series resistance of ±10% was deduced from experimental results.
Dubey et al. [8] proposed a methodology to measure temperature coefficients in the field. They analyzed temperature coefficients for three modules of different PV technology, and the coefficients were compared to the values obtained through indoor laboratory testing. For mono c-Si modules, the temperature coefficient of voltage determined from field measurements was -0.31 %/°C, value not far from the temperature coefficient measured in laboratory (-0.28 %/°C). Similar measurements were made for multi c-Si and CIGS modules: the temperature coefficients of voltage determined from field measurements were, respectively, -0.27 %/°C and -0.28 %/°C, not far from those found in laboratory (-0.30 %/°C and -0.27 %/°C). In addition, the authors determined, for the three modules technologies, the temperature coefficient of current in the field and in an indoor solar simulator. For mono c-Si modules, the temperature coefficient of current measured in the field was 0.021 %/°C, while the same coefficient obtained in laboratory was 0.03 %/°C. For multi c-Si and CIGS modules, the temperature coefficient of current measured in the field were, respectively, 0.026 %/°C and 0.0029 %/°C, while in laboratory the obtained values were 0.028 %/°C and 0.003 %/°C.
An issue that occurs in real, on-site PV measurements, lies in the fact that operators generally use commercial I-V curve tracers which automatically provide STC-translated I-V curves, and the maximum power tolerance verification. Manufacturers of I-V curve tracers declare the compliance to the IEC 60891 translation procedures. However, I-V curve tracers do not usually provide the values of the correction parameters used to perform translation. Software provided with commercial I-V curve tracers generally allows to plot STC I-V curves, but usually not all the I-V points can be extrapolated, with this possibility limited to only some relevant points (short circuit, open circuit, maximum power). Additionally, it is not generally possible to check the I-V translated curves accuracy.
Based on the aforementioned considerations, it is clear that analysis possibility given by commercial I-V curve tracers is rather limited. Thus, the aim of this work is to provide an estimation method for the correction parameters. The proposed method is based on an error minimization routine, that allows to estimate the two correction parameters Rs’ and k’ through the knowledge of a limited number of OPC and STC I-V curves. To this purpose, a set of brand-new PV modules was experimentally characterized determining their I-V curves by means of an indoor solar flash test device based on a class A+ AM 1.5 solar simulator. Using the OPC and STC I-V curves as a dataset, the minimization routine allowed to estimate the correction parameters of the PV modules being considered. This procedure should be effective in determining correction parameters using real, on-site I-V data, without the need of additional experimental tests. Also, the method should allow to make an estimate of these coefficients over time.
The paper is structured as follows. Section 2 describes the technical specifications of the indoor solar flash test device, the set of tested modules and the procedures followed to carry out the necessary measurements. In Section 3, we will analyze the second correction procedure proposed by IEC 60891, i.e. the translation equations for current and voltage, and the correction parameters to be defined in order to perform the translation from OPC to STC conditions. In addition, Section 3 reports the minimization routine, implemented to determine the two parameters Rs’ and k’ according to the second procedure of IEC 60891. The results of the study and their discussion are provided in Section 4. The main conclusions of the paper can be found in Section 5.
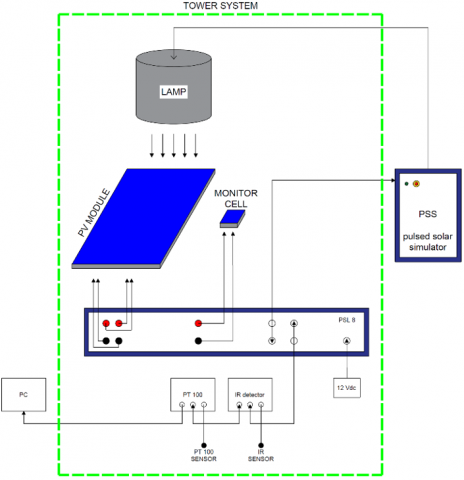
In the present work, tests were performed by means of an indoor solar flash test device based on a class A+ AM 1.5 solar simulator, made by BERGER Lichttechnik.
The system consists of a pulsed solar simulator (PSS), a load and measuring device (pulsed solar load, PSL), an infrared (IR) detector, a Pt100 sensor, a computer with dedicated software for I-V curves acquisition, and a tower system.
The PSS includes a power generator and a lamella light source without optical elements for homogenous and reproducible illumination. The device meets all the requirements of IEC 60904-9 [9], while the construction of the lamella light source and the patented flash tube ensure lifetime conformity with this standard.
The PSL is a processor-controlled device with three channels, used for measuring and load simulation. It allows to determine the I-V curves of PV modules, according to IEC 60904-1 [10].
The IR detector is a contactless, infrared measuring system with external sensor head that allows the automatic module temperature acquisition. The Pt100 sensor, instead, is a resistance temperature detector allowing the ambient and cell temperature acquisition.
Through the PSL software, installed in the dedicated computer, all relevant data relative to I-V curves are acquired, stored and displayed.
The tower system provides a stable test environment for improved uniformity and testing repeatability.
Figure 1. Test rig to perform I-V curve measurements with the solar simulator
For the determination of the correction parameters, a specific dataset of five brand-new PV modules was selected. The modules belong to the same brand and have the same nominal power (240 W). They are characterized by 60 series-connected cells in polycrystalline silicon. The main parameters of the PV modules can be found in Table 1 and Table 2.
Table 1. Electrical characteristics of the PV modules
|
Parameter |
Symbol |
Value |
|
Maximum power |
Pmax (W) |
240 |
|
Current at maximum power point |
Impp (A) |
7.78 |
|
Voltage at maximum power point |
Vmpp (V) |
30.86 |
|
Short circuit current |
Isc (A) |
8.24 |
|
Open circuit voltage |
Voc (V) |
37.56 |
|
Maximum System Voltage |
(V) |
1000 |
|
Module efficiency |
Eff (%) |
14.50 |
Standard test conditions: irradiance 1000 W/m², temperature 25°C +/- 2°C, AM 1.5.
To determine all the I-V curves, each of the five tested modules was placed on a dedicated support inside the tower system. Each module was placed underneath the flasher, connected to the PSS.
The measurement procedure starts with a flash test of the first module. Then, the PSL software shows the graphic representation of the tested module I-V curve at OPC conditions; in addition, the software displays the relative STC-translated I-V curve. The PSL software also provides a CSV file with all the current-voltage values of the two obtained I-V curves.
The same procedure was repeated for the other four modules. For each PV module, 20 flash tests were carried out, and data related to I-V curves at OPC and STC conditions were acquired and collected.
Table 2. Thermal characteristics of the PV modules
|
Parameter |
Symbol |
Value |
|
Maximum power temperature coefficient |
(%/°C) |
-0.46 |
|
Open circuit voltage temperature coefficient |
β (mV/°C) |
-133.8 |
|
Short circuit current temperature coefficient |
α (mA/°C) |
3.69 |
|
Nominal operating cell temperature |
NOCT (°C) |
44 |
|
Temperature range |
(°C) |
– 40 to 85 |
On-site, I-V curves are being measured in provided operating conditions (OPCs), and they must be therefore translated into standard test conditions (STCs) in order to obtain measures independent of actual on-site temperature and irradiance. The international standard IEC 60891 defines three different correction procedures; since most of commercial I-V curve tracers follows procedure 2, only this procedure will be analyzed in the following.
The second correction procedure is based on the simplified one-diode model of PV devices. It is defined by the following equations for current and voltage, respectively:
$I_{2}=I_{1}\left[1+\alpha_{\mathrm{rel}}\left(T_{2-} T_{1}\right)\right] \frac{G_{2}}{G_{1}}$ (1)
and
$V_{2}=V_{1}+V_{\mathrm{OC} 1}\left[\beta_{\mathrm{rel}}\left(T_{2-} T_{1}\right)+a \ln \left(\frac{G_{2}}{G_{1}}\right)\right]$
$-R_{\mathrm{s}}^{\prime}\left(I_{2-} I_{1}\right)-k^{\prime} I_{2}\left(T_{2-} T_{1}\right)$ (2)
where:
From Eqns. (1) and (2), it can be seen that, besides the temperature coefficients for short circuit current αrel and open circuit voltage βrel, generally indicated in the module datasheet, other three correction parameters have to be defined to perform the correction procedure from OPC to STC conditions: a, Rs’ and k’. While IEC 60891 indicates for a a typical value of 0.06, no reference values can be found for Rs’ and k’, which should be determined experimentally (in natural or simulated sunlight).
In this work, we therefore tried to estimate the two correction parameters by using an error minimization routine. Specifically, the STC I-V curves obtained through the indoor solar flash test device were compared with the STC I-V curves determined by means of a calculation model, which is based on Eqns. (1) and (2). To determine the correction parameters Rs’ and k’, the error minimization routine was applied to the root mean square error (RMSE) calculated between the STC voltage (V2) derived through the model with Eq. (2), and the STC voltage determined by the PSL software (V2,PSL). For each module and each flash test, the error minimization equation can be written as:
$\min \cdot \operatorname{RMSE}=\sqrt{\frac{1}{n} \sum_{i=1}^{n}\left(V_{2, i}-V_{2, \mathrm{PSL}, i}\right)^{2}}$ (3)
subject to
$0.30<R_{5}^{\prime}<2 \mid \wedge 0.001<k^{\prime}<0.100$ (4)
where, n is the number of I-V points determined for each flash test (set by default to 110 in the PSL software). The constraints set for the two parameters are based on values found in literature, and on some trial-and-error attempts carried out during calculation. The minimization routine was implemented in Mathematica, using a numerical minimization function based on the random search algorithm [10, 11].
The following section presents and discusses the results of the study. In order to provide a comparison between the results given by the flash tests and the calculation model based on the translation Eqns. (1) and (2), Figure 2 shows the STC I-V curves obtained with the two approaches for a specific PV module. As can be seen, the two curves overlap almost perfectly, proving that the model is accurate and in good accordance with the measures carried out with the solar simulator.
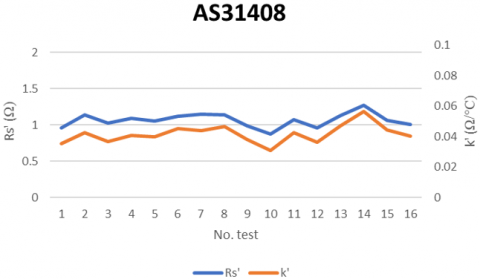
For each of the five PV modules being considered, the minimization routine allowed to estimate Rs’ and k’. The routine determines a couple of parameters for each flash test, as depicted for example in Figure 3, which refers to one of the PV modules (serial number AS31408). As can be seen from Figure 3, the value of the two parameters fluctuates in a narrow range (it should be noted that some tests, where the minimization routine failed, were not represented). Based on these results, a good estimate of the two parameters should be the mean value of the whole minimization process.
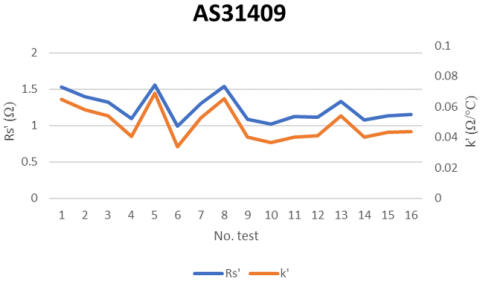
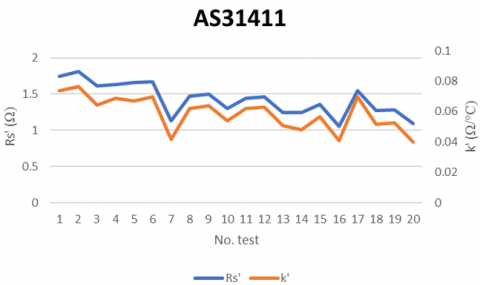
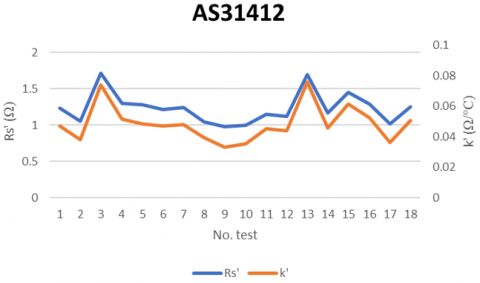
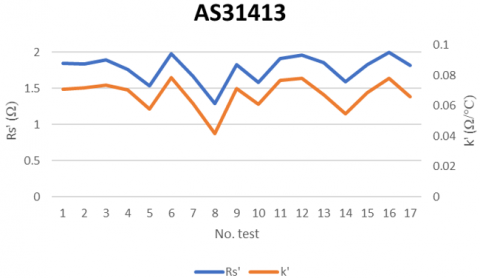
Figure 4, 5, 6 and 7 represent the correction parameters found for the remaining PV modules. As can be noted, the trend of the two quantities are similar under a qualitative point of view. As regards the temperature coefficient k’, it can be seen that the average value found for the five PV modules is equal to about 0.050 Ω/°C. The values found for the internal series resistance, instead, seem to be significatively different among the five modules, and similar only for the modules with serial number AS31409 and AS31412 (Figure 4 and 6).
Figure 2. Comparison between STC I-V curves determined with flash tests and calculation model
Figure 3. Rs’ and k’ determined with the minimization routine for the module AS31408
Figure 4. Rs’ and k’ determined with the minimization routine for the module AS31409
The mean values of the correction parameters, determined for each PV module, are provided in Table 3. The same table reports the error deviation calculated for the voltage, RMSE V, determined as defined in Eq. (3). The deviation of the current, RMSE I, was calculated in a similar fashion. Based on the results reported in Table 3, it can be noted that the current deviation is very low and basically the same for each module. The error determined for the voltage, instead, is an order of magnitude greater, and this is due to the computational effort spent by the minimization routine to find the values of the parameters that minimize the RMSE. On the other hand, the RMSE V values are rather similar.
Figure 5. Rs’ and k’ determined with the minimization routine for the module AS31411
Figure 6. Rs’ and k’ determined with the minimization routine for the module AS31412
Figure 7. Rs’ and k’ determined with the minimization routine for the module AS31413
Table 3. Summary for Rs’, k’, RMSE I, RMSE V for each PV module
|
Module serial number |
Rs’ (Ω) |
k’ (Ω/°C) |
RMSE I (A) |
RMSE V (V) |
|
AS31408 |
1.065 |
0.042 |
0.031 |
0.158 |
|
AS31409 |
1.236 |
0.049 |
0.032 |
0.160 |
|
AS31411 |
1.429 |
0.059 |
0.030 |
0.185 |
|
AS31412 |
1.233 |
0.048 |
0.032 |
0.165 |
|
AS31413 |
1.775 |
0.067 |
0.032 |
0.189 |
In the present work, a minimization routine to estimate the correction parameters necessary to translate photovoltaic I-V (current-voltage) curves from operating conditions (OPCs) into standard test conditions (STCs) was proposed. The routine can be implemented in typical calculation software and does not require specific experimental tests. The procedure only requires OPC and STC I-V curves of the modules being analyzed, measurements that are usually carried out on-site with commercial I-V curve tracers.
According to the results of the study, which was carried out with a solar simulator and five brand-new photovoltaic (PV) modules of the same brand, the minimization routine is effective in estimating the values of the correction parameters, Rs’ and k’. While the second parameter was found to assume a similar value for different tests, and for different PV modules, the first parameter seems to range in a greater interval and assumed significatively different values for the modules under study.
In order to confirm the results of the minimization routine, further experimental tests could be carried out. Specifically, the experimental procedure proposed in IEC 60891 to determine the mean values of the two correction parameters could be followed, and the corresponding results compared with those shown in the present study. In this way, the routine could be either validated or tuned to further increase the accuracy of the parameters estimate.
|
AM |
air mass |
|
a |
irradiance correction factor for the open circuit voltage |
|
CIGS |
copper indium gallium selenide |
|
Eff |
module efficiency, % |
|
G |
irradiance, W.m-2 |
|
I |
current intensity, A |
|
IR |
infrared |
|
k |
temperature coefficient, Ω.°C-1 |
|
k’ |
temperature coefficient, Ω.°C-1 |
|
NOCT |
nominal operating cell temperature, °C |
|
NREL |
National Renewable Energy Laboratory |
|
n |
number of I-V points |
|
OPC |
operating condition |
|
P |
electrical power, W |
|
PSL |
pulsed solar load |
|
PSS |
pulsed solar simulator |
|
PV |
photovoltaic |
|
Rs’ |
internal series resistance, Ω |
|
RMSE |
root mean square error |
|
STC |
standard test condition |
|
T |
temperature, °C |
|
V |
voltage, V |
|
Greek symbols
|
|
|
a |
short circuit current temperature coefficient, mA.°C-1 |
|
b |
open circuit voltage temperature coefficient, mV.°C-1 |
|
g |
maximum power temperature coefficient, %.°C-1 |
|
Subscripts
|
|
|
1 |
OPC (operating conditions) |
|
2 |
STC (standard test conditions) |
|
max |
maximum |
|
mpp |
maximum power point |
|
oc |
open circuit |
|
rel |
relative |
|
sc |
short circuit |
[1] Jordan, D.C., Silverman, T.J., Wohlgemuth, J.H., Kurtz, S.R., VanSant, K.T. (2017). Photovoltaic failure and degradation modes. Progress in Photovoltaics: Research and Applications, 25(4): 318-326. https://doi.org/10.1002/pip.2866
[2] Roy, J.N., Gariki, G.R., Nagalakhsmi, V. (2010). Reference module selection criteria for accurate testing of photovoltaic (PV) panels. Solar Energy, 84(1): 32-36. https://doi.org/10.1016/j.solener.2009.09.007
[3] International Electrotechnical Commission. (2009). IEC 60891. Procedures for temperature and irradiance corrections to measured IV characteristics of crystalline silicon photovoltaic devices. Second edition.
[4] Abella, M.A., Chenlo, F. (2011). Determination in solar simulator of temperature coefficients and correction parameters of PV modules according to international standards. 2011 37th IEEE Photovoltaic Specialists Conference, Seattle, WA, pp. 002225-002230. https://doi.org/10.1109/PVSC.2011.6186399
[5] Paghasian, K., TamizhMani, G. (2011). Photovoltaic module power rating per IEC 61853-1: A study under natural sunlight. 2011 37th IEEE Photovoltaic Specialists Conference, Seattle, WA, 2011, pp. 002322-002327. https://doi.org/10.1109/PVSC.2011.6186418
[6] Paghasian, K. (2010). Power Rating of Photovoltaic Modules: Repeatability of Measurements and Validation of Translation Procedures. Arizona State University.
[7] Trentadue, G., Pavanello, D., Salis, E., Field, M., Müllejans, H. (2016). Determination of internal series resistance of PV devices: repeatability and uncertainty. Measurement Science and Technology, 27(5): 055005.
[8] Dubey, R., Batra, P., Chattopadhyay, S., Kottantharayil, A., Arora, B.M., Narasimhan, K.L., Vasi, J. (2015). Measurement of temperature coefficient of photovoltaic modules in field and comparison with laboratory measurements. 2015 IEEE 42nd Photovoltaic Specialist Conference (PVSC), New Orleans, LA, 2015, pp. 1-5. https://doi.org/10.1109/PVSC.2015.7355852
[9] International Electrotechnical Commission. (2007). IEC 60904-9. Photovoltaic devices, Part 9.
[10] International Electrotechnical Commission. (2006). 60904-1, Photovoltaic Devices, Part 1: Measurement of Photovoltaic Current-Voltage Characteristics. International Electrotechnical Commission, Geneva, Switzerland. Ed, 2.
[11] Bergstra, J., Bengio, Y. (2012). Random search for hyper-parameter optimization. The Journal of Machine Learning Research, 13(1): 281-305.