Prasath Sivasankaran![]() | Karthiga Rani Dhanaraj*
| Karthiga Rani Dhanaraj*![]()
© 2024 The authors. This article is published by IIETA and is licensed under the CC BY 4.0 license (http://creativecommons.org/licenses/by/4.0/).
OPEN ACCESS
Deep learning was a valuable and effective modeling object classification technique. Furthermore, since huge datasets for clinical images were not always accessible, there are not many accurate algorithms used in diagnostic imaging diagnostics. The researchers used data from Lung Image Database Consortium (LIDC) dataset to explore the feasibility of utilizing deep learning models to detect lung-cancer. Abnormalities on every Computed Tomography (CT) slice are classified by doctor brands. Humans got 174412 examples with 52 images already and related reality data after dimension reduction and rotation. Deep Belief Networks (DBN) Stacked Denotion Autoencoders (SDAE) and Convolutional Neural Networks (CNN) were three Deep Learning techniques that have been designed and developed. The researchers created a method with 28 feature representations and just an Support Vector Machine (SVM) classifier to monitor the effectiveness of deep learning models with those of traditional Computer-Assisted Diagnosis (CADx) systems. CNN, DBNs and SDAE have levels of accuracy of 0.7976, 0.8119 and 0.7929, correspondingly; their proposed conventional CADx has an efficiency of 0.7940 that is rather lesser than DBNs and CNN. Researchers and discovered that a incorrectly labeled nodules utilizing DBNs were 4 percentage bigger than standard CADx, which could be due to the downstream sample selection losing some lesions showing the significance.
deep learning; computer-aided diagnosis, computed tomography: image features
Lung cancer may develop during which aberrant tissues develop and form a tumor. It would be essential to make an accurate diagnosis in the lungs, causing as quickly as possible, particularly in tumors, and also the timing was critical in the identification of tumor cells. The presence of tumour tissue could be detected through a variety of methods. CT and radiography images were used to identify the majority of cases [1]. The contrast enhancement approach for diagnosis of lung cancer utilizing three-dimensional positron emission tomography imagery was incorrect in estimating tumor region in all dimensions and lacks moving objects in assisting the calculation of the size and shape of moving vehicles in the lungs [2]. Because of the high intrinsic platelets associated with CT and intensive samples in many larger and fewer directions, the diagnosis of lung cancer using CT images was never possible. The horizontal width was much higher in this case than in the planar cell values. Computer Vision with HBF produces a circular shape due to a consistent focus on Hessian Eigen Values, resulting in fluctuating brightness, weak and quasi responsiveness for images of different dimensions [3]. It used in the additional statistical change strategy for restoring Magnetic Resonance Imaging (MRI) images, which has limitations in the integration of image attributes, leading to low local effectiveness. Due to the gray-scale dispersion of photographs, the image equalization method to improve the use of histographic equalization was appropriate for black and white images [4]. Because of the unique image processing and lack of clarity and basic knowledge, the Kalman filter method is time consuming. Image processing methods such as Interpol have been used to upgrade high-resolution photographs that require sophisticated computations and result in a lower number of iterations. In recent times, the field of image processing techniques has continued to grow rapidly.
The Lung Image Database Consortium (LIDC) was established by the National Cancer Institute (NCI). The goal of the LIDC is to create an image database that can be accessed online and used as a world-wide research resource for growing, assessing and teaching computer-aided detection (CAD) algorithms for CT-based lung cancer diagnosis and detection. The purpose of creating this database is to allow the linkage of pathological, geographical and temporal actualities with the performance of CAD techniques for lung nodule identification and classification.
The advancements in image analysis equipment, as well as its wide distribution, have increased the efficiency of image analysis for tumor detection. The research discussed in this publication aims to improve imaging to help identify timely signs of diseases occurring in the lungs of individuals [5]. The main goal of the treatment was to improve the sharpness of the image, such as edges, borders and brightness, to make it more suitable for subsequent processing. Increasing the image enhances the contrast ratio of the extracted features so that they can be easily identified, but this does not raise the information's intrinsic contextual information [6]. The challenge in implementing image-enhancing approaches involves measuring the conditions for improvement as an outcome, there have been a plethora of optimization methods accessible, all of which involve interaction measures to achieve satisfactory outcomes. Technologies for frequency response or spatial multiplexing could be used to improve images.
Hinton developed a ground-breaking field of computer vision called Deep Learning, which had been influenced by the structure of the human mind [7]. In-depth learning methods could outperform predictive modeling models by including complex data structure sets at multiple levels. Even ten years ago, the majority of the population believed that this accurate method could only be used for simple image categorization, such as handwriting, to gather information [8]. However, since the invention of the deep learning method, many university researchers have indeed used it increasingly difficult task with responsibility. The champion team in the ImageNet LSVRC-2012 contest effectively categorized 1.2 million elevated photos into 1000 various group with a failure rate for 15.3 percent, compare to 26.2 percent for the second best team [9-11].
A Deep Learning method also won the MICCAI 2013 Day Challenge and also the CIRP 2012 Mitosis Identification Competition. Several studies have used CNN to identify grouped microcalcifications in mammographic CT scans in recent times, with positive reinforcements [12]. Current guidelines for the treatment of second tranche tumors have also been focused on the substantial serving sizes and also the overall lesion size on CT scans, given the clinical significance of solid portion size on CT imaging [13]. Radiographers measure the size of solid chunks in CT scans by hand. In addition, due to intra and guide heterogeneity, exact and reproducible quantification of the solid region on CT scans has been challenging [14]. Numerous researchers have examined the viability of semi-automatic solid part assessment using various Hounsfield measurement thresholds to minimize measure variance, & reported lower variance & higher concordance with pathological values when compared to the traditional measures [15]. Despite these findings, the disadvantages of computer-controlled software approaches are that they are unsuitable for therapeutic application.
Deep learning techniques for classifying respiratory lesions are now more reliable and better than previous traditional techniques. Furthermore, the consistency of classification results between a DL system and a radiologist was similar in terms of interradiologist consistency with a Dice value of only 2.0 percent [16]. If the substantial region of the CT scans can be accurately segmented using DL technology, then the solid material can be measured automatically. To our knowledge, no research has evaluated the methods of DBAs for this reason [17]. In addition, previous research had only used nodules to evaluate the efficiency of the computer. Subsolid lesions greater than 3 cm require considerable evaluation. As a result, the goal of our research would be to see how well an available commercially DL method performed by measuring the solid fraction of clinically proved pulmonary malignant tumors that manifested as second tranche lesions [18]. Traditional segmentation algorithms divide the subject according to the surface properties of the image such as brightness, roughness, gradients, etc. Thresholding, Pyramid Method and Region Growing Technique have been some of the common approaches used in conventional bottom subtraction procedures. Grey-scale contour detection has been selected based on the subject and background that need to be separated [19]. To perform semantic segmentation, each component of the image to be separated was grouped into two types, the target and the background, according to the selected median filter [20]. When the grey-scale disparity between the background of the image and the goal was small, however, accurately and efficiently segment the image becomes a challenge [21].
To complete the delineation work, the Atlas Technique connects the incoming data image to the source images called a map template, and afterward, the names in the map template were transmitted to the incoming data image. The effectiveness of the map product, on the other hand, was highly dependent on data modelling and also the accuracy of the selected map models [22]. Lung cancer appears to exhibit more complex clinical characteristics than other haematological cancers. Because initial clinical identification of lung cancer has often been difficult, the majority of the population suffering from the disease have later stages [23]. People with high-stage pulmonary disease have a survival rate of less than 15%, but this rate could reach 40% to 70% if observed quickly. Consequently, increasing the rate of cure requires an early and precise diagnosis of lung disease. Deep learning in health care can reduce wasted effort and reduce the burden on the appropriate staff [24, 25]. Research on segmentation and classification based on in-depth learning of MRA and VTG in pulmonary diseases was analysed and presented in this area.
3.1 Anisotropic diffusion filter (ADF)
The mathematical model was used to run the SDF. The hypotheses were made in this context: t=0:5; k=5; I=10 seem to be the variables. That a =1 is the length of the convergence point, while 1D filtering masking has been hx =[1- 10] hy =[0-1 1]. Propagation that seems to be asymmetrical was described by
$\vec{h}_x=X(i, j) * h_x ; \vec{h}_y=X(i, j) * h_y$ (1)
Diffusion function (d) is given by,
$d_i=\frac{1}{1+\left(\frac{\vec{n}_i}{k}\right)^2} ; d_j=\frac{1}{1+\left(\frac{\vec{n}_j}{k}\right)^2}$ (2)
The Discrete Partial Difference Equation was
$\sum_0^x X(i, j)=X(i, j)+\delta_t d_i \frac{\vec{n}_i}{a^2}+\delta_t d_j \frac{\vec{n}_j}{a^2}$ (3)
The Peak Signal to Noise Ratio (PSNR) is given by
$P S N R=10 \log _{10} \frac{\left(255^2\right)}{M S E}$ (4)
Mean Square Error (MSE) calculated by the following equation:
$M S E=\sum_0^{m, n} \frac{E(i, j)}{m \times n}$ (5)
$E(i, j)=\sum_0^{m, n} X(i, j)-R(i, j)$ (6)
Algorithm for ADF
Step 1: To identify lung cancer, upload the image to the data bases.
Step 2: Configure a profile that includes the 1D wavelet coefficients.
Step 3: Convolve the image with the adaptive filter for the difference method.
Step 4: Using finite variances and the initialized variables, calculate the diffusion function.
Step 5: Answer the continuous total differences equation.
Step 6: Check for PSNR.
3.2 Methods
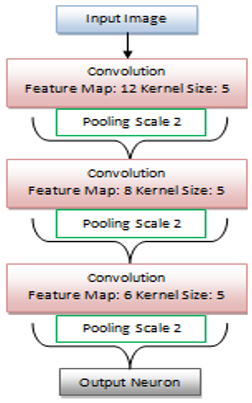
Figure 1. Proposed architecture
Within the LIDC dataset, there appear to be 1018 lung cases from 7 academic institutions and 8 diagnostic imaging firms. Four doctors assessed each CT scan, including suspected visible tumors, on a scale of one to five levels of aggression. There seem to be 5 stages of aggression, ranging from 1 to 5, levels 1 and 2 indicating normal cases while levels 4 and 5 indicate cancerous cases [26]. Researchers eliminated the top and bottom levels of every cubic for every nodule since their size & forms may differ significantly from the remainder of the strata, but they are not typical of the cluster. The remaining levels, including nodular regions, were separated with actual data from the 4 radiologists. This Region of Interest (ROI) are placed at a center of something like a box if segmented could fit into the 52 by 52 pixel rectangle. The ROIs would then be twisted four times and turned into 4 individual vectors, each representing one ROI in one orientation. The number of pixels of the vector was all sampled at an eight-bit velocity. The researchers created 174412 vectors from these 1018 examples, each with 2704 components. Three supervised neural algorithms, CNN, DBN and SDAE, were developed and compared with the same data in this work. On a system with an Intel-Core i7 2.8GHz processor and 16GB 1600MHz DDR3 storage, all programs and investigations have been implemented key. Besides the inlet and outlet levels, our CNN has eight levels, with each and every unusual amount level being a combinational circuit and now every uniform integer level being a pooled and sub-sampling level [27]. Humans have used 12, 8 and 6 convolution layers for each inversion, and all of them are coupled to the max-pooling layer using 5 by 5 nuclei. The training rate was set to 1 per 100 iterations and the sampling size was set to 100. All gradient details were enumerated below.
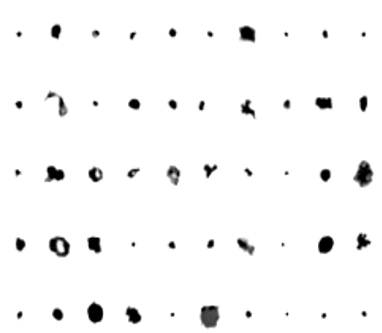
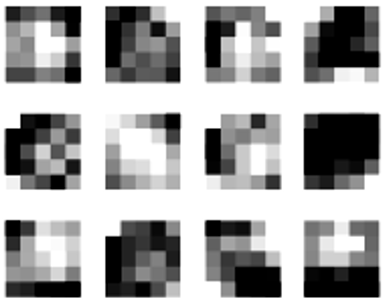
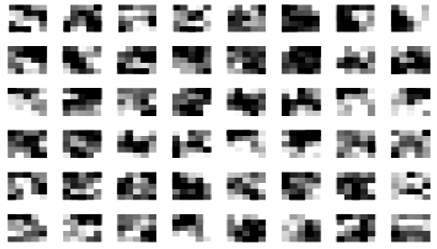
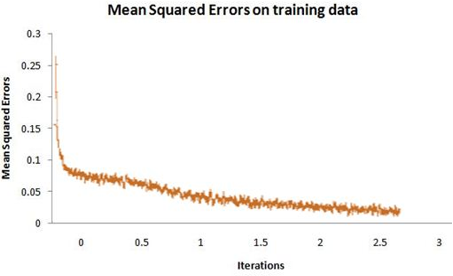
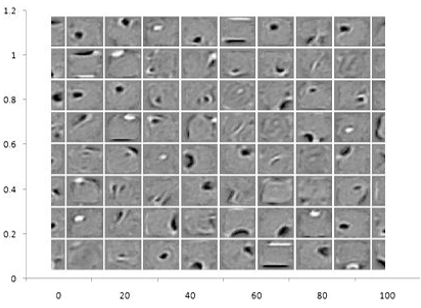
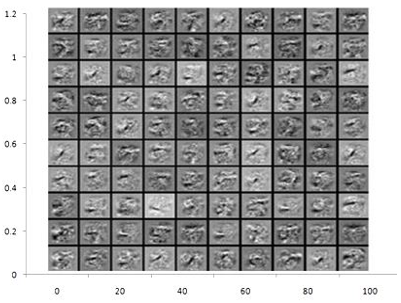
Humans also evaluated the same data sets on our conventional system design to evaluate the results of learning algorithms and computer-aided design (CADx) schematics. Researchers collected 35 characteristics from each ROI, comprising 30 extraction characteristics and 5 morphological characteristics, which are effective in previous investigations. There are 22 GreyLevel Co-occurrence Composite characteristics and 8 wavelet transform among the 30 extraction data. Each layer consists of 600, 400 and 300 convolution layers, with samples of characteristics learned in layer 1 shown in Figure 1. Various curves illustrating the characteristics of the lowest left corner of the nodules may have been seen in the illustration. Layers 1, 2 and 3 include 12, 96 and 48 kernels, correspondingly and also the visualizations of the kernels between the first and last layers were seen in Figures 2 and 3. The total standard error of the training examples was 0.1347 and Figure 4 depicts its evolution across rounds.
Figure 2. CNN provided lung cancer examples of learning representations
The visualization of values in the first and second RBM, which would be a critical component for DBN, can be seen in Figures 5 and 6. In SDAE, neural masses can be viewed in Figure 7.
Table 1 provides a study of the precision levels of the method. The researchers found that DBNs outperformed the other two deep learning methods in terms of test dataset accuracy and mean square error approximation on training examples. Using the same information, the researchers also reviewed the former CADx method for comparative purposes. A feature extraction group and a set of focus features comprise our features. The reliability was 0.7409 at the criterion of 0.6257, which optimizes the surface of the great rectangle underneath the ROC, and also the AUC was 0.7914 when designers solely employ texture characteristics. Reliability was 0.7814 and the AUC was 0.8342 where only the concentration variables were used. When these variables have been combined, humans obtain an efficacy of 0.7940 and also an AUC of 0.8427.
Figure 3. Visualization of 12 kernels of lung cancer
Figure 4. Visualization of 48 kernels of lung cancer
Figure 5. CNN training samples of MSE
Humans quantified the tumor pixel for mislabelled instances and presented the average difference in Table 2 to study a impact of nodular diameter on our system performance. The researchers used the Mann-Whitney test because the range of nodule sizes is not normal. The p-values for any combination of the two categories are <0.0001. The proposed system gives better results in terms of mean and standard deviation when compared with DBN and CNN.
Figure 6. In the first layer of RBM, 100 randomized values were displayed
Figure 7. 100 random weights of neurons using SDAE
Table 1. Comparison of proposed with existing algorithm for performance measures
|
Techniques |
Training Data MSE Value |
Testing Data Accuracy |
|
CNN |
0.1425 |
0.7976 |
|
DBN |
0.1365 |
0.8119 |
|
Proposed System |
0.0352 |
0.9232 |
Table 2. Comparison of proposed system with existing system for mislabeled nodule
|
Method |
Mean |
Standard Deviation |
|
DBN |
301 |
305 |
|
CNN |
293 |
297 |
|
Proposed system |
348 |
346 |
The viability of applying deep structured systems in lung cancer imaging and identification was explored in this work. The researchers developed and compared three distinct supervised learning models: CNN, DBN and SDAE, with the 0.8119. This accuracy of DBN is 0.7940 and can be a little better than proposed system with highest precision of 0.9232 calculated using a standard CADx machine. The comparative results showed that precise algorithms and computer-taught features have a lot of potential in the field of diagnostic imaging. ROI size determination seems to be a crucial step in utilizing deep learning models to diagnose lung images. The scale for the items does not influence the different classifiers in several other image classification methods, such as the ImageNet classification task, therefore all of the photos could be down-sampled to the very same size. The number of lesions & just how you compress the nodular regions were critical for the lung cancer source file, considering the relative cluster size was among the most critical elements of malignant probability. The researchers estimated the pixel nodular diameter of incorrectly labeled instances using CADx-compared DBNs, and found that incorrectly labeled lesions using DBNs were 4% smaller. One possible reason would be that thicker clusters have to be filtered down to fit our ROIs, which can result in loss of some structural data. This research work will be extended for lung cancer image indexing and retrieval to get better retrieval rate. To propose a common methodology this can be apply to all kinds of lung cancer image.
The authors declare no conflict of interest.
[1] Zhang, C., Li, J., Huang, J., Wu, S. (2021). Computed tomography image under convolutional neural network deep learning algorithm in pulmonary nodule detection and lung function examination. Journal of Healthcare Engineering, 2021. https://doi.org/10.1155/2021/3417285
[2] Lalitha, S. (2021). An automated lung cancer detection system based on machine learning algorithm. Journal of Intelligent & Fuzzy Systems, 40(4): 6355-6364. https://doi.org/10.3233/JIFS-189476
[3] Gu, D., Liu, G., Xue, Z. (2021). On the performance of lung nodule detection, segmentation and classification. Computerized Medical Imaging and Graphics, 89: 101886. https://doi.org/10.1016/j.compmedimag.2021.101886
[4] Mukkapati, N., Anbarasi, M.S. (2022). Brain tumor classification based on enhanced CNN model. Revue d'Intelligence Artificielle, 36(1): 125-130. https://doi.org/10.18280/ria.360114
[5] Mehmood, S., Ghazal, T.M., Khan, M.A., Zubair, M., Naseem, M.T., Faiz, T., Ahmad, M. (2022). Malignancy detection in lung and colon histopathology images using transfer learning with class selective image processing. IEEE Access, 10: 25657-25668. https://doi.org/10.1109/ACCESS.2022.3150924
[6] Dou, Q., So, T.Y., Jiang, M., Liu, Q., Vardhanabhuti, V., Kaissis, G., Li, Z., Si, W., Lee, H.H.C., Yu, K., Feng, Z., Dong, L., Burian, E., Jungmann, F., Braren, R., Makowski, M., Kainz, B., Rueckert, D., Glocker, B., Yu S.C.H., Heng, P.A. (2021). Federated deep learning for detecting COVID-19 lung abnormalities in CT: A privacy-preserving multinational validation study. NPJ Digital Medicine, 4(1): 60. https://doi.org/10.1038/s41746-021-00431-6
[7] Latchoumi, T.P., Kalusuraman, G., Banu, J.F., Yookesh, T.L., Ezhilarasi, T.P., Balamurugan, K. (2021). Enhancement in manufacturing systems using Grey-Fuzzy and LK-SVM approach. In 2021 IEEE International Conference on Intelligent Systems, Smart and Green Technologies (ICISSGT), pp. 72-78. https://doi.org/10.1109/ICISSGT52025.2021.00026
[8] Liang, J., Ye, G., Guo, J., Huang, Q., Zhang, S. (2021). Reducing false-positives in lung nodules detection using balanced datasets. Frontiers in Public Health, 9: 671070. https://doi.org/10.3389/fpubh.2021.671070
[9] Majidpourkhoei, R., Alilou, M., Majidzadeh, K., Babazadehsangar, A. (2021). A novel deep learning framework for lung nodule detection in 3d CT images. Multimedia Tools and Applications, 80(20): 30539-30555. https://doi.org/10.1007/s11042-021-11066-w
[10] Binczyk, F., Prazuch, W., Bozek, P., Polanska, J. (2021). Radiomics and artificial intelligence in lung cancer screening. Translational Lung Cancer Research, 10(2): 1186. https://doi.org/10.21037%2Ftlcr-20-708
[11] Nazir, I., Haq, I.U., Khan, M.M., Qureshi, M.B., Ullah, H., Butt, S. (2021). Efficient pre-processing and segmentation for lung cancer detection using fused CT images. Electronics, 11(1): 34. https://doi.org/10.3390/electronics11010034
[12] Pugazhendhi, L.T., Kothandaraman, R., Karnan, B. (2022). Implementation of visual clustering strategy in self-organizing map for wear studies samples printed using FDM. Traitement du Signal, 39(2): 531. https://doi.org/10.18280/ts.390215
[13] Karnan, B., Kuppusamy, A., Latchoumi, T.P., Banerjee, A., Sinha, A., Biswas, A., Subramanian, A.K. (2022). Multi-response optimization of turning parameters for cryogenically treated and tempered WC-Co inserts. Journal of The Institution of Engineers (India): Series D, 103(1): 263-274. https://doi.org/10.1007/s40033-021-00321-x
[14] Lu, Y., Liang, H., Shi, S., Fu, X. (2021). Lung cancer detection using a dilated CNN with VGG16. In 2021 4th International Conference on Signal Processing and Machine Learning, pp. 45-51. https://doi.org/10.1145/3483207.3483215
[15] Vankayalapati, R., Muddana, A.L. (2021). Denoising of images using deep convolutional autoencoders for brain tumor classification. Revue d'Intelligence Artificielle, 35(6): 489-496. https://doi.org/10.18280/ria.350607
[16] Garikapati, P.R., Balamurugan, K., Latchoumi, T.P., Shankar, G. (2022). A quantitative study of small dataset machining by agglomerative hierarchical cluster and K-medoid. In Emergent Converging Technologies and Biomedical Systems: Select Proceedings of ETBS 2021. Singapore: Springer Singapore, pp. 717-727. https://doi.org/10.1007/978-981-16-8774-7_59
[17] Masud, M., Sikder, N., Nahid, A.A., Bairagi, A.K., AlZain, M.A. (2021). A machine learning approach to diagnosing lung and colon cancer using a deep learning-based classification framework. Sensors, 21(3): 748. https://doi.org/10.3390/s21030748
[18] Venkatesh, A.P., Latchoumi, T.P., Chezhian Babu, S., Balamurugan, K., Ganesan, S., Ruban, M., Mulugeta, L. (2022). Multiparametric optimization on influence of ethanol and biodiesel blends on nanocoated engine by full factorial design. Journal of Nanomaterials, 2022. https://doi.org/10.1155/2022/5350122
[19] Ahmed, S.T., Kadhem, S.M. (2021). Using machine learning via deep learning algorithms to diagnose the lung disease based on chest imaging: A survey. International Journal of Interactive Mobile Technologies, 15(16). https://doi.org/10.3991/ijim.v15i16.24191
[20] Tiwari, L., Raja, R., Awasthi, V., Miri, R., Sinha, G.R., Alkinani, M.H., Polat, K. (2021). Detection of lung nodule and cancer using novel Mask-3 FCM and TWEDLNN algorithms. Measurement, 172: 108882. https://doi.org/10.1016/j.measurement.2020.108882
[21] Latchoumi, T.P., Swathi, R., Vidyasri, P., Balamurugan, K. (2022). Develop new algorithm to improve safety on WMSN in health disease monitoring. In 2022 International Mobile and Embedded Technology Conference (MECON), pp. 357-362. https://doi.org/10.1109/MECON53876.2022.9752178
[22] Toğaçar, M. (2021). Disease type detection in lung and colon cancer images using the complement approach of inefficient sets. Computers in Biology and Medicine, 137: 104827. https://doi.org/10.1016/j.compbiomed.2021.104827
[23] Abdullah, D.M., Abdulazeez, A.M., Sallow, A.B. (2021). Lung cancer prediction and classification based on correlation selection method using machine learning techniques. Qubahan Academic Journal, 1(2): 141-149.
[24] Tian, Q., Wu, Y., Ren, X., Razmjooy, N. (2021). A new optimized sequential method for lung tumor diagnosis based on deep learning and converged search and rescue algorithm. Biomedical Signal Processing and Control, 68: 102761. https://doi.org/10.1016/j.bspc.2021.102761
[25] Murugesan, M., Kaliannan, K., Balraj, S., Singaram, K., Kaliannan, T., Albert, J.R. (2022). A hybrid deep learning model for effective segmentation and classification of lung nodules from CT images. Journal of Intelligent & Fuzzy Systems, 42(3): 2667-2679. https://doi.org/10.3233/JIFS-212189
[26] Ismail, M.B.S. (2021). Lung cancer detection and classification using machine learning algorithm. Turkish Journal of Computer and Mathematics Education (TURCOMAT), 12(13): 7048-7054.
[27] Ghaderzadeh, M., Asadi, F., Jafari, R., Bashash, D., Abolghasemi, H., Aria, M. (2021). Deep convolutional neural network-based computer-aided detection system for COVID-19 using multiple lung scans: Design and implementation study. Journal of Medical Internet Research, 23(4): e27468. https://doi.org/10.2196/27468