Ahmed Ezzat*![]() | Osama A. Omer
| Osama A. Omer![]() | Usama S. Mohamed
| Usama S. Mohamed![]() | Ahmed S. Mubarak
| Ahmed S. Mubarak![]()
© 2024 The authors. This article is published by IIETA and is licensed under the CC BY 4.0 license (http://creativecommons.org/licenses/by/4.0/).
OPEN ACCESS
Electrocardiograms (ECGs) and photoplethysmography (PPG) facilitate non-invasive cardiovascular monitoring; however, the correlation between their respective waveforms, which exhibit high cycle correlation, remains underexplored. This study aims to estimate ECG signals from PPG data using an array of Deep Neural Networks (DNNs) across varied transformation feature domains, thereby making PPG measurements a more expedient and less effort-intensive alternative to ECG acquisition. A novel, subject-specific deep learning model is introduced, combining the architectures of Convolutional Neural Networks (CNN) and bidirectional Long Short-Term Memory (BiLSTM), termed ConvBiLSTM. This hybrid model proposes an automatic method for ECG signal reconstruction. To ensure model robustness against deformation, spatial characteristics are first extracted using CNNs, followed by the extraction of temporal characteristics from the CNN output via BiLSTM. The BiLSTM approach mitigates the issues of gradient disappearance and expansion without compromising accuracy, an improvement over traditional RNN and LSTM methods. The performance of four distinct feature domains, namely the Time Domain (TD), Discrete Cosine Transform (DCT), Discrete Wavelet Transform (DWT), and Wavelet Scattering Transform (WST), is evaluated with regards to their efficacy in ECG signal reconstruction from PPG data using the ConvBiLSTM model. Superiority of the proposed DNN combination over individual DNNs was demonstrated through comparison of ConvBiLSTM performance. Simulation results reveal that our method achieves superior root mean square error (RMSE) in ECG signal reconstruction across all feature domains. Given the widespread application of RMSE in ECG monitoring, this metric was chosen as the key evaluation criterion. The combination of WST for PPG signals and DWT for ECG signal features demonstrated the lowest RMSE at 0.0654, indicating the potential of this approach for effective ECG signal reconstruction using PPG data.
PPG, ECG, DNN, Conv-BiLSTM
In terms of worldwide mortality rates, cardiovascular diseases (CVDs) stand alone. CVD encompass a range of conditions affecting the heart and circulatory system. The condition in question encompasses a collection of several disorders, with the primary etiology typically being atherosclerosis [1, 2]. Typically, symptoms are predominantly observed in cases with severe disease, with sudden death being a potential initial manifestation. For an extended period, they have been the primary factor contributing to untimely death on a global scale. According to projections, the annual mortality rate from cardiovascular disease (CVD) is anticipated to reach 23.6 million individuals by the year 2030. CVD can be attributed to a combination of many variables. Certain factors are considered to be unchangeable, such as age, gender, and genetic ancestry, while others are considered to be modifiable, meaning they may be influenced. Examples of modifiable factors include smoking tobacco, physical inactivity, bad eating habits, increased blood pressure, type 2 diabetes, dyslipidemia, and obesity [3]. As reported by the World Health Organization (WHO), 16% of all deaths worldwide can be attributed to ischemic heart disease [4]. Continuous long-term monitoring can prove highly advantageous to medical practitioners in tracking the cardiovascular system's responses to specific medicines or medical interventions. The ability to alter treatment strategies and predict the occurrence of heart failure can be facilitated by this approach.
In health care applications, the electrocardiogram (ECG) and photoplethysmogram (PPG) are the primary signals that are frequently employed. The ECG signal represents the heart’s electrical activity, while the PPG signal records changes in blood volume [5]. Factors such as the location and size of the heart, the body’s fat or thinness, the user’s anatomy, and the position of the electrode can present challenges for ECG, potentially leading to imprecise or abnormal heart rate (HR) readings [6]. ECG technology uses heart electrical impulses instead of blood volume to overcome these issues [5]. The term "electrocardiogram," or "ECG" for short, refers to a recording of the heart's electrical activity. Since its invention in 1902, ECG has become a staple in clinical practice and the gold standard for cardiovascular diagnostics [7]. ECG signals are monitored for a variety of reasons, including general health checks, medical diagnosis, and patient observation prior to surgical procedures. Clinical laboratories currently do ECG monitoring utilizing specialized equipment after extensive training and preparation. In recent decades, numerous portable ECG monitoring devices have been commercially available. Lighter in weight (by a fraction of a pound) and more reliable than their predecessors. However, the durability of these devices is compromised for extended use, as the material employed to ensure satisfactory electrode signal transmission can lead to dermal discomfort and inflammation.
The limitations of the current ECG monitoring devices can be illustrated as follows:
There is a non-invasive method of measuring the pulsating blood volume in tissues called photoplethysmography (PPG) [7]. Typical PPG techniques involve illuminating the tissue using a light-emitting diode and then measuring the intensity of the light that is reflected or transmitted through the tissue using a photodetector on the same or opposite side of the sample. The PPG varies in the opposite direction of blood volume [11], and a pulse of blood modifies the light intensity at the photodetector. When compared to ECG, PPG has a number of advantages, including being cheaper, easier to use, and less time-consuming to set up. Finger/toe clips and pulse oximeters are commonplace in hospitals and clinics, but PPG is also gaining appeal as a consumer-grade wearable gadget because of its ability to monitor patients in real time over extended periods of time without irritating their skin.
PPGs are increasingly recognized as a viable substitute for ECGs, given their ability to capture crucial cardiovascular data. Consequently, there is a surge in research aimed at creating wearable technology that can facilitate constant ECG monitoring, making it a feasible option for daily use. The proposed method involves the perpetual measurement of PPG signals, which are then used to regenerate ECG signals. Patient physiological monitoring with PPG has become popular in recent years. Its non-invasive nature, simplicity, and continuous readings make it ideal for pulse oximetry and personal portable devices. The signal also provides cardiovascular and respiratory information. This strategy is versatile and easy to collect patient physiological data [12]. The PPG signal does not require complex circuitry like the ECG. Without a reference signal, PPG sensors can be integrated into wristbands. These technologies are more accessible than ECG monitoring methods, which need electrodes on the patient's chest [13, 14].
For instance, research has shown that a number of features extracted from PPG [6] are strongly correlated with comparable metrics extracted from ECG [15]. These findings come from a couple of different studies. PPG is now the industry standard for continuous HR tracking in smartwatches, smartphones, and other wearable and mobile devices. PPG has several drawbacks compared to traditional ECG monitoring devices, including inaccurate HR estimation due to skin tone, diverse skin types, motion artifacts, and signal crossovers. ECG waveforms also indicate cardiac function. P-wave suggests sinus rhythm, while long PR intervals indicate first-degree heart blockage. Thus, cardiologists use ECG to evaluate cardiac function.
The main significance of this study is to develop a methodology for reconstructing the entire ECG waveform using the PPG waveform. This approach aims to enable comprehensive patient monitoring and facilitate the acquisition of all necessary data for medical treatment, while also mitigating potential inaccuracies associated with ECG measurement instruments.
The key findings of this study can be encapsulated as follows:
The remainder of this paper is structured in the following manner: Section 2 delves into the literature relevant to the topic, Section 3 outlines the proposed ConvBiLSTM-based method for reconstructing ECG signals across various feature domains, Section 4 provides a detailed analysis of the experimental outcomes, and finally, Section 5 wraps up the paper with concluding remarks.
The connection between ECGs and PPGs has been the subject of some research. PPG and ECG readings for heart rate variability are strongly correlated [16]. PPG periodicity is thus strongly correlated with ECG periodicity. They are also highly linked during episodes of arrhythmia [14, 17, 18]. Some of the most crucial parameters of an ECG are also linked to a pulmonary artery (PPG) pressure reading [19]. You can use information in the PPG to make educated guesses about the PR, QRS, QT, and RR periods. If an ECG can be synthesized from a PPG, we can utilize both the extensive clinical knowledge of signals identified in an ECG and the readily available PPG signals to more accurately assess cardiovascular health.
Benefiting from the association between the two signals can help us gain insight into not only the ECG metrics but also the process of reconstructing the ECG waveform from the PPG reading.
We can divide the related work for the reconstruction of ECG signals into two categories, Generating Synthetic ECG which is based on both signal processing or mathematical modeling, and machine learning for the Signal and ECG Synthesis from PPG which is based on the translation of PPG-to-ECG.
Generating Synthetic ECG Signal: The concept of synthesizing an ECG has been investigated in the past using a variety of methods, including model-driven (such as signal processing or quantitative modeling) and data-driven (machine learning and deep learning) approaches. When it comes to generating ECG segments, some of the earlier works, such as the study [16, 17], suggested solutions that were founded on differential equations and Gaussian models.
Even though deep learning has been used to process ECG for a variety of applications including biometrics [16], arrhythmia detection [18], emotion recognition [19], cognitive load analysis [20, 21], and others, surprisingly few studies have addressed synthesis of ECG signals with deep neural networks [22-24]. Initial studies on the application of Generative Adversarial Networks (GANs) for the synthesis of electrocardiograms proposed the use of a bidirectional Long Short-Term Memory-Convolutional Neural Network (LSTM-CNN) structure. This was employed to create ECG signals from Gaussian noise [25]. The objective was to generate synthetic ECG signals that are specific to each patient, using noise as the input, the research [26] proposed PGAN or Personalized GAN. To simulate the shape of ECG waveforms, a novel loss function was suggested, which incorporated cross-entropy loss and mean squared error to approximate the difference between the two.
Several other studies have attempted to address this issue; for instance, the proposal of Emotional GAN was made in the study [27], which suggested using synthetic ECG to supplement the existing ECG data in order to enhance mood classification accuracy. A new ECG was produced by the suggested GAN using noise as input. Last but not least, related research [28] improved arrhythmia detection performance by generating ECG from input noise to supplement the existing ECG training set.
ECG Synthesis from PPG: To the best of our knowledge, only [9, 10, 29] has been published on the topic of the highly specialized issue of PPG-to-ECG translation. In place of deep learning [9], the discrete cosine transformation (DCT) method was used to convert between PPG and ECG cycles. To do this, we first aligned the PPG signal onsets with the R-peaks of the ECG signals, and then we performed a de-trending procedure to get rid of the noise. After that, we used temporal scaling with linear interpolation to preserve a constant section length for each cycle of ECG and PPG. Finally, the correlation between PPG segment DCT coefficients and their associated ECG segments was learned using a linear regression model. Another study established a mapping connection between PPG and ECG beats by creating a cross-domain joint dictionary learning (XDJDL) model [29]. In the study [10], the authors suggested a method for ECG reconstruction that does not rely on PPG scaling and shifting. The suggested method employs the Wavelet Scattering Transform (WST) as a feature space, which is combined with a deep neural network. This deep learning architecture is capable of discerning the non-linear relationship between ECG and PPG signals when WST is applied, even when the available datasets are limited in size. It's important to note that the suggested system is not signal-based but rather ECG beat-by-beat-based, which means that it learns local features rather than global ones.
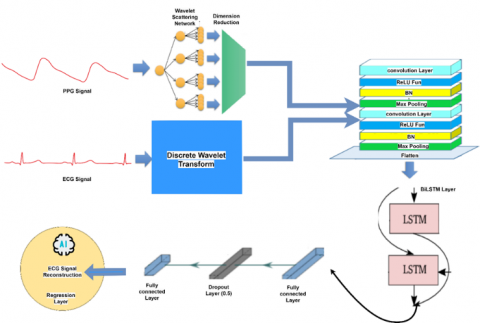
In this study, all systems leveraged the structural resemblance between PPG and ECG beats for estimation purposes. The process of using deep learning to estimate ECG beats from PPG beats is illustrated in Figure 1. The proposed methodology is implemented through a series of steps: (1) creation of the dataset, (2) preprocessing of the data, (3) establishment of the feature domain, (4) partitioning of the data, (5) training of the Deep Learning Neural Network (Conv-BiLSTM) models, and (6) estimation of ECG.
Figure 1. Block diagram for the proposed system model
3.1 Data setup
The joint PPG / ECG data used to train the deep learning network is available in the Physionet MIMIC II dataset (Multi-parameter Intelligent Monitoring in Intensive Care) [30]. The authors [31] presented a more organized compilation of the same dataset. There are almost 12,000 records in this collection. Every single record is composed of data from three sources: ECG (from channel II), PPG (from the fingertip), and ABP (invasive arterial blood pressure measured in mmHg). These data are sampled at a rate of 125 samples per second. However, the PPG signals and the labeled ECG signals are of specific interest to us. Records are segmented into 1024 sample sections for proper handling and filtering. To achieve good performance, Sarkar and Etemad [32] get ready a dataset free of artifacts for use in training and testing a deep learning estimator for a combined PPG / ECG cleaning technique. We use this dataset that contains 175000 cleaned beats instead of 309000 beats of uncleaned data because of the uncleaned data can make an illusion for the deep networks. The dataset is available on their website (https://cibpm.com/).
3.2 Data preprocessing
In the event that the morphology of PPG signals remains constant, it is possible to apply pre-processing enhancement techniques such as bandpass filtering within the frequency range of [0.5-8] Hz exclusively to these PPG signals. Any ECG signals or beats that exhibit significant distortion should be omitted [24]. The pre-processed signals that result from this process are then utilized for feature extraction and the training of learning models.
3.3 Transformation features domain
This section delineates a comparative study among four distinct transformation feature domains, as well as their various combinations. These domains include the Time Domain (TD), the Discrete Cosine Transform (DCT), the Discrete Wavelet Transform (DWT), and the Wavelet Scattering Transform (WST). Specifically, the input series in the time domain already contains the beat interval data. The following are some benefits that can be obtained from each feature domain: The beat interval and the PPG's behavior are time-domain features that are linked to the ECG's behavior in the time domain. Deep features cannot be extracted directly from the PPG beats in the time domain without a massive dataset and complicated network.
Conversely, the DCT feature domain can help reduce the input size with less distortion thanks to the compression of the beats features into a small number of points. For the purpose of this investigation, however, we employed the complete DCT features. One major drawback of this feature domain is the potential for destructive outcomes in ECG prediction due to inaccurate forecasts of the DC and low-frequency components.
Because the DWT domain possesses combinational characteristics that are time and frequency, it is well suited for the estimation of ECG. On the other hand, it is sensitive to signal displacement and scaling, which is something that frequently occurs with PPG sensors. This is a drawback of the product. As a consequence of this, it could result in mistakes brought on by scaling and shifting.
In contrast to DWT, WST is not negatively impacted by the effect caused by the shifting and scaling of the PPG beats. Therefore, WST is an appropriate candidate for use as a feature extraction tool in order to assist the proposed Conv-BiLSTM network in learning the connection between PPG and ECG.
This paper employs seven distinct combinations of input-output, each utilizing different feature domains. These combinations are systematically catalogued in Table 1 as follows:
Table 1. Combinations between input-output for different feature domains
|
Scheme |
PPG Input Domain |
ECG Output Domain |
Abbreviation |
|
TT |
TD |
TD |
PPG-TD / ECG-TD |
|
CT |
DCT |
TD |
PPG-DCT / ECG-TD |
|
CC |
DCT |
DCT |
PPG-DCT / ECG-DCT |
|
WT |
DWT |
TD |
PPG-DWT / ECG-TD |
|
WW |
DWT |
DWT |
PPG-DWT / ECG-DWT |
|
ST |
WST |
TD |
PPG-WST / ECG-TD |
|
SW |
WST |
DWT |
PPG-WST / ECG-DWT |
3.4 Proposed transfer learning method (Conv-BiLSTM)
Figure 2. A schematic representation for the suggested method that integrates scattering wavelet transform with a Conv-BiLSTM deep neural network for the prediction of ECG signals
The ECG beats are estimated using Proposed Conv-BiLSTM sequence-to-sequence regression, with the associated PPG features serving as predictors. With the help of a CNN and BiLSTM, we suggest a method for reconstructing ECG signals from PPG signals as shown in Figure 2. The ECG signal is extracted from the PPG signal using a deep learning approach, which solves a prediction problem. Hybrid model with CNN and BiLSTM is suggested for automatic feature extraction to reconstruct the ECG signal. Our first step in making the model robust to this kind of deformation is to extract spatial features using CNNs [33], which have proven to be effective in the domains of image identification [34, 35] and signal classification [36]. Following the retrieval of spatial features, we apply BiLSTM to CNN's output to pull out temporal features. To get at temporal characteristics, we employ BiLSTM. BiLSTM, a classifier with forward and backward phases, can be suggested for predicting the ECG waveform. Unlike conventional RNN and LSTM, BiLSTM avoids the issues of gradient disappearance and gradient expansion without sacrificing accuracy. However, as stated before, noise can distort a PPG signal. The characteristics extracted by the CNN and BiLSTM are used to generate an electrocardiogram signal.
Convolutional neural networks (CNNs) are a powerful deep learning method [34] due to their capacity for extracting spatial features. (i) the convolutional operation, (ii) the ReLU Function, (iii) the Batch Normalization, and (iv) the pooling operation are the four typical processes in a CNN.
In contrast to the succeeding layers, the filter size in the first convolution layer of the convolution process is set to a wide value. This structure is superior at damping high-frequency impulses when compared to smaller kernels in terms of its ability to do so. When multiple convolutional and pooling layers are stacked on top of one another, it is possible to retrieve higher-level features from the input data. This contributes to a more accurate representation of the input data. Here, we'll use $x_{i j}^l$ to represent the features in layer $l$ of the feature map and $w_{p, q}$ to represent the convolutional filter's kernel size of $P \times Q$. When using a convolutional filter with a stride size of $s$, the convolutional process is carried out as:
$u_{i, j}=\sum_{p=0}^{p-1} \sum_{q=0}^{Q-1} X_{s i}+p, s j+q w_{p, q}$ (1)
To improve the convergence rate and prevent gradient vanishing and eruption in the feature extraction block, we use the Rectified Linear Unit (ReLU) as the activation function. An improved version of the retrieve feature $u_{i, j}$ is then obtained by applying the ReLU activation function, and the corresponding layer $x_{i j}^{l+1}$ element of the feature map is then calculated as:
$x_{i j}^{l+1}={ReLU}\left(u_{i, j}\right)$ (2)
After each convolution layer, the network employs the Maxpooling layer to further decrease the dimensions and parameters. The training period can be cut short by using the pooling procedure to reduce the number of features in the feature map. As a standard method for shrinking the feature map, we employ the max pooling algorithm in our suggested model. For a given pooling region $O$ in a given layer $l$, the max pooling algorithm is executed as:
$x_{i j}^{l+1}=\max _{(p, q) \in O} x_{p, q}^l$ (3)
An efficient regularization approach is a batch normalization (BN) algorithm applied after each convolution layer. Since the BiLSTM layer expects its incoming data to be a one-dimensional array, the Convolution layer's multidimensional output data must be flattened by the flatten layer. The LSTM network on the other hand, is a type of RNN that has seen widespread use for analysing time sequence data because of its outstanding performance of the temporal feature extraction. In most cases, an LSTM will have the following components: (i) the LSTM block, (ii) the input gate, (iii) the forget gate, and (iv) the output gate.
Following this procedure, the hidden stat e ($h_t$) is formed:
$f_t={sigmoid}\left(W_f\left[h_{t-1}, x_t\right]+b_f\right)$ (4)
$i_t={sigmoid}\left(W_i\left[h_{t-1}, x_t\right]+b_i\right)$ (5)
$\tilde{c}_t=tanh \left(W_c\left[h_{t-1}, x_t\right]+b_c\right)$ (6)
$o_t={sigmoid}\left(W_o\left[h_{t-1}, x_t\right]+b_o\right)$ (7)
where, $W_i, W_o, W_f$, and $W_c$ presents the weights vector for input, output, forget, and cell gates respectively, $\sigma$ the sigmoid function, and $b_i, b_o, b_f$, and $b_c$ are the bias for input, output, forget, and cell gates respectively. Hidden state ($h_t$) refers to the working memory. Predictions are made with the help of the hidden state, which stores data about prior inputs.
$h_t=o_t * \tanh \left(c_t\right)$ (8)
Specifically, the cell's present state is denoted by the symbol $c_t$:
$c_t=f_t \odot c_{t-1}+i_t \odot \tilde{c}_t$ (9)
where, tanh is the activation function of the hyperbolic tangent. Dot multiplication, denoted by the notation $\odot$.
In the BiLSTM structure, $\vec{h}_t, \overleftarrow{h}_t$ represents the forward and backward hidden sequences respectively, and $\mathcal{Y}_t$ is output sequence.
$\vec{h}_t=\mathcal{H}\left(\boldsymbol{W}_{x \vec{h}} x_t+\boldsymbol{W}_{\overrightarrow{\boldsymbol{h}} \vec{h}} \vec{h}_{t-1}+\boldsymbol{b}_{\overrightarrow{\boldsymbol{h}}}\right)$ (10)
$\overleftarrow{h}_t=\mathcal{H}\left(\boldsymbol{W}_{x \overleftarrow{\hbar}} x_t+\boldsymbol{W}_{\overleftarrow{h} \overleftarrow{h}} \overleftarrow{h}_{t-1}+\boldsymbol{b}_{\overleftarrow{h}}\right)$ (11)
$y_t=\boldsymbol{W}_{\overrightarrow{\boldsymbol{h}} \boldsymbol{y}} \vec{h}_t+\boldsymbol{W}_{\overleftarrow{\boldsymbol{h}} \boldsymbol{y}} \overleftarrow{h}_t+\boldsymbol{b}_{\boldsymbol{y}}$ (12)
Specifically, the following is the mathematical equation of the ConvBiLSTM in the newer gates:
$\vec{h}_t=\mathcal{H}\left(\boldsymbol{W}_{x \vec{h}} \circledast x_t+\boldsymbol{W}_{\overrightarrow{\boldsymbol{h}} \overrightarrow{\boldsymbol{h}}} \circledast \vec{h}_{t-1}+\boldsymbol{b}_{\overrightarrow{\boldsymbol{h}}}\right)$ (13)
$\overleftarrow{h}_t=\mathcal{H}\left(\boldsymbol{W}_{x \overleftarrow{h}} \circledast x_t+\boldsymbol{W}_{\overleftarrow{\boldsymbol{h}} \overleftarrow{h}} \circledast \overleftarrow{h}_{t-1}+\boldsymbol{b}_{\overleftarrow{\boldsymbol{h}}}\right)$ (14)
$y_t=\boldsymbol{W}_{\overrightarrow{\boldsymbol{h}} \boldsymbol{y}} \otimes \vec{h}_t+\boldsymbol{W}_{\overleftarrow{\boldsymbol{h}} \boldsymbol{y}} \otimes \overleftarrow{h}_t+\boldsymbol{b}_{\boldsymbol{y}}$ (15)
where, $\otimes$ denotes the Hadamard product and $\circledast$ is the convolution function.
In a ConvBiLSTM network, we introduce an additional operation: the Hadamard product (denoted by $\otimes$). The Hadamard product combines the output of a convolutional layer with the hidden states from the BiLSTM layers. Specifically, the output sequence in a ConvBiLSTM is obtained by applying the Hadamard product to the convolutional features and the BiLSTM hidden states.
The dropout layer is implemented in between the two fully connected layers. The dropout method is employed to avoid the over-fitting problem. With dropout, only a subset of the network's neurons are taught instead of all of them. Simply stated, some proportion of neurons in each iteration train receive no input and are thus disabled. It encourages the network to home in on more useful characteristics, which improves the model's adaptability.
Including an output layer, the prediction block contains two completely connected layers. After the attention block has collected feature values, the fully connected layer applies a sequence of nonlinear transformations to those values. The ultimate forecasting outcomes are then produced.
The suggested NN for ECG signal estimation from PPG was compared with two state-of-the-art networks namely, BiLSTM and Alexnet.
We trained our models with 90% of the total data and the remaining 10% for testing. There was no overlap between the training and testing datasets. The network is trained using the training dataset, and its parameters are adjusted based on the training error. In this way, the performance of the network can be objectively evaluated. The Adam and SGD optimizers were employed to train the model, both of which are widely utilized for parameter estimation. Notably, the best outcomes were achieved while employing these two optimizers. The choice was made to utilize the Root Mean Square Error (RMSE) loss function in order to assess the accuracy of the reconstructed ECG signal. The initial learning rate, max epochs, and minimum batch size were set to 0.001, 50 and 20, respectively. Both the learning rate and the batch size of the network were optimised through experimentation. MATLAB was used to write all of the codes. Table 2 shows the network's specifications.
4.1 ECG waveform simulation analysis results
In this section, we use the ConvBiLSTM network with a 120×1 sequence regressor output layer to infer the ECG beats from the associated PPG beats. For ECG estimation, there are seven distinct feature domains to choose from, as the output reflects a sequence, and we are interested in the time series ECG. These combinations illustrated before in Table 1.
Table 2. Network specifications
|
Number of Signals |
154540 |
|
Signal Length |
120 |
|
Number of channels |
14 |
|
Layer specifications |
Sequence input with 120 dimensions |
|
Convolution 1d Layer |
|
|
Batch Normalization Layer |
|
|
ReLU Layer |
|
|
Max Pooling 1d Layer |
|
|
Convolution 1d Layer |
|
|
Batch Normalization Layer |
|
|
ReLU Layer |
|
|
Max Pooling 1d Layer |
|
|
BiLSTM Layer |
|
|
Fully Connected Layer |
|
|
Dropout Layer |
|
|
Fully Connected Layer |
|
|
Regression Output RMSE |
|
|
Learning rate |
0.001 |
|
Max epochs |
50 |
|
Minimum batch size |
20 |
|
Optimization function |
L2-Norm |
|
Optimization method |
ADAM / SGDM |
Table 3. PPG / ECG RMSE comparison for ADAM optimizer
|
Network |
BiLSTM |
Alexnet |
ConvBiLSTM |
|
Transformation |
|||
|
SW |
0.0693 |
0.07194 |
0.0654 |
|
ST |
0.0703 |
0.0734 |
0.0682 |
|
WW |
0.075 |
0.0723 |
0.0668 |
|
WT |
0.0755 |
0.0749 |
0.066 |
|
CC |
0.0736 |
0.0754 |
0.0722 |
|
CT |
0.0726 |
0.0747 |
0.0706 |
|
TT |
0.0801 |
0.0749 |
0.0686 |
Table 4. PPG / ECG RMSE comparison for SGDM optimizer
|
Network |
BiLSTM |
Alexnet |
ConvBiLSTM |
|
Transformation |
|||
|
SW |
0.06308 |
0.0726 |
0.0346 |
|
ST |
0.05328 |
0.0703 |
0.0499 |
|
WW |
0.0511 |
0.0726 |
0.05 |
|
WT |
0.0509 |
0.0704 |
0.0546 |
|
CC |
0.0614 |
0.07073 |
0.0569 |
|
CT |
0.0618 |
0.0744 |
0.059 |
|
TT |
0.0532 |
0.0744 |
0.0538 |
Table 5. PPG / ECG RMSE comparison for rmsprop optimizer
|
Network |
BiLSTM |
Alexnet |
ConvBiLSTM |
|
Transformation |
|||
|
SW |
0.0694 |
0.1628 |
0.0671 |
|
ST |
0.0741 |
0.1734 |
0.072 |
|
WW |
0.0713 |
0.1671 |
0.0692 |
|
WT |
0.0703 |
0.1676 |
0.0694 |
|
CC |
0.073 |
0.1516 |
0.068 |
|
CT |
0.0711 |
0.1812 |
0.0761 |
|
TT |
0.0744 |
0.1557 |
0.0737 |
From the simulation results shown in Table 3, we can see that, for ADAM optimizer with the ConvBiLSTM network has the best result in sense of RMSE for all combinations when using different feature domains (SW, ST, WW, WT, CC, CT and TT). Finally, for ADAM optimizer, the best result is obtained when using ConvBiLSTM NN with SW feature domain. From the simulation results shown in Table 4, we can find that, for SGDM optimizer ConvBiLSTM have a best result in sense of RMSE when using feature domains (SW, ST, WW, CC, and CT). BiLSTM NN have best results for the remaining feature domains (WT and TT). Finally, for SGDM optimizer, the best result is obtained when using ConvBiLSTM NN with SW feature domain.
In addition to ADAM and SGDM, we also evaluate the performance of Rmsprop as an optimizer as shown in Table 5. However, the results obtained with Rmsprop are notably inferior when compared to ADAM and SGDM, especially with Alexnet DNN.
Table 6 presents the results for the proposed Conv-BiLSTM model. It is observed that the optimizer SGDM achieves a superior performance of 0.0346 when utilizing the proposed WST-DWT (SW) domains, outperforming other optimizers.
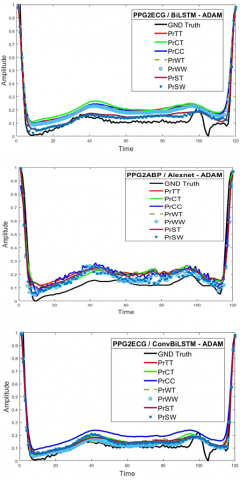
Figure 3. The reconstruction of ECG signals utilizing various DNNs and diverse transformation techniques, in conjunction with the ADAM optimizer
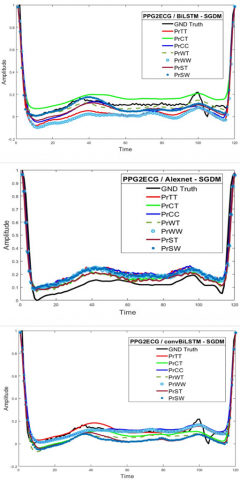
Figure 4. The reconstruction of ECG signals utilizing various DNNs and diverse transformation techniques, in conjunction with the SGDM optimizer
Table 6. PPG / ECG RMSE comparison for the proposed Conv-BiLSTM with various optimizers
|
Network |
ADAM |
SGDM |
Rmsprop |
|
Transformation |
|||
|
SW |
0.0654 |
0.0346 |
0.0671 |
|
ST |
0.0682 |
0.0499 |
0.072 |
|
WW |
0.0668 |
0.05 |
0.0692 |
|
WT |
0.066 |
0.0546 |
0.0694 |
|
CC |
0.0722 |
0.0569 |
0.068 |
|
CT |
0.0706 |
0.059 |
0.0761 |
|
TT |
0.0686 |
0.0538 |
0.0737 |
4.2 ECG beat reconstruction results
The plot of the reconstructed ECG beats is displayed in Figure 3 for ADAM optimizer and Figure 4 for SGDM optimizer, along with a variety of feature domains and individual instances. These figures demonstrate that there is a strong relationship and correlation between the estimated ECG beat and the ground truth ECG beat for the proposed ConvBiLSTM NN method when WST-DWT combination is used to analyze the data.
4.3 ECG signal reconstruction results
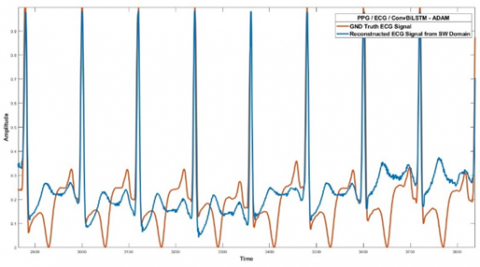
In this section, we collect 200 beats which indicate the complete ECG signal of one patient and try with the proposed ConvBiLSTM to estimate the patient ECG Signal from the PPG signal. As shown in Figure 5 we can see that the ECG signal can be estimated well at the peak of the signal and at the Beginning of the signal but except the notch at the end of the beat.
Figure 5. ECG signal reconstruction using the proposed ConvBilSTM with SW domain for collecting of 200 beats for the 1st patient
In this article, we introduced a method for the estimation of ECG signals from PPG signals using DNNs. The proposed system is based on the hybrid combination of deep learning networks with CNN and BiLSTM known as ConvBiLSTM for various feature domains. The algorithm was successfully evaluated with both the proposed Conv-BiLSTM DNN Model and with the combination of WST-DWT domains for PPG to ECG signal reconstruction. The effectiveness of the proposed ConvBiLSTM in estimating ECG signals is demonstrated by comparison with various other DNNs. An examination of a variety of distinct feature domains is conducted to demonstrate the efficacy of a combination of Wavelet Scattering Transform (WST) at PPG signal and DWT at ECG signal for the estimation of ECG signals. One of the primary benefits of utilizing the WST is its inherent independence from shifting and scaling operations. Hence, the ability to identify the ECG signal remains unaffected by any potential shifting or scaling of the PPG signal. The utilization of the DWT is preferred over the WST for ECG signal analysis due to the unavailability of an inverse function for WST. Consequently, the DWT is employed as a substitute for WST in ECG signal processing. The Proposed ConvBiLSTM scheme demonstrated superior performance when compared to the BiLSTM and Alexnet schemes, as highlighted by the results obtained from the simulation, so the superiority of the proposed system added a new system with better performance for extracting ECG signal from the PPG signal.
|
ECG |
Electrocardiogram |
|
PPG |
Photoplethysmography |
|
CNN |
Convolutional neural network |
|
DCT |
Discrete cosine transform |
|
DNN |
Deep neural network |
|
DWT |
Discrete wavelet transform |
|
GAN |
Generative adversarial network |
|
BiLSTM |
Bidirectional Long short-term memory |
|
PGAN |
Personalized GAN |
|
PPG |
Photoplethysmography |
|
WST |
Wavelet Scattering transform |
|
HR |
Heart rate |
|
TD |
Time domain |
|
ReLU |
Rectified Linear Unit |
|
Subscripts |
|
|
$w_{p, q}$ |
Convolutional filter's kernel size of $P \times Q$ |
|
$\vec{h}_t$ |
Forward hidden sequences |
|
$\overleftarrow{h}_t$ |
Backward hidden sequences |
[1] https://www.who.int/news-room/fact-sheets/detail/thetop-10-causes-of-death, accessed on 20 August 20.
[2] Dutt, D.N., Shruthi, S. (2015). Digital processing of ECG and PPG signals for study of arterial parameters for cardiovascular risk assessment. In 2015 International Conference on Communications and Signal Processing (ICCSP), Melmaruvathur, India, pp. 1506-1510. https://doi.org/10.1109/ICCSP.2015.7322766
[3] Reisner, A., Shaltis, P.A., McCombie, D., Asada, H.H., Warner, D.S., Warner, M.A. (2008). Utility of the photoplethysmogram in circulatory monitoring. The Journal of the American Society of Anesthesiologists, 108(5): 950-958. https://doi.org/10.1097/ALN.0b013e31816c89e1
[4] Al-Naji, A., Gibson, K., Lee, S.H., Chahl, J. (2017). Monitoring of cardiorespiratory signal: Principles of remote measurements and review of methods. IEEE Access, 5: 15776-15790. https://doi.org/10.1109/ACCESS.2017.2735419
[5] Banerjee, R., Sinha, A., Choudhury, A.D., Visvanathan, A. (2014). PhotoECG: Photoplethysmographyto estimate ECG parameters. In 2014 IEEE International Conference on Acoustics, Speech and Signal Processing (ICASSP), Florence, Italy, pp. 4404-4408. https://doi.org/10.1109/ICASSP.2014.6854434
[6] McSharry, P.E., Clifford, G.D., Tarassenko, L., Smith, L. A. (2003). A dynamical model for generating synthetic electrocardiogram signals. IEEE Transactions on Biomedical Engineering, 50(3): 289-294. https://doi.org/10.1109/TBME.2003.808805
[7] Sayadi, O., Shamsollahi, M.B., Clifford, G.D. (2010). Synthetic ECG generation and Bayesian filtering using a Gaussian wave-based dynamical model. Physiological Measurement, 31(10): 1309. https://doi.org/10.1088/0967-3334/31/10/002
[8] Zhang, Q., Zhou, D., Zeng, X. (2017). HeartID: A multiresolution convolutional neural network for ECG-based biometric human identification in smart health applications. IEEE Access, 5: 11805-11816. https://doi.org/10.1109/ACCESS.2017.2707460
[9] Hannun, A.Y., Rajpurkar, P., Haghpanahi, M., Tison, G.H., Bourn, C., Turakhia, M.P., Ng, A.Y. (2019). Cardiologist-level arrhythmia detection and classification in ambulatory electrocardiograms using a deep neural network. Nature Medicine, 25(1): 65-69. https://doi.org/10.1038/s41591-018-0268-3
[10] Sarkar, P., Etemad, A. (2020). Self-supervised ECG representation learning for emotion recognition. IEEE Transactions on Affective Computing, 13(3): 1541-1554. https://doi.org/10.1109/TAFFC.2020.3014842
[11] Sarkar, P., Etemad, A. (2020). Self-supervised learning for ecg-based emotion recognition. In ICASSP 2020-2020 IEEE International Conference on Acoustics, Speech and Signal Processing (ICASSP), Barcelona, Spain, pp. 3217-3221. https://doi.org/10.1109/ICASSP40776.2020.9053985
[12] Sarkar, P., Ross, K., Ruberto, A.J., Rodenbura, D., Hungler, P., Etemad, A. (2019). Classification of cognitive load and expertise for adaptive simulation using deep multitask learning. In 2019 8th International Conference on Affective Computing and Intelligent Interaction (ACII), Cambridge, UK, pp. 1-7. https://doi.org/10.1109/ACII.2019.8925507
[13] Ross, K., Sarkar, P., Rodenburg, D., Ruberto, A., Hungler, P., Szulewski, A., Etemad, A. (2019). Toward dynamically adaptive simulation: Multimodal classification of user expertise using wearable devices. Sensors, 19(19): 4270. https://doi.org/10.3390/s19194270
[14] Zhu, F., Ye, F., Fu, Y., Liu, Q., Shen, B. (2019). Electrocardiogram generation with a bidirectional LSTM-CNN generative adversarial network. Scientific Reports, 9(1): 6734. https://doi.org/10.1038/s41598-019-42516-z
[15] Golany, T., Lavee, G., Yarden, S.T., Radinsky, K. (2020). Improving ECG Classification Using Generative Adversarial Networks. In Proceedings of the AAAI conference on artificial intelligence, 34(8): 13280-13285. https://doi.org/10.1609/aaai.v34i08.7037
[16] Golany, T., Radinsky, K. (2019). PGANS: Personalized generative adversarial networks for ECG synthesis to improve patient-specific deep ECG classification. In Proceedings of the AAAI Conference on Artificial Intelligence, 33(1): 557-564. https://doi.org/10.1609/aaai.v33i01.3301557
[17] Devendran, M., Rajendran, I., Ponnusamy, V., Marur, D.R. (2021). Optimization of the convolution operation to accelerate deep neural networks in FPGA. Revue d'Intelligence Artificielle, 35(6): 511-517. https://doi.org/10.18280/ria.350610
[18] Chen, G., Zhu, Y., Hong, Z., Yang, Z. (2019). Emotional GAN: Generating ECG to enhance emotion state classification. In Proceedings of the 2019 International Conference on Artificial Intelligence and Computer Science, Wuhan Hubei China, pp. 309-313. https://doi.org/10.1145/3349341.3349422
[19] Zhu, Q., Tian, X., Wong, C.W., Wu, M. (2021). Learning your heart actions from pulse: ECG waveform reconstruction from PPG. IEEE Internet of Things Journal, 8(23): 16734-16748. https://doi.org/10.1109/JIOT.2021.3097946
[20] Tian, X., Zhu, Q., Li, Y., Wu, M. (2020). Cross-domain joint dictionary learning for ECG reconstruction from PPG. In ICASSP 2020-2020 IEEE International Conference on Acoustics, Speech and Signal Processing (ICASSP), Barcelona, Spain, pp. 936-940. https://doi.org/10.1109/ICASSP40776.2020.9054242
[21] Omer, O.A., Salah, M., Hassan, A.M., Mubarak, A.S. (2022). Beat-by-beat ECG monitoring from photoplythmography based on scattering wavelet transform. Traitement du Signal, 39(5): 1483-1488. https://doi.org/10.18280/ts.390504
[22] Goldberger, A.L., Amaral, L.A., Glass, L., Hausdorff, J.M., Ivanov, P.C., Mark, R.G., Stanley, H.E. (2000). PhysioBank, PhysioToolkit, and PhysioNet: Components of a new research resource for complex physiologic signals. Circulation, 101(23): e215-e220. https://doi.org/10.1161/01.CIR.101.23.e215
[23] Kachuee, M., Kiani, M.M., Mohammadzade, H., Shabany, M. (2015). Cuff-less high-accuracy calibration-free blood pressure estimation using pulse transit time. In 2015 IEEE International Symposium on Circuits and Systems (ISCAS), Lisbon, Portugal, pp. 1006-1009. https://doi.org/10.1109/ISCAS.2015.7168806
[24] Salah, M., Omer, O.A., Hassan, L., Ragab, M., Hassan, A.M., Abdelreheem, A. (2022). Beat-based PPG-ABP cleaning technique for blood pressure estimation. IEEE Access, 10: 55616-55626. https://doi.org/10.1109/ACCESS.2022.3175436
[25] Fisher, E.M., Shaffer, R.E. (2014). Considerations for recommending extended use and limited reuse of filtering facepiece respirators in health care settings. Journal of Occupational and Environmental Hygiene, 11(8): D115-128. http://dx.doi.org/10.1080/15459624.2014.902954
[26] Kralj, V., Brkić Biloš, I. (2013). Morbidity and mortality from cardiovascular diseases. Cardiologia Croatica, 8(10-11): 373-378.
[27] Reiner, Ž., Catapano, A.L., De Backer, G. (2011). ESC/EAS Džepne smjernice. ESC/EAS smjernice za liječenje dislipidemija, prilagođeno prema ESC smjernicama za liječenje dislipidemija. European Heart Journal, 32: 1769-1818.
[28] Bassiouni, M.M., Hegazy, I., Rizk, N., El-Dahshan, S.A., Salem, A.M. (2021). Combination of ECG and PPG signals for healthcare applications: A survey. Advances in Modelling and Analysis, 64(1-4): 63-70. https://doi.org/10.18280/ama_b.641-409
[29] Papini, G.B., Fonseca, P., Aubert, X.L., Overeem, S., Bergmans, J.W., Vullings, R. (2017). Photoplethysmography beat detection and pulse morphology quality assessment for signal reliability estimation. In 2017 39th Annual International Conference of the IEEE Engineering in Medicine and Biology Society (EMBC), Jeju, Korea (South), pp. 117-120. https://doi.org/10.1109/EMBC.2017.8036776
[30] Luz, E.J.D.S., Nunes, T.M., De Albuquerque, V.H.C., Papa, J.P., Menotti, D. (2013). ECG arrhythmia classification based on optimum-path forest. Expert Systems with Applications, 40(9): 3561-3573. https://doi.org/10.1016/j.eswa.2012.12.063
[31] Zhao, D., Sun, Y., Wan, S., Wang, F. (2017). SFST: A robust framework for heart rate monitoring from photoplethysmography signals during physical activities. Biomedical Signal Processing and Control, 33: 316-324. https://doi.org/10.1016/j.bspc.2016.12.005.
[32] Sarkar, P., Etemad, A. (2021). Cardiogan: Attentive generative adversarial network with dual discriminators for synthesis of ECG from PPG. In Proceedings of the AAAI Conference on Artificial Intelligence, 35(1): 488-496). https://doi.org/10.1609/aaai.v35i1.16126
[33] Lawrence, S., Giles, C.L., Tsoi, A.C., Back, A.D. (1997). Face recognition: A convolutional neural-network approach. IEEE Transactions on Neural Networks, 8(1): 98-113. https://doi.org/10.1109/72.554195
[34] Ronneberger, O., Fischer, P., Brox, T. (2015). U-net: Convolutional networks for biomedical image segmentation. In Medical Image Computing and Computer-Assisted Intervention–MICCAI 2015: 18th International Conference, Munich, Germany, pp. 234-241. https://doi.org/10.1007/978-3-319-24574-4_28
[35] He, K., Zhang, X., Ren, S., Sun, J. (2016). Deep residual learning for image recognition. In Proceedings of the IEEE Conference on Computer Vision and Pattern Recognition, Las Vegas, NV, USA, pp. 770-778. https://doi.org/10.1109/CVPR.2016.90
[36] Kiranyaz, S., Ince, T., Gabbouj, M. (2015). Real-time patient-specific ECG classification by 1-D convolutional neural networks. IEEE Transactions on Biomedical Engineering, 63(3): 664-675. https://doi.org/10.1109/TBME.2015.2468589