Subodh Srivastava* | Guddu Kumar | Ritesh K. Mishra | Niharika Kulshrestha
© 2020 IIETA. This article is published by IIETA and is licensed under the CC BY 4.0 license (http://creativecommons.org/licenses/by/4.0/).
OPEN ACCESS
This paper proposes a single framework for segmentation of abnormalities for breast cancer detection from Ultrasound images in presence of Rayleigh noise i.e. noise removal and segmentation are embedded in single step. It accomplishes dual purpose in a single framework simultaneously for the preprocessing and segmentation. The proposed framework comprises of two terms, first term, is used for segmentation which is a modified fuzzy c-means segmentation (MFCM) approach while second term is an adaptive complex diffusion based non linear filter (ACDPDE) that performs as regularization function for removal of Rayleigh noise, enhancement, and edge preservation of ultrasound Image. The various existing segmentation methods viz. K-Means, Texture based, Fuzzy C-Means (FCM), total variation based FCM (TVFCM), Adaptive fourth order PDE based FCM (AFPDEFCM), and the proposed method are evaluated for 50 sample ultrasound images of breast cancer. The region of interest (ROI) segmented image of ultrasound breast tissue is compared with ground truth images. From the acquired results and its analysis, it is observed that the proposed method is more robust and provides better segmentation result for ultrasound images in terms of various performance measures such as Global Constancy error (GCE), Tanimoto coefficient, Variation of Information (VOI), Probability Random Index (PRI), Jaccard coefficient, accuracy, True Positive Rate (TPR), False Positive Rate (FPR), True Negative Rate (TNR), dice index, False Negative Rate (FNR), and Area under curve (AUC). The proposed approach is capable of handling segmentation problem of blocky artifacts while achieving good tradeoff between Rayleigh noise removal and edge preservation. The proposed method may be useful for finding additional 33% cases of breast cancer which is missed or not detected by mammography.
fuzzy C means, complex diffusion, ultrasound image, speckle noise, Rayleigh noise
In past few decades, there have been an increasing number of cancer affected patients. If the detection of cancer is not done at the proper time interval that could directly leads to the risk of patient’s life. So, in order to avoid those crucial cases, early detection of the cancer is very necessary. Several types of methods have been adopted for early detection [1-3]. In this work, we are focusing on the breast cancer’s detection. Breast cancer is widely prevalent form of cancer and is the reason of several deaths. In the India, out of 11 every woman is having breast cancer. It is second major cause of death after lung cancer. 53 percent of the cancers can be detected through mammograms, Ultrasound can pick up 33 percent additional cases of breast cancer that are missed or not detected by mammogram [4-7]. There is wide variation in breast tissues from person to person. If the breast tissues are highly dense, mammograms can be difficult to interpret for tumor diagnosis. For this reason, mammography is not that much efficient for detecting cancer and can vary over a wide range. In contrast to this, ultrasound is useful because it can differentiate between fluid-filled cysts and solid masses [8]. To take out cancerous cell for testing purpose, ultrasound image may guide biopsy needle for inserting in exact cancerous area. Ultrasound is easily available, and is not harmful for a human as well as it is very cost effective [8].
Ultrasound images are playing very important role to detect additional cases of breast cancer which are missed by Mammograms [6, 7, 9]. Various segmentation techniques have been used in order to find out various defects or abnormalities. The objective of image segmentation is to divide an image into various regions while removing objects that remain uncovered. Most important issue is image understanding due to the variety and complexity of images. There are various methods for image segmentation like clustering [10], region growth [11], watershed transform [12], active contour model [13], Graph Cut [14], etc. Among these methodologies, clustering is one of the most popular methods used for image segmentation as a result of its adequacy and speed.
The ultrasound image has several segmentation challenges like accurate segmentation, high quality segmentation with low computation cost, for malign and benign tumor.
Ultrasound imaging is the most outstanding strategies which have been utilized because of its financially low cost and versatility. It may undergo many issues such as artifacts, which makes hard to see to translate the image and acquire quantitative data from them. Ultrasound images may contain additive and multiplicative noises. Multiplicative noise is referred as the speckle noise. Additive noise mostly arises due to electronic, electrical or thermal effect where as multiplicative noise arises due to the interference phenomenon. It was mentioned that speckle is the after effect of the constructive and destructive additive summation of ultrasound echoes. This happen due to ultrasound beats interfere with objects of equivalent size to the sound wavelength and afterwards superposition of acoustical echoes produces a perplexing obstruction design [15].
These noises create an unfortunate result of the image development process in sound imaging that leads to the unclear quality of the ultrasound picture which gives an unclear vision to the doctor and hence improper diagnosis can lead to error in clinical conclusion. Hence, removals of additive as well as multiplicative noises are essentials without losing image details or pixels. Additive noise follows Gaussian distribution and speckle noise follows Rayleigh distribution.
There are several image segmentation approaches reported in respective author’s paper for ultrasound, and mammogram images [16-18] but most segmentation algorithm have their limitation in term accuracy, computational cost. For creation of binary image from gray image, thresholding is very important method [19]. The computational complexity of thresholding approach is low but it suffers from several information loss of ultrasound image, therefore it cannot be used in segmentation of ultrasound image. Clustering based algorithm is widely used in time sensitive applications but has the problem of rigidity of feature point to belong to only one cluster. These algorithms are widely employed for texture based segmentation [20]. K means [21] is a type of unsupervised learning where the variable k indicates the number of clusters. K means is found to be a better option for exclusive clustering but does not use local spatial statistics of the pixels. Fuzzy c means [22-28] is a soft clustering method where the division of image into clusters is based on membership function. But FCM method is found to be sensitive to noise. It assumes the pixels of a cluster have constant intensity while FCM can be preferred for overlapping clusters. Morphological reconstruction based fuzzy c-means clustering algorithm is fast and robust but unable to remove noises [29]. Total variation fuzzy c means (TVFCM) [29] is proposed to improve the segmentation approach of FCM by the introduction of regularization parameter where the Gaussian noise from image is eliminated but failed to remove multiplicative noise. Adaptive Fourth order PDE based FCM (AFPDEFCM) [30, 31] is a fast segmentation approach and appropriate for time critical applications but unable to extract Region of Interest (ROI) perfectly and removal of speckle noise.
Ultrasound image segmentation is challenging due to the interference from speckle noise and fuzziness of boundaries [32-34]. First, speckle reducing complex anisotropic diffusion is used to suppress noise in an ultrasound image and perform a segmentation of image to further classify the disease in development of CAD system as abnormal or normal cysts [35, 36] but this paper restricts to only segmentation to find region of interested (ROI) area.
In present paper, complex diffusion based modified fuzzy c-means segmentation based model is introduced to improve the TVFCM and AFPDEFCM algorithm. The proposed model is able to remove speckle noise, edge preservation, and blocky artifacts on the stage of segmentation of ultrasound image. It incorporates both denoising and segmentation approach in single framework for less computation, and better detection of cancerous or suspicious region. The obtained results show that proposed model is very robust to noise, simple, efficient and reliable for ultrasound images to detect present abnormalities.
The organization of paper is discussed as follows: Section 2 presents the investigation of the general model for a complex diffusion based partial differential equation (CDPDE) non linear filter adapted to speckle noise with MFCM segmentation. The section 3 presents, the result and discussion from proposed approach, and finally section 4 represents the conclusion and future work.
In present section, a hybrid model is introduced for segmentation of ultrasound image in presence of speckle noise which follows Rayleigh distribution [14]. Single framework is designed for segmentation and restoration of ultrasound images. At first, the proposed approach is derived for segmentation to extract region of interest of cancerous or suspicious area. Secondly, it removes noise from segmented image during each of the iteration for better segmentation. Thirdly, it avoids segmentation problem of blocky artifacts and preserve the edges.
The present section is organized into four sub-sections, Section 2.1, presents the analysis of original FCM segmentation approach and examines its limitations and applicability for proposed approach in terms of speckle noise. Section 2.2 presents the modified FCM to overcome the limitations in original FCM. Section 2.3 presents the restoration/ de-noising concept of proposed model for restoration of ultrasound image using adaptive complex diffusion based PDE nonlinear filter adapted (ACDPDE) to noise. Section 2.4 presents the proposed model for segmentation of ultrasound images in presence of speckle noise.
2.1 Classical Fuzzy C Means
It is type of clustering technique which is more robust, prone to blurring and depends upon the strength of segmenting picture elements. Segmenting picture element may belong to more than one cluster. FCM implementation is easy but highly sensitive to noise. It works in intensity of image, boundary condition and spatial context [18, 31].
Value is assigned for each picture element in image by a fuzzy membership function, and starting point is chosen.
J represents the performance index or cost function for membership matrix (U) = [uij], uij degree of a membership function of the data point of ith cluster is xi.
$J\left(U, C_{1}, C_{2}, \ldots . . C_{n})=\sum_{i=1}^{c} J_{j}=\sum_{i=1}^{c} \sum_{j=1}^{N} u_{i j}^{m} d_{i j}^{2}\right.$ (1)
where, $d_{i j}=\left\|x_{j}-c_{i}\right\|$ is the Euclidian distance between ith centroid (ci) of a cluster and jth data point xj. m $\epsilon(1, \infty)$ is a weighting exponent. U have values in the vicinity of 0 and 1 but the summation of degrees of membership of a data point to all partition or segments is constantly equivalent to unity:
$\sum_{i=1}^{c} u_{i j}=1, \forall j=1 \ldots n$ (2)
For getting a minimum dissimilarity function or minimum cost function, Eq. (1) must be satisfied by below mentioned Eqns. (3) and (4).
$c_{i}=\frac{\sum_{j=1}^{n} u_{i j}^{m} x_{j}}{\sum_{j=1}^{n} u_{i j}^{m}}$ (3)
$u_{i j}=\frac{1}{\sum_{k=1}^{c}\left(\frac{d_{i j}}{d_{k j}}\right)^{\frac{2}{m-1}}}$ (4)
Its execution depends on the initial value of membership matrix. The number of clusters must define before execution. The algorithm is kept running for a few iterations, each iteration with various estimations of membership grades of data points to all clusters is always equal to one.
2.2 Modified Fuzzy C Means (MFCM)
The original intensity-based FCM algorithm fails to segment image corrupted by noise, intensity inhomogeneity, imaging artifacts, and outliers [31]. Only considering grey level information, it is efficient for simple texture and background but unable to segment complex texture or corrupted by noise. To improve the segmentation effect, local spatial information is incorporated in cost function [37].
$x=R^{c}(I)$ (5)
where, x is the reconstructed image by RC morphological operation erosion and dilation and I denotes noisy image.
Modified cost function is given below [37]:
$J\left(U, C_{1}, C_{2}, \ldots C_{n}\right)=\sum_{i=1}^{c} J_{j}=\sum_{i=1}^{c} \sum_{j=1}^{q} \alpha_{j} u_{i j}^{m} d_{i j}^{2}$ (6)
$\sum_{j=1}^{n} \alpha_{j}=N$ (7)
where, αj is number of grey value for computing histogram of image, q denote the no. of grey levels contained in x which is generally much smaller than N. And, uij represent degree of fuzzy membership of grey value q with respect c cluster.
To minimize the cost function or to reach minimum dissimilarity from Eq. (6), the following two conditions must be satisfied.
$c_{i}=\frac{\sum_{j=1}^{q} \alpha_{j} u_{i j}^{m} x_{j}}{\sum_{j=1}^{q} u_{i j}^{m}}$ (8)
$u_{i j}=\frac{1}{\sum_{k=1}^{c}\left(\frac{d_{i j}}{d_{k i}}\right)^{\frac{2}{m-1}}}$ (9)
Hence, FCM and MFCM lack enough robustness to noise and outliers, TVFCM was proposed to make FCM robust with noisy data [38]. TVFCM method was used for segmentation and restoration corrupted by Gaussian noise.
For TVFCM the cost function is given below [38]:
$J\left(u, c_{1}, c_{2} \ldots c_{n}\right)=\sum_{i=1}^{c} J_{i}=\sum_{i=1}^{c} J_{i}+\sum_{k=1}^{c} T V\left(u_{i j}\right)$ (10)
Similarly, AFPDEFCM [31, 39] was used for segmentation, restoration and enhancement corrupted by poison noise for biopsy images.
Here, in this paper we propose to couple a complex diffusion based partial differential equation (CDPDE) non linear filter adapted to speckle noise with MFCM segmentation method. This method is achieved for reducing blocking artifacts with preservation of fine edge details for noisy ultrasound image in cancer detection.
2.3 Adaptive complex diffusion based PDE non filter adapted to Rayleigh noise (ACDPDE)
During the acquisition of ultrasound images, when more than one echoes are travelling toward the probe then constructive and destructive additive summation of ultrasound echoes occurred, this phenomenon is called interference, which fluctuate the ultrasound pixel intensity that causes the speckle noise. Speckle noise is type of multiplicative noise which follows Rayleigh distribution that may affect the over segmentation process. To remove the speckle noise, filtering process is required for denoising.
Speckle is having complex amplitude nature, which as
$Z(i, j)=Z_{R}(i, j)+j Z_{I}(i, j)$ (11)
where, ZR and ZI represent as Gaussian independent random variable and having zero mean and variance $\sigma^{2}$ and $(i, j)$ represents pixel coordinates.
The intensity of speckle noise as follows [38]:
$n(i, j)=|(Z(i, j))|^{2}=Z_{R}^{2}+Z_{I}^{2}$ (12)
where, $n(i, j)$ is random variable which follows Rayleigh distribution, ZR and ZI representing real and imaginary part of speckle noise.
The general model of observation reads:
$u_{o}(i, j)=u(i, j) * n(i, j)+\eta(i, j)$ (13)
$u_{o}(i, j)=$ Rayleigh $* u(i, j)+\eta(i, j)$ (14)
where, u0 is observed blurred and noisy ultrasound image; u is true image; $n(i, j)$ is speckle noise; η(i, j) is additive noise. Assuming additive noise is zero.
The probability density function (PDF) of observed or blurred image is [40]:
$p\left(\frac{u}{u_{n}}\right)=\frac{u_{o}}{\sigma^{2}} \exp \left(-\frac{u^{2}}{2 \sigma^{2}}\right)$ (15)
Need to estimate maximum likelihood of u that can be calculated by minimization of negative log likelihood of Rayleigh PDF, is given as follows [40].
$\begin{aligned} U_{M L}=\arg \min \{&\left.-\operatorname{In} p\left(\frac{u}{u_{o}}\right)\right\} =\arg \min \left\{\operatorname{In} \frac{u_{o}}{\sigma^{2}}-\frac{u^{2}}{2 \sigma^{2}}\right\} \end{aligned}$ (16)
Estimated maximum likelihood of u assuming Rayleigh noise is given as:
$U_{M L}=-\frac{u}{\sigma^{2}}$ (17)
The obtained result of $U_{M L}$ can be noise corrupted, so regularization is necessary. By framing the problem in variational framework, the Gibbs prior model, based on energy functional which is obtained in terms of gradient norm of image, gives best estimate of u for additive noise removal [30, 31].
$p(u)=\exp (-\lambda . E(u))$ (18)
$E(u)=\arg \min _{\Omega} \int\left[L\left(p\left(\frac{u}{u_{o}}\right)\right)+\lambda \varphi\left\|\nabla^{2} u\right\|\right] d \Omega$ (19)
where, $E(u)$ is energy functional.
In the case of complex diffusion PDE [22].
$\varphi\left\|\nabla^{2} u\right\|=\nabla^{2}(c(\operatorname{Im}(u)) \nabla u)$ (20)
Putting the value of Eq. (20) in Eq. (19).
$\begin{aligned} E(u)=\arg \min _{\Omega} \int\left[L\left(p\left(\frac{u}{u_{o}}\right)\right)\right.\left.+\lambda \nabla^{2}(c(\operatorname{Im}(u)) \nabla u)\right] d \Omega \end{aligned}$ (21)
The obtained energy functional $E(u)$ , from Eq. (21) is minimized using Euler-Lagrangian minimization technique with combination of gradient decent approach for minimizing the speckle noise which follows Rayleigh distribution from ultrasound image that leads to non linear complex diffusion based PDE filter [41-44].
$\frac{\partial u}{\partial t}=L^{\prime} p\left(\frac{u}{u_{o}}\right)+\lambda \nabla^{2}(c(\operatorname{Im}(u)) \nabla u)$ (22)
With initial condition.
$u_{t=0}=u_{o}$ (23)
$\frac{\partial u}{\partial t}=-\frac{u}{\sigma^{2}}+\lambda \nabla^{2}(c(\operatorname{Im}(u)) \nabla u)$ (24)
Above derived Eq. (24) can be used as prior or second term in proposed frame work.
$c(\operatorname{Im}(u))=\frac{e^{j \theta}}{1+\left(\frac{\operatorname{Im}(u)}{k \theta}\right)^{2}}$ (25)
And $k=\frac{1}{A v g S N R}, A v g S N R=\frac{\operatorname{mean}(u)}{s t d \cdot \operatorname{dev}(u)}$ (26)
For making proposed framework in adaptive nature, k speckle index value must be calculated based on inverse average SNR. To differentiate among homogeneous area, region of contour and edges, k value must be defined positively and keep on changing throughout iterative process of PDE till its convergence.
2.4 The proposed model for segmentation of ultrasound image in presence of Rayleigh noise
The proposed single framework for segmentation and restoration is defined as follows:
$\mathrm{J}=\mathrm{J} 1+\mathrm{J} 2=\sum_{i=1}^{c} J_{i}+\sum_{k=1}^{c} A C P D E(U)_{i j}$ (27)
The main purpose of Eq. (27) is to minimize cost functional.
where, J1 is modified FCM cost function in Eq. (27), taken from Eq. (6) as explained in section 2.2.
$J 1=\sum_{l=1}^{c} \sum_{j=1}^{q} \alpha_{j} u_{i j}^{m} d_{i j}^{2}$ (28)
and J2 is adaptive complex diffusion based non linear filter adapted to Rayleigh noise, as explained in section 2.3, which is responsible for reduction of Rayleigh noise from segmented image in each iteration obtained by minimizing modified cost functional of modified FCM algorithm as mentioned above in Eq. (24). The solution of functional J2 obtained after its minimization as explained in section 2.3.
$J 2=-\frac{u_{i j}}{\sigma^{2}}+\lambda \nabla^{2}\left(c\left(\operatorname{Im}\left(u_{i j}\right)\right) \nabla u_{i j}\right)$ (29)
The overall combined process of segmentation and restoration is as follows:
$\begin{aligned} \frac{u_{i j}^{n+1}-u_{i j}^{n}}{\Delta t}=\arg \min &\left[\sum_{i=1}^{c} \sum_{j=1}^{q} \alpha_{j} u_{i j}^{m} d_{i j}^{2}\right]+\left(-\frac{u_{i j}}{\sigma^{2}}+\lambda \nabla^{2}\left(c\left(\operatorname{Im}\left(u_{i j}\right)\right) \nabla u_{i j}\right)\right) \end{aligned}$ (30)
Finite difference scheme is used for digital implementation of Eq. (30), which is as follows:
$\begin{aligned} u_{i j}^{n+1}=u_{i j}^{n}+\Delta t &\left.\sum_{i=1}^{c} \sum_{j=1}^{q} \alpha_{j} u_{i j}^{m} d_{i j}^{2}\right]+\left(-\frac{u_{i j}^{n}}{\sigma^{2}}\right.+\lambda \nabla^{2}\left(c\left(\operatorname{Im}\left(u_{i j}^{n}\right)\right) \nabla u_{i j}^{n}\right) \end{aligned}$ (31)
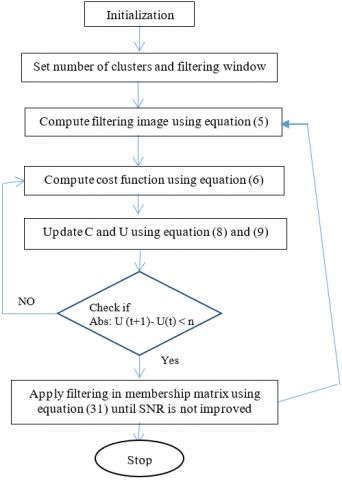
where, $u_{i j}^{n}$ is n-th iteration of estimated image, $u_{i j}^{n+1}$ is current (n+1)th iteration of obtained image. For stability purpose $\Delta t$ is grid constant set to 0.25. $\lambda$ (Regularization parameter) is used for establishing balance between likelihood (data fidelity) term and the complex diffusion PDE during restoration process as discuss in section 2.3. The model flow chart for the proposed method is shown in Figure 1. The block diagram showing each component and its operations for proposed method is given in Figure 2.
If Rayleigh noise is not present in image, then the functional frame work is changed i.e. only applicable for Gaussian noise.
$u_{i j}^{n+1}=u_{i j}^{n}+\Delta t\left[\arg \min \left[\sum_{i=1}^{c} \sum_{j=1}^{q} \alpha_{j} u_{i j}^{m} d_{i j}^{2}\right]\right.\left.+\lambda\left(\nabla^{2}\left(c\left(\operatorname{Im}\left(u_{i j}^{n}\right)\right) \nabla u_{i j}^{n}\right)\right)\right]$
Figure 1. Flowchart for the proposed method
Figure 2. The proposed method for segmentation and restoration of ultrasound images (An iterative process)
In this paper, in order to design single framework of segmentation and restoration technique for finding additional 33% cases of breast cancer, 50 images are taken from database of ultrasound images of breast cancer, provided by the Department of Radiology of Thammasat University and Queen Sirikit Center of Breast Cancer of Thailand [45]. The database includes ultrasound, Doppler and elasticity images along with the ground truth hand-drawn by leading radiologists of these centers. The images are free to download and can be used for training and verification of image segmentation algorithms.
Table 1. Fidelity parameters considered to test the efficiency of proposed method with other algorithms [31]
|
S.No. |
Parameters Name |
Formula |
Remarks |
|
1. |
Probability Random Index (PRI) |
$\operatorname{PRI}(\mathrm{G}, \mathrm{T})=\frac{1}{\left(\frac{\mathrm{N}}{2}\right)} \sum_{\forall \mathrm{i}, \mathrm{j} \& \mathrm{i}<j}\left[\mathrm{c}_{\mathrm{ij}} \mathrm{p}_{\mathrm{ij}}\right.\left.+\left(1-c_{i j}\right)\left(1-p_{i j}\right)\right]$ |
PRI is used for checking similarity between two images, where G is ground truth image and T is test image.cij is pixel pair for same or different level in object image (T). pij is pixel pair for same or different level in ground truth image. N is the total pair pixel of G and T. |
|
2. |
Global consistency Error (GCE) |
$\operatorname{GCE}(G, T)=\frac{1}{n} \min \left\{\sum_{i} E\left(G, T, p_{i}\right)\right.\left.\sum_{j} E\left(G, T, p_{j}\right)\right\}$ $E\left(G, T, p_{i}\right)=\left.\left|R\left(G, p_{i}\right) \backslash T\left(p_{i}\right)\right| /\left|R\left(G, p_{i}\right)\right|\right)$ |
GCE is used for computing the consistency error i.e. achieving the tolerance to refinement for a pair of images, at first a measure of the error at each pixel pi Where, R(G,pi) is the region in segmentation i that contains pixel Pi , \ denote set difference, and |.| |.| denote set cardinality. |
|
3. |
Variation of Information VOI |
VOI(G,T)=H(G)+H(T)-MI(G,T) |
The VOI is used for goodness of segmentation based distances i.e. probability of two pixels belonging to the same segment where H and MI represent the entropies and mutual information between two segmentations G and T, respectively. |
|
4. |
Jaccard Index |
$J_{G, T}=\frac{|G \cap T|}{|G \cup T|}$ |
Jaccard Index, dice coefficient, tanimoto index are used for similarity measurements of pixel of ground truth image G and segmented image T. |
|
Dice Coefficient |
Dice $_{G, T}=\frac{2|G T|}{|G|+|T|}$ |
||
|
Tanimoto Index |
$T_{G T}=\frac{\sum_{i}\left(G_{i} \cap T_{i}\right)}{\sum_{i}\left(G_{i} \cup T_{i}\right)}$ |
||
|
5 |
Accuracy |
Accuracy =$\frac{T P+T N}{T P+T N+F P+F N}$ |
Accuracy, True positive rate, True negative rate, False positive rate and False negative rate are derived in terms of True Positive, True Negative, False Positive, and False Negative. |
|
True Positive Rate (TPR) |
$T P R=\frac{T P}{T P+F N}$ |
||
|
False Positive Rate (FPR) |
$F P R=\frac{F P}{F P+T N}$ |
||
|
True Negative Rate (TNR) |
$T N R=\frac{T N}{T N+F P}$ |
||
|
False Negative Rate (FNR) |
$F N R=\frac{F N}{F N+T P}$ |
For evaluation purpose of the proposed method (ACDPDEMFCM) number of clusters are set to three and window size 3x3 for better performance of result. Morphological operations are evaluated for contour shape of cancerous region. Further, histogram is calculated for local spatial information and reducing the cost computation. Membership function matrix and clusters centre are updated to minimize the cost function of modified FCM. Final segmented and restored result are obtained by using Eq. (31) which contains modified cost function of FCM, Where, average SNR value is updated until its convergence. For experimental and testing purpose, the various segmented methods i.e. FCM, K-Means, Texture based, total variation based FCM(TVFCM), fourth order partial differential equation based FCM(FPDFFCM) and proposed method are compared in Table 2, 3 and 4 using mentioned parameters of Table 1.
From Table 2 and Figure 4, it is observed that PRI is approx one i.e. 0.99682 and GCE and VOI is nearer to 0 i.e. 0.040 and 0.62934 which are better from existing segment techniques.
Similarity measurements are calculated between segmented images and ground truth image for the proposed method. From Table 3 and Figure 5, it is clear that Tanimoto coefficient, Dice coefficient, and Jaccard Index are 0.57857, 0.6898 and 0.57857 respectively which are maximum compare to other existing techniques.
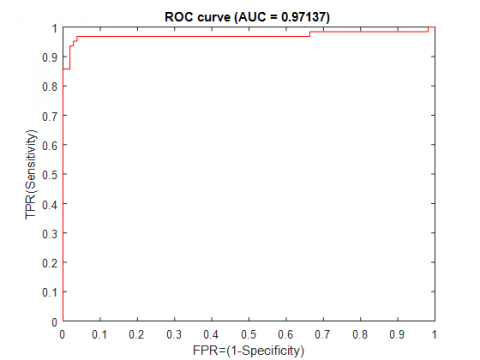
Figure 3. ROC curve for the proposed method
Figure 4. Comparison of proposed method with other Segmentation method in terms of PRI, GCE and VOI
Table 2. Performance of segmentation based on PRI, GCE and VOI
|
Segmentation methods |
PRI |
GCE |
VOI |
|
FCM (7) |
0.6829 |
0.8896 |
0.66853 |
|
K-Means (16) |
0.6532 |
0.8641 |
0.70256 |
|
Texture based (17) |
0.6322 |
0.9853 |
0.66389 |
|
TVFCM (15) |
0.96908 |
0.10162 |
0.52454 |
|
AFPDEFCM (20) |
0.98496 |
0.05823 |
0.9792 |
|
Proposed method |
0.99682 |
0.040 |
0.62934 |
Figure 5. Comparison of proposed method with other segmentation method in terms Tanimoto, Dice and Jaccard Index
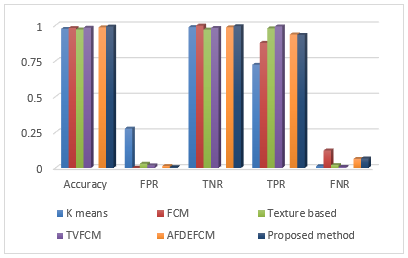
Figure 6. Comparison of proposed method with other segmentation method in terms accuracy, TPR, TNR, FPR, and FNR
For showing better result of proposed method accuracy, TPR, TNR, FPR, FNR are also calculated i.e. respectively 0.99170,9330,0.9946,0.0054 and 0.0670 which are better from other existing method shown in Table 4 and Figure 6 and Area Under Curve (AUC) is also estimated 0.97137 in Figure 3.
where, area under curve (AUC) provides the measurement of segmentation algorithm. The range of AUC lies between 0% and 100%. The range of AUC up 60% represents poor segmentation and greater than 90% represents better segmentation result. Here, with the help of proposed method, AUC value is obtained 97.137%. Figure 7 shows comparative analysis of visual results of different existing methods i.e. K-means segmentation, FCM classical segmentation, TVFCM segmentation, FDFCM segmentation and proposed methods. It is observed that the proposed approach is able to solve the problem of edge preservation, blocky artifacts with multiplicative noise removal i.e. speckle noise which follows Rayleigh distribution on the stage of segmentation of ultrasound image.
Table 3. Performance of segmentation based on similarity measurements
|
Segmentation Methods |
Tanimoto coefficient |
Dice coefficient |
Jaccard index |
|
FCM (7) |
0.4905 |
0.5873 |
0.4905 |
|
K-Means (16) |
0.4873 |
0.5761 |
0.4873 |
|
Texture based (17) |
0.3986 |
0.4678 |
0.3986 |
|
TVFCM (15) |
0.5217 |
0.6119 |
0.5127 |
|
AFPDEFCM (20) |
0.5338 |
0.6214 |
0.5338 |
|
Proposed method |
0.57857 |
0.6898 |
0.57857 |
Table 4. Performance of segmentation based TPR, TNR, FPR and FNR
|
Segmentation methods |
Accuracy |
FPR |
TNR |
TPR |
FNR |
|
K means (16) |
0.9752 |
0.2764 |
0.9876 |
0.7236 |
0.0127 |
|
FCM (7) |
0.9812 |
0.0018 |
0.9982 |
0.8773 |
0.1227 |
|
Texture based (15) |
0.9713 |
0.0299 |
0.9701 |
0.9792 |
0.0208 |
|
TVFCM (17) |
0.9833 |
0.0183 |
0.9817 |
0.9927 |
0.0073 |
|
AFDEFCM (20) |
0.9860 |
0.0136 |
0.9864 |
0.9364 |
0.0636 |
|
Proposed method |
0.9917 |
0.0054 |
0.9946 |
0.9330 |
0.0670 |
(a) Clear/test image (b) Noisy image 0.4 variance(c) K-means segmentation (d) FCM classical segmentation (e) TVFCM segmentation (f) FDFCM segmentation (g) proposed methods (h) ground truth image (i) cluster image
Figure 7. Segmented image result corresponding methods
In this paper, we proposed single framework for segmentation and restoration i.e. to couple modified fuzzy c means segmentation method with complex diffusion based partial differential equation (CDPDE) non linear filter adapted to Rayleigh noise which was capable of handling segmentation problem of blocky artifacts while achieving good tradeoff between noise removals and edge preservation. The proposed method is useful for finding additional 33% cases of breast cancer which was missed or not detected by mammography. For experimental purpose, 21 malign and 29 benign images with size 513× 448 were taken from breast tissue dataset [45]. The performances of various existing segmentation methods i.e., K-Means, Texture based, Fuzzy C- Means(FCM), total variation based FCM (TVFCM), Adaptive fourth order PDE based FCM (AFPDEFCM), and the proposed method (ACDPDEMFCM ) were evaluated for 50 sample ultrasound images of breast cancer evaluated in terms of metrics PRI, GCE, VOI Tanimoto coefficient, Jaccard coefficient, accuracy, TPR, TNR, FPR, FNR, AUC and dice index with varying amount of speckle variance. Finally, the segmented ROI of ultrasound images were compared to ground truth segmented images. From Table 2 and Figure 4, it was observed that PRI is approx one i.e. 0.99682 and GCE and VOI is nearer to 0 i.e. 0.040 and 0.62934, from Table 3 and Figure 5, it was observed that Tanimoto coefficient, Dice coefficient, and Jaccard Index are respectively 0.57857, 0.6898 and 0.57857. From Table 4 and Figure 6, it was observed accuracy, TPR, TNR, FPR, FNR are respectively 0.9917, 0.9946, 0.0054 and 0.0670 which are better from other existing method. AUC was also estimated 0.97137 in Figure 3 and comparative analysis of visual result of other existing methods and proposed method are shown in Figure 7.
Hence, we can conclude, the proposed ACPDEMFCM performing better in terms of all parameters and it is suitable for the segmentation of ultrasound images for cancer detection in presence of Rayleigh noise.
[1] Masulli, F., Rovetta, S. (2006). Soft transition from probabilistic to possibilistic fuzzy clustering. IEEE Transactions on Fuzzy Systems, 14(4): 516-527. https://doi.org/10.1109/TFUZZ.2006.876740
[2] Srivastava, S., Sharma, N., Singh, S.K., Srivastava, R. (2014). Quantitative analysis of a general framework of a CAD tool for breast cancer detection from mammograms. Journal of Medical Imaging and Health Informatics, 4(5): 654-674. https://doi.org/10.1166/jmihi.2014.1304
[3] Kumar, S., Srivastava, A., Srivastava, A. K., Srivastava, V., Nair, T.S., Usmanova, G., Singh, R., Ginsburg, O. (2020). Designing a resource‐stratified, phased implementation strategy for breast health care services in India. Cancer, 126(S10): 2458-2468. https://doi.org/10.1002/cncr.32888
[4] Cancer facts and figures. (2020). http://www.cancer.org/Cancer/BreastCancer/DetailedGuide/breast-cancer-keystatistics, accessed on 20 Jan 2020.
[5] Aswathy, M.A., Jagannath, M. (2017). Detection of breast cancer on digital histopathology images: Present status and future possibilities. Informatics in Medicine Unlocked, 8: 74-79. https://doi.org/10.1016/j.imu.2016.11.001
[6] Bray, F., Ferlay, J., Soerjomataram, I., Siegel, R.L., Torre, L.A., Jemal, A. (2018). Global cancer statistics 2018: GLOBOCAN estimates of incidence and mortality worldwide for 36 cancers in 185 countries. CA: A Cancer Journal for Clinicians, 68(6): 394-424. https://doi.org/10.3322/caac.21492
[7] Rebolj, M., Assi, V., Brentnall, A., Parmar, D., Duffy, S.W. (2018). Addition of ultrasound to mammography in the case of dense breast tissue: Systematic review and meta-analysis. British Journal of Cancer, 118(12): 1559-1570. https://doi.org/10.1038/s41416-018-0080-3
[8] Breast Cancer Signs and Symptoms 2020. https://www.cancer.org/cancer/breast-ancer/about/breast-cancer-signs-and-symptoms, accessed on 20 Jan 2020.
[9] Dabass, J., Dabass, M. (2021). Denoising, edge correction, and enhancement of breast cancer ultrasound images. In: Hura G., Singh A., Siong Hoe L. (eds) Advances in Communication and Computational Technology. Lecture Notes in Electrical Engineering, 668: 1153-1172. https://doi.org/10.1007/978-981-15-5341-7_88
[10] Cao, H., Deng, H.W., Wang, Y.P. (2011). Segmentation of M-FISH images for improved classification of chromosomes with an adaptive fuzzy C-means clustering algorithm. IEEE Transactions on Fuzzy Systems, 20(1): 1-8. https://doi.org/10.1109/TFUZZ.2011.2160025
[11] Javed, A., Kim, Y.C., Khoo, M.C., Ward, S.L.D., Nayak, K.S. (2015). Dynamic 3-D MR visualization and detection of upper airway obstruction during sleep using region-growing segmentation. IEEE Transactions on Biomedical Engineering, 63(2): 431-437 https://doi.org/10.1109/tbme.2015.2462750
[12] Grau, V., Mewes, A.U.J., Alcaniz, M., Kikinis, R., Warfield, S.K. (2004). Improved watershed transforms for medical image segmentation using prior information, IEEE Transactions on Medical Imaging, 23(4): 447-458. https://doi.org/10.1109/TMI.2004.824224
[13] Gong, M., Li, H., Zhang, X., Zhao, Q., Wang, B. (2016). Nonparametric statistical active contour based on inclusion degree of fuzzy sets. IEEE Transactions on Fuzzy Systems, 24(5): 1176-1192. https://doi.org/10.1109/TFUZZ.2015.2505328
[14] Mahapatra, D. (2017). Semi-supervised learning and graph cuts for consensus based medical image segmentation. Pattern Recognition, 63: 700-709. https://doi.org/10.1016/j.patcog.2016.09.030
[15] Burckhardt, C.B. (1978). Speckle in ultrasound B-mode scans. IEEE Transactions on Sonics and Ultrasonics, 25(1): 1-6. https://doi.org/10.1109/T-SU.1978.30978
[16] Pham, D.L., Xu, C., Prince, J.L. (2000). Current methods in medical image segmentation. Annual Review of Biomedical Engineering, 2: 315-337. https://doi.org/10.1146/annurev.bioeng.2.1.315
[17] Srivastava, S., Sharma, N., Singh, S.K., Srivastava, R. (2012). Analysis of image segmentation techniques in the design of a CAD tool for early breast cancer detection from mammograms. Artificial Intelligence and Soft Computing.
[18] Kumar, G., Kulshrestha, N., Srivastava, S. (2019). Analysis of different fuzzy C-means membership functions for the design of CAD tool of early breast cancer detection. In Proceedings of 2nd International Conference on Advanced Computing and Software Engineering (ICACSE).
[19] Arora, S., Acharya, J., Verma, A., Panigrahi, P.K. (2008). Multilevel thresholding for image segmentation through a fast statistical recursive algorithm. Pattern Recognition Letters, 29(2): 119-125. https://doi.org/10.1016/j.patrec.2007.09.005
[20] Malik, J., Belongie, S., Leung, T., Shi, J.B. (2001). Contour and texture analysis for image segmentation. International Journal of Computer Vision, 43: 7-27. https://doi.org/10.1023/A:1011174803800
[21] Ray, S., Turi, R.H. (1999). Determination of number of clusters in k-means clustering and application in colour image segmentation. In Proceedings of the 4th International Conference on Advances in Pattern Recognition and Digital Techniques, pp. 137-143.
[22] Bezdek, J.C., Ehrlich, R., Full, W. (1984). FCM: The fuzzy c-means clustering algorithm. Computers & Geosciences, 10(2-3): 191-203. https://doi.org/10.1016/0098-3004(84)90020-7
[23] Salah, M. (2020). Filtering of remote sensing point clouds using fuzzy C-means clustering. Applied Geomatics, 12: 307-321. https://doi.org/10.1007/s12518-020-00299-3
[24] Kamil, M.Y., Salih, A.M. (2019). Mammography Images Segmentation via Fuzzy C-mean and K-mean. International Journal of Intelligent Engineering and Systems, 12(1): 22-29. https://doi.org/10.22266/ijies2019.0228.03
[25] Zhang, M., Jiang, W., Zhou, X., Xue, Y., Chen, S. (2019). A hybrid biogeography-based optimization and fuzzy C-means algorithm for image segmentation. Soft Computing, 23(6): 2033-2046. https://doi.org/10.1007/s00500-017-2916-9
[26] Mújica-Vargas, D. (2020). Redescending intuitionistic fuzzy clustering to brain magnetic resonance image segmentation. Journal of Intelligent & Fuzzy Systems, 39(1): 1097-1108. https://doi.org/10.3233/JIFS-192005
[27] Feng, L., Li, H., Gao, Y., Zhang, Y. (2020). A color image segmentation method based on region salient color and fuzzy c-means algorithm. Circuits, Systems, and Signal Processing, 39(2): 586-610. https://doi.org/10.1007/s00034-019-01126-w
[28] Park, J., Song, D.H., Nho, H., Hyun-Min, C., Kim, K.A., Park, H.J., Kim, K.B. (2018). Automatic segmentation of brachial artery based on fuzzy C-means pixel clustering from ultrasound images. International Journal of Electrical and Computer Engineering, 8(2): 638. https://doi.org/10.11591/ijece.v8i2.pp638-643
[29] Lei, T., Jia, X., Zhang, X., He, L., Meng, H., Nandi, A.K. (2018). Significantly fast and robust fuzzy c-means clustering algorithm based on morphological reconstruction and membership filtering. IEEE Transactions on Fuzzy Systems, 26(5): 3027-3041. https://doi.org/ 10.1109/TFUZZ.2018.2796074
[30] Srivastava, R., Srivastava, S. (2013). Restoration of Poisson noise corrupted digital images with nonlinear PDE based filters along with the choice of regularization parameter estimation, Pattern Recognition Letters, 34(10): 1175-1185. https://doi.org/10.1016/j.patrec.2013.03.026
[31] Kumar, R., Srivastava, S., Srivastava, R. (2017). A fourth order PDE based fuzzy c-means approach for segmentation of microscopic biopsy images in presence of Poisson noise for cancer detection. Computer Methods and Programs in Biomedicine, 146: 59-68. https://doi.org/10.1016/j.cmpb.2017.05.003
[32] Xu, Y. (2009). Image decomposition based ultrasound image segmentation by using fuzzy clustering. 2009 IEEE Symposium on Industrial Electronics & Applications, Kuala Lumpur, pp. 6-10. https://doi.org/10.1109/ISIEA.2009.5356492
[33] Zhang, Q., Huang, C., Li, C., Yang, L., Wang, W. (2012). Ultrasound image segmentation based on multi-scale fuzzy c-means and particle swarm optimization. IET International Conference on Information Science and Control Engineering 2012 (ICISCE 2012). https://doi.org/10.1049/cp.2012.2294
[34] Tsantis, S., Spiliopoulos, S., Skouroliakou, A., Karnabatidis, D., Hazle, J.D., Kagadis, G.C. (2014). Multiresolution edge detection using enhanced fuzzy C‐means clustering for ultrasound image speckle reduction. Medical Physics, 41(7): 072903. https://doi.org/10.1118/1.4883815
[35] Xu, Y. (2009). A modified spatial fuzzy clustering method based on texture analysis for ultrasound image segmentation. In 2009 IEEE International Symposium on Industrial Electronics, Seoul, pp. 746-751. https://doi.org/10.1109/ISIE.2009.5213933
[36] Moon, W.K., Chang, S.C., Huang, C.S., Chang, R.F. (2011). Breast tumor classification using fuzzy clustering for breast elastography. Ultrasound in Medicine & Biology, 37(5): 700-708. https://doi.org/10.1016/j.ultrasmedbio.2011.02.003
[37] Cai, W., Chen, S., Zhang, D. (2007). Fast and robust fuzzy c-means clustering algorithms incorporating local information for image segmentation. Pattern Recognition, 40(3): 825-838. https://doi.org/10.1016/j.patcog.2006.07.011
[38] He, Y., Hussaini, M.Y., Ma, J., Shafei, B., Steidl, G., (2012). A new fuzzy c-means method with total variation regularization for segmentation of images with noisy and incomplete data. Pattern Recognition, 45: 3463-3471. https://doi.org/10.1016/j.patcog.2012.03.009
[39] You, Y.L., Kaveh, M. (2000) Fourth-order partial differential equations for noise removal. IEEE Transactions on Image Processing, 9(10): 1723-1730. https://doi.org/10.1109/83.869184
[40] Srivastava, S., Srivastava., R., Sharma, N., Singh, S.K., Sharma, S. (2012). A non-linear complex diffusion based filter adapted to Rayleigh’s speckle noise for de-speckling ultrasound images. International Journal of Biomedical Engineering and Technology, 10(2): 101-117. https://doi.org/10.1504/IJBET.2012.049362
[41] Cordero-Grande, L., Christiaens, D., Hutter, J., Price, A. N., Hajnal, J.V. (2019). Complex diffusion-weighted image estimation via matrix recovery under general noise models. NeuroImage, 200: 391-404. https://doi.org/10.1016/j.neuroimage.2019.06.039
[42] Kaur, K., Tiwari, S. (2019). Low-dose CT image reconstruction using complex diffusion regularization. In Computational Intelligence: Theories, Applications and Future Directions-Volume II, 799: 657-668. https://doi.org/10.1007/978-981-13-1135-2_50
[43] Barbu, T. (2018). A survey on nonlinear second-order diffusion-based techniques for additive denoising. In International Workshop Soft Computing Applications, 1221: 177-185. https://doi.org/10.1007/978-3-030-51992-6_15
[44] Zhang, Y., Lin, H., Li, Y. (2020). Random noise attenuation for desert seismic data using the complex diffusion coupled with deep learning. In 82nd EAGE Annual Conference & Exhibition, Netherlands, pp. 1-5. https://doi.org/10.3997/2214-4609.202011198
[45] Rodtook, A., Kirimasthong, K., Lohitvisate, W., Makhanov, S.S. (2018). Automatic initialization of active contours and level set method in ultrasound images of breast abnormalities. Pattern Recognition, 79: 172-182. https://doi.org/10.1016/j.patcog.2018.01.032