Limin Liu
© 2020 IIETA. This article is published by IIETA and is licensed under the CC BY 4.0 license (http://creativecommons.org/licenses/by/4.0/).
OPEN ACCESS
Artificial Intelligence (AI) frees humans from the heavy calculation burden in science and engineering. The AI can analyze the mass data on classroom behavior and the backend data of intelligent teaching platforms, and extract the useful features of student behaviors in class. Based on feature fusion, this paper develops a novel method to analyze class participation, which correlates class participation with classroom behaviors. Firstly, the basic data for the class participation analysis were processed, including the participation records of online classroom teaching and the data of classroom video, and the relevant calculation formulas were constructed. After that, the features of classroom behaviors were processed, and a training network for classroom behaviors was created. Next, the correlations between classroom behaviors and class participation were analyzed, and the similarity of facial features were evaluated, followed by the fusion of classroom behavior features. Experimental results show that our method can effectively and accurately evaluate class participation.
Artificial Intelligence (AI), class participation, feature extraction, feature fusion, deep convolutional neural network (D-CNN)
The development of computer science has deeply informatized our society. Information systems have penetrated many industries, greatly facilitating our work and life [1-4]. In the field of education, computer science has given rise to various intelligent teaching systems, such as the comprehensive online teaching platform with smart terminal apps. The big data from intelligent teaching platforms make it possible to analyze such classroom behaviors as attendance and interaction. The analysis results help to improve the quality and efficiency of classroom management [5-7].
Artificial Intelligence (AI) enables computers to mimic the problem-solving process of human brain, freeing humans from the heavy calculation burden in science and engineering. Currently, the AI is being applied in various scenarios, including smart home appliances, virtual reality retailing, smart transport, smart medical service, and smart logistics [8-12]. Klette and Blikstad-Balas [13] pointed out that, compared with other intelligent products and services, intelligent robots like the Pepper humanoid robot and the Xiaomi floor mopping robot have a broad development prospect. Zaletelj and Košir [14] estimated that industrial robots will replace 10%-30% of jobs in the next 5-10 years. Vellukunnel et al. [15] suggested that the structure and smartness of many industries will be revolutionized by machine vision-based multi-channel human-computer interaction systems, intelligent security systems, and autonomous driving assistance systems.
The AI has also been applied successfully in education. The AI can analyze the mass data on classroom behavior and the backend data of intelligent teaching platforms, and extract the useful features of student behaviors in class, providing a good reference for teachers and schools [16-18]. However, the AI has not been widely applied to analyze classroom behavior. Most studies are focused on how to effectively recognize feature contours of students in images and videos and use them to identify student behaviors [19]. Marsh et al. [20] combined long short-term memory (LSTM) and convolutional neural network (CNN) into a student behavior recognition method, which can derive the state map of real-time dynamic behaviors from the contours of classroom behavior. Based on deep learning (DL), Mühlberger et al. [21] combined two two-dimensional (2D) CNNs into a real-time processing network for student behaviors: one CNN receives the learning space information of the input image, and the other receives the learning time information; the outputs of the two CNNs are fused by support vector machine (SVM). Fonte et al. [2] integrated static images of student behaviors with optical flow data, classified the input signals by resolution, fused the two kinds of feature signals, and recognized the fused signals in a CNN.
This paper aims to take advantage of the AI to link up classroom behavior and their class participation, and make accurate evaluation of their class participation. For this purpose, a novel method was established to analyze class participation based on feature fusion.
Firstly, the basic data for the class participation analysis were processed, including the participation records of online classroom teaching and the data of classroom video, and the relevant calculation formulas were constructed.
Secondly, the features of classroom behavior were processed, and a training network for classroom behavior was built based on a deep CNN (D-CNN).
Thirdly, the correlations between classroom behavior and class participation were analyzed, the similarity of facial features were evaluated, and then the features of classroom behavior were fused; the relevant fusion formula and loss function were provided.
Finally, the proposed method was proved effective and accurate in class participation analysis.
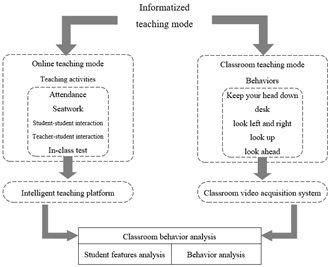
To accurately evaluate class participation, it is necessary to identify the correlations between classroom behaviors and class participation, and rationalize the processing mode and flow of classroom behavior data. As shown in Figure 1, this paper creates a database for class participation analysis based on the big data from intelligent teaching platform and the information of classroom teaching video.
Figure 1. Strategy of class participation analysis
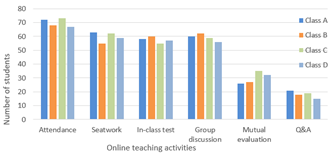
Figure 2. Historical data on student participation in online teaching activities
Figure 2 shows the distribution of historical data on student participation in online teaching activities. The data were recorded by the intelligent teaching. It can be seen that the historical data covers the following aspects: attendance, seatwork, in-class test, student-student interaction (i.e. group discussion and mutual evaluation), and teacher-student interaction (i.e. Q&A). A student with rich historical data must have a high class participation.
According to the classroom teaching video, the student behaviors can be divided by class participation: the low class participation behaviors include lowering head continuously, bending over desk, and looking around; the high class participation behaviors include raising head, and looking forward. The class participation of students can be calculated by:
$P=\sum\limits_{k=0}^{n}{{{\lambda }_{k}}(\sum\limits_{i=1,j=1}^{N,T}{{{H}_{A-k-ij}}})}-\sum\limits_{l=0}^{m}{{{\mu }_{l}}(\sum\limits_{i=1,j=1}^{N,T}{{{H}_{B-l-ij}}})}$ (1)
where, N is the number of students in the classroom; T is the duration of the teaching video; A={A1, A2, …An} and B={B1, B2, …Bm} are the set of high class participation behaviors and the set of low class participation behaviors recorded during T in the intelligent teaching platform and classroom video, respectively; λ1, λ2, …λn and μ1, μ2, …μm are the correlations between a specific behavior in A and B with class participation, respectively; HA-k-ij ∈{0, 1} reflects whether student i commits behavior k in A at the j-th minute; HB-l-ij ∈{0, 1} reflects whether student i commits behavior l in B at the j-th minute.
The participation records of online classroom teaching and the data of classroom video are both massive in size. Therefore, the big data from the intelligent teaching platform were preprocessed through data cleaning (i.e. removing redundant, abnormal, and irrelevant items, and supplementing missing items), data fusion (i.e. recognizing student identity and solving redundant attributes), and feature update (i.e. selecting the preliminary features). To recognize student behaviors in video images by neural network, the evaluation indices of class participation should be specific, and the image processing should be simplified, without sacrificing the details of image features. To this end, the images were captured from the classroom teaching video at an interval of 5s. The captured single-frame images were processed. However, the quality of the captured images was poor, making it difficult to extract the feature points of student behaviors. To solve the problem, the original images were subject to cropping, grayscale adjustment, enhancement, and filtering.
To minimize the significant feature differences between students and speed up the convergence of our neural network, the pixels in the preprocessed images were normalized and converted to standardized z-score:
$a^{\prime}=\frac{a-\operatorname{Min}}{\operatorname{Max}-\operatorname{Min}}$ (2)
$a^{\prime}=\frac{a-\varepsilon}{\sigma}$ (3)
where, Min=0; Max=1; ε and σ are the weighted average and mean squared error (MSE) of the pixel value a of a pixel and the pixel values of its neighbors, respectively.
To identify and classify classroom behaviors, it is necessary to define the postures of behaviors like lowering head, bending over desk, looking around, looking forward, etc. This paper estimates whether a student behavior belongs to A or B based on head deflection, for each head posture corresponds to a kind of salient facial feature.
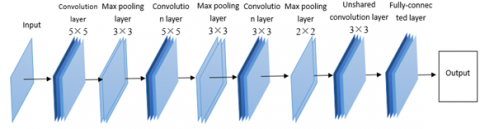
As shown in Figure 3, a training network was set up to recognize classroom behaviors based on the D-CNN. The established network consists of 3 convolution layers and 3 max pooling layers. Each convolution layer has its own kernel. Let Ch be the h-th convolution layer. Then, Ch will convert the inputted head image into the following feature map:
$CL_{r,s,t}^{h}=\left| \tanh (\sum\limits_{a=0}^{{{u}_{h-1}}}{\sum\limits_{b=0}^{{{v}_{h-1}}}{\sum\limits_{c=0}^{{{w}_{h-1}}}{C_{r-a,s-b,c}^{h-1}\bullet \alpha _{a,b,t,c}^{h}+{{\beta }_{t}}}}} \right|$ (4)
The output max pooling layer after Ch will further process the feature map into:
$C L_{r, s, t}^{h}=\left|\tanh \left(\sum_{a=0}^{u_{k-1}} \sum_{b=0}^{v_{n-1-1}} \sum_{c=0}^{w_{k-1}} C_{r-a, s-b, c}^{h-1} \bullet \alpha_{a, b t, c}^{h}+\beta_{t} \mid\right.\right.$ (5)
After three layers of convolution and max pooling, the output was weighted in the unshared convolution layer. The weighted result was inputted as salient facial features into the fully-connected layer for regression.
Figure 3. The proposed D-CNN
4.1 Correlation analysis between classroom behaviors and class participation
The linearly separable SVM (LS-SVM) was combined with the D-CNN to divide the class participation of students to different levels, that is, to identify the correlation between each student behavior and its class participation. The images on classroom behaviors in A and B were collected, and the training image set was constructed as: T={(C1, d1), (C2, d2), …(Cn, dn),(Cn+1, dn+1), …(Cn+m, dn+m)}, whereÎdk{-1, 1}, k=1, 2, 3, …n+m.
First, the LS-SVM constrained optimization problem was constructed and solved:
$\left\{ \begin{matrix} \underset{\delta }{\mathop{\max }}\,\sum\limits_{k=1}^{n+m}{{{\delta }_{i}}}-\frac{1}{2}\sum\limits_{k=1}^{n+m}{\sum\limits_{l=1}^{n+m}{{{\alpha }_{k}}}}{{\alpha }_{l}}{{d}_{i}}{{d}_{j}}C_{i}^{T}{{C}_{j}} \\ s.t.\text{ }\sum\limits_{k=1}^{n+m}{{{\alpha }_{k}}{{d}_{k}}}=0,{{\alpha }_{k}}\ge 0 \\\end{matrix} \right.$ (6)
The optimal solution was obtained as α*=(α*1, α*2, …α*n+m)T. Then, the following items were solved:
$\omega^{*}=\sum_{k=1}^{n+m} \alpha_{k}^{*} d_{k} C_{k}$ (7)
$b^{*}=d_{l}-\sum_{k=1}^{n+m} \alpha_{k}^{*} d_{k}\left(C_{k}^{T} C_{l}\right)$ (8)
$\omega^{* T} C+b^{*}=0$ (9)
In order to integrate all the salient facial features obtained by LS-SVM, a classifier was constructed with the level of class participation as the label, and a D-CNN subspace was created with hyperparameter o as the total number.
For n+m classroom behaviors, the salient facial features of each behavior were expressed as Fk(k=1, 2, …, n+m). The corresponding mapping matrix was defined as M=[M1, M2, …, Mo]ÎDNNo×(n+m) and randomly initialized.
The central variables S=[S1, S2, …, So]ÎDNNo×(n+m) were defined, and all salient facial features were mapped to each subspace. The adaptive weights were calculated based on the distance between features and the central variables. The weights correspond to λ1, λ2, …λn and μ1, μ2, …μm.
The weight ρkq corresponding to the k-th salient facial feature in the q-th subspace can be calculated by:
$\rho_{k q}=e^{-\frac{1}{n+m}\left\|F_{k} M_{q}-S_{q}\right\|_{2}^{2}}$ (10)
The feature FFq of the q-th subspace can be obtained by adding up the weights of the features in that subspace:
$F F_{q}=\sum_{i=1}^{n+m} \rho_{k, q}\left(F_{k} M_{q}\right)$ (11)
Then, the features of the o subspaces can be fused by:
$F F=\operatorname{Relevance}\left(F F_{1}, F F_{2}, \ldots \ldots, F F_{o}\right)$ (12)
Then, the salient facial features Fk(k=1, 2, …, n+m) were imported to Softmax function for logistic regression. Let SFk(k=1, 2, …, n+m) be the output, and SM=[SM1, SM2, …, SMo]∈DNN1×(n+m) be the central variable. Then, the weight corresponding to the k-th result can be obtained by:
$\sigma_{k}=e^{-\frac{1}{n+m}\left\|F_{k}-S M_{q}\right\|_{2}^{2}}$ (13)
The relevance decision after fusion can be expressed as:
$S F F=\sum_{k=1}^{n+m} \sigma_{k} S F_{k}$ (14)
4.2 Similarity analysis of facial features
Once the saliency facial features are extracted, it is necessary to determine classroom behaviors. Here, the cosine distance is selected to measure the similarity between the salient facial features and the behaviors of the template image. The weight of the decision based on the fused salient facial features can be obtained from formula (13). The greater the weight, the higher the similarity between features.
The cosine distance between the max pooling results {PL1, PL2, …., PLn+m} and {PL¢1, PL¢2, …., PL¢n+m} of two images of salient facial features, can be calculated by:
Similarity $_{k}=\frac{P L_{k} \bullet P L_{k}^{\prime}}{\left|P L_{k}\right|\left|P L_{k}^{\prime}\right|}$ (15)
The corresponding weight coefficients can be calculated by:
$\left\{ \begin{matrix} {{\eta }_{k}}={{e}^{-\frac{1}{n+m}\left\| P{{L}_{k}} \right.-\left. S{{M}_{q}} \right\|_{2}^{2}}} \\ {{{{\eta }'}}_{k}}={{e}^{-\frac{1}{n+m}\left\| P{{{{L}'}}_{k}} \right.-\left. S{{M}_{q}} \right\|_{2}^{2}}} \\\end{matrix} \right.$ (16)
The similarity of facial features after fusion can be expressed as:
$\text{Similarity}=\sum\limits_{k=1}^{n+m}{{{\eta }_{k}}{{{{\eta }'}}_{k}}\text{Similarit}{{\text{y}}_{k}}}$ (17)
4.3 Feature fusion of classroom behaviors
To correctly evaluate class participation, the features FAvtion of classroom behaviors in classroom teaching video should be fused with the features FOnline of classroom behaviors in the participation records of online teaching activities:
${{F}_{\text{total}}}={{\upsilon }_{\text{Action}}}{{F}_{\text{Action}}}+{{\upsilon }_{\text{Online}}}{{F}_{\text{Online}}}\text{ }$ (18)
where, υAvtion and υOnline are the weight coefficients of FAvtion and FOnline, respectively. By weighted fusion algorithm, the eigenvectors of the two kinds of classroom behaviors were imported to the Softmax classifier. The final loss function can be expressed as:
$Loss=mean\left[ \begin{align} & Loss(FF) \\ & +Loss(SFF)+Loss({{F}_{\text{total}}}) \\\end{align} \right]$ (19)
where, Loss(FF), Loss(SFF), and Loss(Ftotal) are the loss functions of spatial feature fusion, relevance decision fusion, and classroom behavior feature fusion, respectively.
To make the class participation analysis more realistic, this paper decides to further confirm the υAvtion and υOnline. After initializing υAvtion and υOnline, the classroom behaviors were classified and trained on the training set based on images from classroom teaching video, and the training set based on the participation records of online teaching activities. The classified results were compared with the actual behaviors. The classification error τ can be computed by:
$\tau=\frac{1}{2}\|Y-R\|^{2}$ (20)
where, Y is a classification result of classroom behaviors; R is the actual class of classroom behaviors. During the error calculation, error backpropagation took place according to the relationship between υAvtion and υOnline, and the weight coefficients υAvtion and υOnline were corrected until the error converged.
The workflow of the class participation analysis is summed up in Figure 4 below.
Figure 4. Workflow of class participation analysis
Table 1 lists the relevance decision values outputted by the D-CNN, during the analysis on the correlation between behavior features and class participation. It can be seen that the behaviors in A corresponded to relatively high relevance decision values, indicating that the students committing these behaviors have a high class participation. The exactly opposite result was obtained for the behaviors in B. This confirms that our correlation analysis is scientific and effective.
As shown in Table 2, the number of subspaces set up in correlation analysis has a certain impact on the classification of student behaviors. With the growing number of subspaces, the recognition accuracy first increased and then decreased. To simplify the computation, it is decided to build up 10 subspaces for correlation analysis.
Figure 5 compares the convergence and accuracy of our model with three methods, namely, HOG, LBP, and ResNet-50. Besides, the accuracy of each method in predicting student behaviors was evaluated by mean absolute error (MAE), mean relative error (MRE) and MSE (as shown in Table 3). It can be seen that our model classified student behaviors more accurately than HOG, LBP and Res-Net50, thanks to the integration between LS-SVM and D-CNN. Meanwhile, our model achieved the fastest convergence among all contrastive methods, which indirectly proves that multi-feature fusion can improve the performance of the D-CNN.
Table 1. Correlation between student behaviors and levels of class participation
|
Level of class participation |
Lowering head continuously |
Raising head |
Bending over desk |
Looking forward |
Looking around |
|
1 |
0.54 |
0.29 |
0.13 |
0.63 |
0.09 |
|
2 |
0.32 |
0.11 |
0.11 |
0.55 |
0.17 |
|
3 |
0.11 |
0.25 |
0.10 |
0.68 |
0.11 |
|
4 |
0.07 |
0.39 |
0.08 |
0.55 |
0.08 |
|
5 |
0.01 |
0.55 |
0.01 |
0.58 |
0.09 |
Table 2. Recognition accuracies of student behaviors at different number of subspaces
|
Number of subspaces |
Recognition accuracy |
|||
|
HOG |
LBP |
ResNet-50 |
Our model |
|
|
5 |
0.784 |
0.884 |
0.893 |
0.903 |
|
10 |
0.798 |
0.898 |
0.901 |
0.919 |
|
20 |
0.797 |
0.885 |
0.902 |
0.913 |
|
30 |
0.796 |
0.889 |
0.906 |
0.903 |
|
40 |
0.788 |
0.880 |
0.882 |
0.917 |
|
50 |
0.785 |
0.872 |
0.884 |
0.924 |
Note: HOG is short for histograms of oriented gradients (HOG); LBP is short for local binary pattern
Figure 5. Convergence and accuracy of different methods
Table 3. Prediction accuracy of different methods
|
Name |
Evaluation metric for test set |
||
|
MAE |
MRE |
MSE |
|
|
HOG |
0.206 |
5.962 |
0.505 |
|
LBP |
0.125 |
5.376 |
0.423 |
|
ResNet-50 |
0.156 |
2.355 |
0.225 |
|
Our model |
0.085 |
1.798 |
0.135 |
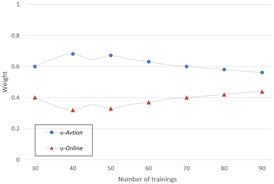
Figure 6. Weights in feature fusion of classroom behaviors
Figure 7. Levels of class participation for some students
As mentioned above, proper weights should be assigned to the classroom behavior features from classroom teaching video and those from participation records of online teaching during feature fusion. As shown in Figure 6, with the growing number of trainings, the weights for feature fusion continued to be updated and reset, making the model more adaptive. Figure 7 provides the levels of class participation of some students.
This paper mainly proposes a novel method to analyze class participation based on feature fusion. Firstly, the basic data for the class participation analysis were processed, including the participation records of online classroom teaching and the data of classroom video. The relevant calculation formulas were also constructed. Then, the features of classroom behaviors were processed, and used to build up a training network of classroom behaviors.
To verify its effectiveness, our model was compared with HOG, LBP, and ResNet-50 through experiments. It was learned that our model converged faster and recognized student behaviors more accurately than these methods.
In addition, the correlation between classroom behaviors and class participation was discussed. The effectiveness of our correlation analysis was confirmed by the relevance decision values outputted by the D-CNN for some classroom behaviors.
Finally, the authors fused the features of classroom behaviors. Experimental results on weight setting and levels of class participation reveal that our method is feasible and accurate in evaluating class participation of students.
This paper was supported by Soft science and technology plan of Henan science and Technology Department (Grant No.: 182400410337) under the title of “Research on the occupational pressure and Countermeasures of young teachers in Higher Vocational Colleges in Henan Province”.
[1] Bhattacharjee, A., Das, S. (2019). ICFD: Indian Classroom Face Dataset. Indian Institute of Technology Madras, India.
[2] Miralles, A., Huchard, M., Carbonnel, J., Nebut, C. (2018). Union and intersection of models for information systems analysis. Ingénierie des Systèmes d’Information, 23(1): 35-62. https://doi.org/10.3166/ISI.23.1.35-62
[3] Jovanovic, J., Mirriahi, N., Gašević, D., Dawson, S., Pardo, A. (2019). Predictive power of regularity of pre-class activities in a flipped classroom. Computers & Education, 134: 156-168. https://doi.org/10.1016/j.compedu.2019.02.011
[4] Jovanović, J., Gašević, D., Dawson, S., Pardo, A., Mirriahi, N. (2017). Learning analytics to unveil learning strategies in a flipped classroom. The Internet and Higher Education, 33(4): 74-85. https://doi.org/10.1016/j.iheduc.2017.02.001
[5] Song, Z. (2018). Research and implementation of classroom teaching behavior recognition system based on deep learning. Dissertation.
[6] Zaletelj, J., Košir, A. (2017). Predicting students’ attention in the classroom from Kinect facial and body features. EURASIP Journal on Image and Video Processing, 2017(1): 80.
[7] Ahmed, K. (2015). Google's Demis Hassabis–misuse of artificial intelligence'could do harm'. BBC News, 16.
[8] Rahaman, A., Islam, M.M., Islam, M.R., Sadi, M.S., Nooruddin, S. (2019). Developing IoT based smart health monitoring systems: A review. Revue d'Intelligence Artificielle, 33(6), 435-440. https://doi.org/10.18280/ria.330605
[9] Romanov, P.S. Romanova, I.P. (2017). Artificial intelligence Systems. Kolomna: GSGU; KI (f) MPU.
[10] Shenfield, A., Day, D., Ayesh, A. (2018). Intelligent intrusion detection systems using artificial neural networks. ICT Express, 4(2): 95-99. https://doi.org/10.1016/j.icte.2018.04.003
[11] Krithivasan, S., Gupta, S., Shandilya, S., Arya, K., Lala, K. (2016). Auto-Tagging for Massive Online Selection Tests: Machine Learning to the Rescue. In 2016 IEEE Eighth International Conference on Technology for Education (T4E), pp. 204-207. https://doi.org/10.1109/T4E.2016.050
[12] Neguț, A., Jurma, A.M., David, D. (2017). Virtual-reality-based attention assessment of ADHD: ClinicaVR: Classroom-CPT versus a traditional continuous performance test. Child Neuropsychology, 23(6): 692-712. https://doi.org/10.1080/09297049.2016.1186617
[13] Klette, K., Blikstad-Balas, M. (2018). Observation manuals as lenses to classroom teaching: Pitfalls and possibilities. European Educational Research Journal, 17(1): 129-146. https://doi.org/10.1177/1474904117703228
[14] Zaletelj, J., Košir, A. (2017). Predicting students’ attention in the classroom from Kinect facial and body features. EURASIP Journal on Image and Video Processing, 2017(1): 80. https://doi.org/10.1186/s13640-017-0228-8
[15] Vellukunnel, M., Buffum, P., Boyer, K.E., Forbes, J., Heckman, S., Mayer-Patel, K. (2017). Deconstructing the discussion forum: Student questions and computer science learning. In Proceedings of the 2017 ACM SIGCSE Technical Symposium on Computer Science Education, pp. 603-608. https://doi.org/10.1145/3017680.3017745
[16] Müller, A.C., Guido, S. (2016). Introduction to machine learning with Python: A guide for data scientists. "O'Reilly Media, Inc.".
[17] Li, W., Jiang, F., Shen, R. (2019). Sleep gesture detection in classroom monitor system. In ICASSP 2019-2019 IEEE International Conference on Acoustics, Speech and Signal Processing (ICASSP), pp. 7640-7644. https://doi.org/10.1109/ICASSP.2019.8683116
[18] Lin, J., Jiang, F., Shen, R. (2018). Hand-raising gesture detection in real classroom. In 2018 IEEE International Conference on Acoustics, Speech and Signal Processing (ICASSP), pp. 6453-6457. https://doi.org/10.1109/ICASSP.2018.8461733
[19] Pei, J.Y., Shan, P. (2019). A micro-expression recognition algorithm for students in classroom learning based on convolutional neural network. Traitement du Signal, 36(6): 557-563. https://doi.org/10.18280/ts.360611
[20] Marsh, J.A., Farrell, C.C., Bertrand, M. (2016). Trickle-down accountability: How middle school teachers engage students in data use. Educational Policy, 30(2): 243-280. https://doi.org/10.1177/0895904814531653
[21] Mühlberger, A., Jekel, K., Probst, T., Schecklmann, M., Conzelmann, A., Andreatta, M., Romanos, M. (2020). The influence of methylphenidate on hyperactivity and attention deficits in children with ADHD: A virtual classroom test. Journal of Attention Disorders, 24(2): 277-289. https://doi.org/10.1177/1087054716647480