Sihem Achouri* | Bachir Redjel | Mounira Bourebia
© 2022 IIETA. This article is published by IIETA and is licensed under the CC BY 4.0 license (http://creativecommons.org/licenses/by/4.0/).
OPEN ACCESS
The stresses at break of fragile materials like acrylic resin and composite material for orthopedic use measured in bending are higher than those measured in direct traction. Tests on a composite material for orthopedic use laminated with 6 glass-perlon-acrylic layers (PV-2P-VP) for orthopedic use made it possible to identify its mechanical characteristics and to highlight the influence of the direction of cutting of the samples. The mechanical properties of this material indicate dispersion in the direction of the orientation of the molding which shows values of stress at break and of the Young's modulus which are reduced compared to the values measured in the perpendicular direction. The choice motivates the statistical approach which leads us to apply the Weibull model to assess the dangerousness of a stress in terms of probability of failure. The theoretical predictions are in good agreement with the experimental values. The morphological study of the fracture facies makes it possible to draw up an inventory of the various mechanisms at the origin of the damage and the rupture of these materials and thus to locate the most dominant.
composite, Weibull, probability, fracture, damage
The production of composite materials is increasing by more than more than 6% per year in quantity and is developing rapidly worldwide. Although their cost is higher than that of traditional materials, they bring significant advantages compared to competing products: lightness, mechanical and chemical resistance, reduced maintenance, freedom of forms allow to increase the lifespan of certain equipment thanks to their mechanical properties (rigidity, resistance to fatigue), but also thanks to their chemical properties (resistance to corrosion) [1, 2]. The initial defects can be of different natures and are often the result of imperfections due to manufacturing vagaries. The initiation of failure in composite materials generally occurs long before a change in macroscopic behavior is observed [3]. It is clear that the rheological and mechanical properties of composite materials being strongly linked to the properties of the interface, a poor state of the latter will have harmful consequences on their performance [4].
All materials used in the manufacture of orthopedic prosthesis devices must be of first choice and must not exhibit any defect and undergo no treatment capable of concealing the defects [5]. Composite materials based on acrylic resin reinforced with glass fibers are the reinforced plastics most used in the manufacturing industry of orthopedic devices for the disabled. Depending on the formulation and the requirements for use, they can be in the form of light, transparent, translucent or opaque, colored or colorless products without limitation as to the dimensions of the object to be manufactured [6]. Most of the implementation methods for the manufacture of these specific products consist in developing parts in composite materials meeting all the requirements of shape and rate by successive layers comprising a matrix and reinforcements to have a laminated composite material [7]. The induced rupture mechanisms then depend on the nature of the constituents, the architecture of the layers and the mode of mechanical stress imposed [8].
The fragile nature specific to polymers based on acrylic resin induces an absence of plastic deformation and a high sensitivity to defects, which makes it very difficult to accurately and faithfully determine their stresses at break [9, 10]. Characterization studies generally focus on an assessment of mean characteristics and do not provide any information on the statistical character of the values. A better knowledge of the statistics of the mechanical properties of fragile polymers is therefore necessary for their application, especially since they are often subject to an effect of size and volume. This can be demonstrated by an analysis based on a statistical approach by Weibull [11-13]. This work presents an application of the Weibull probabilistic model to the analysis of the behavior in direct traction and in bending of a fragile material used in the manufacture of orthopedic prostheses. A morphological analysis of the test pieces tested is investigated by macroscopic observations which show that transverse cracking is the most dominant mechanism.
The Weibull model is a probabilistic model of failure behavior obeying the weakest link theory "Weakest Link Theory W.L.K". This model is based on the fact that the resistance of a chain is governed by that of its weakest link. It is the same for a set of chains. Applying this model to a fragile material makes each link correspond to a volume element, the weakest links corresponding to the volume elements containing the most critical defects.
Let $\left(\Delta P_{f}\right)_{i}$ be the probability of failure of an element i of a structure. His probability of survival.
${{\left( {{P}_{s}} \right)}_{i}}=1-{{\left( \Delta P{}_{f} \right)}_{i}}$ (1)
The probability of failure Ps of the structure is the product of the probability of survival of each element:
${{P}_{s}}={{\pi }_{i}}{{\left( {{P}_{s}} \right)}_{i}}={{\pi }_{i}}\left\{ 1-{{\left( {{P}_{f}} \right)}_{i}} \right\}$ (2)
with $\left(\Delta P_{f}\right)_{i}$ small, we can write:
${{P}_{s}}=\pi \exp \left[ -{{\left( \Delta {{P}_{f}} \right)}_{i}} \right]=\exp \left[ -\sum{{{\left( \Delta {{P}_{f}} \right)}_{i}}} \right]=\exp \left( -B \right)$ (3)
B is defined as "the risk of rupture". To evaluate B, Weibull added the probabilities of failure of all the elements of volume $\Delta V$ in the structure. The probability of failure is given by:
${{\left( \Delta {{P}_{f}} \right)}_{i}}=\varphi \left( \sigma \right)\Delta {{V}_{i}}$ (4)
φ(σ) Represents the probability that a resistance defect of less than σ exists per unit volume.
$B={{\sum{\left( \Delta P{}_{f} \right)}}_{i}}=\sum{\left[ \varphi \left( \sigma \right).\Delta {{V}_{i}} \right]}=\int\limits_{V}{\varphi \left( \sigma \right)}dV$ (5)
The probability of rupture of the whole body then becomes:
${{P}_{f}}=1-{{P}_{s}}=1-\exp \left( -B \right)=1-\exp \left[ -\int\limits_{V}{\varphi \left( \sigma \right)}dV \right]$ (6)
In the case of simple traction which is the case considered by Weibull. The Function φ(σ) which expresses the resistance properties of the material is given by:
$\varphi \left( \sigma \right)={{\left( \frac{\sigma -{{\sigma }_{u}}}{{{\sigma }_{0}}} \right)}^{m}}$ (7)
σ and σu are respectively the applied stress and a threshold stress below which the probability of failure is zero. We often consider σu=0.
The exponent m represents the modulus of Weibull, which it's an inhomogeneity parameter which characterizes the extent of the breaking stress distribution and the influence of the size.
σ0 is a normalization constraint that represents a rupture probability with a value of 0.632 for a unit volume [1].
The settings σ0 and m are considered properties of the material. Thus the risk of failure only depends on the stress distribution in the test specimen.
For a volume Vt subjected to uniform tension σt, the Eq. (6) is written:
${{P}_{f}}\left( {{\sigma }_{t}} \right)=1-\exp \left[ -{{V}_{t}}{{\left( {}^{{{\sigma }_{t}}}/{}_{{{\sigma }_{0}}} \right)}^{m}} \right]$ (8)
which can also be written:
${{P}_{f}}\left( {{\sigma }_{t}} \right)=1-\exp \left[ -{{\left( {}^{{{\sigma }_{t}}}/{}_{{{{\bar{\sigma }}}_{t}}} \right)}^{m}} \right]$ (9)
$\bar{\sigma}_{t}$ represents the normalization stress in tension:
${{\bar{\sigma }}_{t}}={}^{{{\sigma }_{0}}}/{}_{\left( {{V}_{t}} \right)}\tfrac{1}{m}$ (10)
In the case of 3-point bending; Sbiai et al. [4] by integrating Eq. (5), allowed to write:
${{P}_{f}}\left( {{\sigma }_{b}} \right)=1-\exp \left[ -{{\left( {}^{{{\sigma }_{b}}}/{}_{{{{\bar{\sigma }}}_{b}}} \right)}^{m}} \right]$ (11)
$\bar{\sigma}_{t}$ represents the normalisation stress in bending:
${{\bar{\sigma }}_{f}}={{\sigma }_{0}}{{\left[ {}^{2{{\left( m+1 \right)}^{2}}}/{}_{{{V}_{b}}} \right]}^{{\scriptstyle{}^{1}/{}_{m}}}}$ (12)
Thus the 3-point bending test results in a two-parameter Weibull distribution with the same factor m as for the tensile test but a different normalization factor. For equal probabilities of rupture, we can then write:
$\left( {}^{{{\sigma }_{f}}}/{}_{{{\sigma }_{t}}} \right)={{\left[ 2{{\left( m+1 \right)}^{2}}\left( {}^{{{V}_{t}}}/{}_{{{V}_{b}}} \right) \right]}^{{\scriptstyle{}^{1}/{}_{m}}}}$ (13)
The different constraints σi-are listed in ascending order of σ1 to σN-and assigned a probability Pf function of rank i. The analytical calculation of Pf is done from one of the expressions of ‘Median Rank M.R’:
${{P}_{f}}=MR1=\frac{i}{N+1}$ (14)
${{P}_{f}}=MR2={}^{\left( i-0.3 \right)}/{}_{\left( N+0.4 \right)}$ (15)
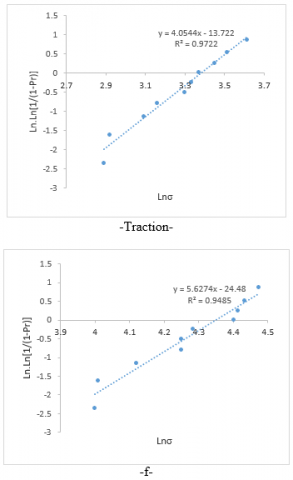
Expression (14) is the most used. The graphic representation of $\operatorname{Ln} . \operatorname{Ln}\left[\frac{1}{\left(1-P_{f}\right)}\right]$-as a function of the logarithm of the applied stress is a line of slope m.
3.1 Material used
3.1.1 Resin used
The studied polymer is an acrylic resin supplied in liquid form in 4.9 kg cans, density at 20℃ of 1 g / cm³, ignition temperature of 430℃.
3.1.2 Hardener
The hardener used is a white powder of benzoyl peroxide ref SYD101. This powder is used with 3% by weight of the resin.
3.2 Manufacture of acrylic resin test pieces
All the acrylic resin test specimens described in this study were carried out at ONAAPH Annaba (Algeria). The specimens were cut with a special diamond saw from the molded plates averaging 3.5 mm thick.
The side surfaces are ground and polished using a special grinding machine. The manufacturing process suitable for this type of structures and components is vacuum molding
3.2.1 Manufacture of composite test pieces
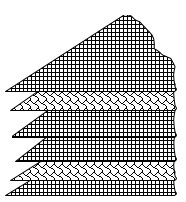
The wood-based mold (male) is fixed on a vice and covered with a PVA film. The latter will serve as an insulation to prevent the liquid resin from sticking to the wood. The reinforcements are then stacked in a chosen order. The reinforcements should be pulled and tightened in the direction of stacking. The specimens are made of a laminated material composed of glass and perlon reinforcements as well as acrylic resin. The laminate of specimens with an average thickness of 3mm is limited to 06 plies, so the architecture retained is of the P-V-2P-V-P type (Figure 1).
Figure 1. P-V-2P-V-P stack architecture
The vacuum in the mold between the two bags is eliminated by means of an air vacuum. The resin mixture is prepared separately from the mold and then it is poured into the latter quickly. The additive elements are the hardener and the coloring paste. The resin curing period varies from 15 to 20 minutes. In this study the concepts of prostheses to be considered are those relating to the lower limbs because they must ensure the statics of the body and allow the locomotion of the disabled (Figure 2).
Demoulding time is approximately 30 minutes.
3.3 Machine and testing devices
The tensile test was carried out on a universal machine of the Zwick Roell Z020 type with a capacity of 20KN, connected to an automatic acquisition system assisted by a computer which allows obtaining the load-displacement curve during loading at using test-expert II software (Figure 3. "a and b").
Figure 2. Flowchart and diagram of the development of the material studied
3.4 Microscopic observations
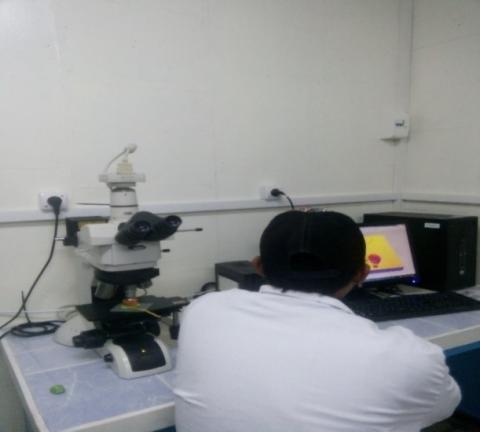
The microscope used is of the "NIKON" type equipped with 5 objectives with magnifications 100, 200, 500, 1000 and 1500 times. The microstructures were acquired using a camera connected to a computer containing the NIS-elements D software (Figure 4).
Figure 3. Universal machine (“a” traction - “b” flexion)
Figure 4. NIKON optical microscope
4.1 Examples of load-displacement and stress-strain curves
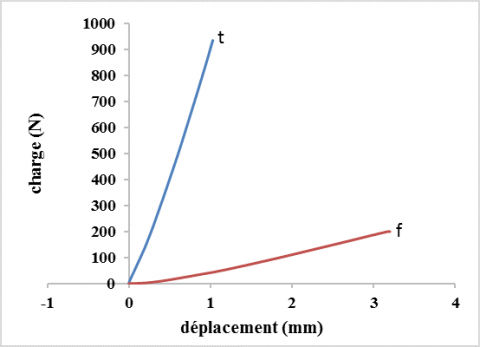
Figure 5 shows an example of load-displacement curves in direct traction and in 3-point bending of acrylic resin. These curves are linear until they break, reflecting the fragile elastic nature of this polymer in these two types of stress.
Figure 5. Example of average load-displacement curves
The results of measurement of the stress at break as well as the average values and the coefficients of variation for each stress are collated in Table 1.
Table 1. Measured values of the stress at break [MPa]
|
|
Bending test |
Tensile test |
|
Constraint (MPa) |
27 (08%) |
69 (12%) |
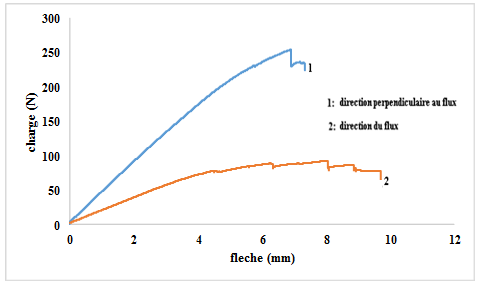
Figure 6 shows the evolution of the load - deflection curves in the direction of molding. The same type of behavior is observed in the perpendicular direction.
Figure 6. Example of load - deflection curve reading.
The evolution of the stress-strain curve for the P-V-2P-V-P architecture in both molding flow directions is illustrated in Figure 7.
Figure 7. Variation the "σ" as a function of "ɛ" for P-V-2P-V-P architecture
These curves present the same appearance in general and are initially linear materializing the elastic response of these materials then deviate from the linearity reflecting the damage which takes place and develops within the volume in the form of a tear of the composite before the fall. sudden and unstable load.
Table 2 collates the results of measurement of the mechanical characteristics. Numbers in parentheses indicate standard deviations. The mean flexural stress at break as well as the strain measured on the tensile face are greater than those measured in direct tension.
Table 2. Mechanical characteristics of the composite studied
|
|
Bending test |
Tensile test |
||
|
Direction |
Molding direction |
Perpendicular direction |
Molding direction |
Perpendicular direction |
|
Constraint (MPa) |
48 (17%) |
86 (15%) |
26 (8.5%) |
49 (9%) |
|
Young's modulus (MPa) |
2640 (15%) |
3687 (9%) |
1307 (6.5%) |
1738 (8.5%) |
The results of the two tests carried out show that in the direction perpendicular to the molding, the stresses values and elasticity moduli are increased compared to the values measured in molding direction. This can be interpreted by the fact that the mode of print run of glass fabric is slightly free in molding direction than in perpendicular direction, where the knots are very tight thus causing a stresses concentration. On the other hand, the presence of friction forces between the glass fibers in knots contribute to amplify the phenomenon.
4.2 Weibull probabilistic model application units and numbers
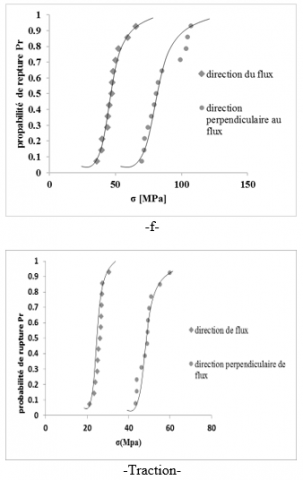
Figure 8. Curve indicating for each stress level the failures probability in the case of acrylic resin
The results of the stress at break are analyzed by Weibull's statistical theory. The analytical calculation of the probability of failure was performed from the expression (14) for "median rank". Figure 8 shows the variation in the probability of failure as a function of the tensile strength of the acrylic resin for the two stresses. Indeed, Figure 9 shows for each stress level of studied architecture the evolution of failure probability in both directions of molding flow, where all the curves are sigmoids representing Weibull distributions of breaking stresses.
Figure 9. Curve indicating for each level of constraint the failures probability in the case of studied architecture
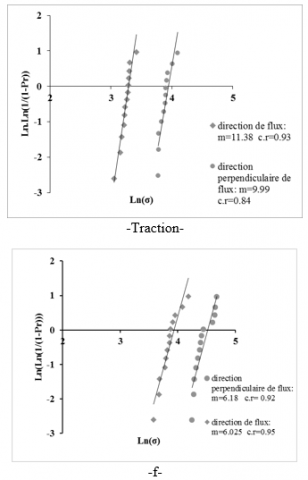
Statistical analysis of these results by Weibull theory leads to very similar Weibull modulus values in these two types of stress as shown in the Figure 10 and 11. The slight difference observed can be attributed to the experimental conditions.
The dispersion of the measurement results is therefore a characteristic of these polymers & composites which are above all subject to a size effect linked to the requested volume and to the stress distribution in this volume. Thus the probability of finding a critical defect in a bar loaded in tension is greater than that in a bending specimen of smaller volume. Because of these effects the stress measured in bending is greater than that measured in tension. Table 3 shows that the ratio σrf /σrt calculated from the Weibull model is almost identical to that measured by experiment.
Figure 10. Weibull diagram
It is interesting to note that many studies have attempted to correlate the Weibull modulus with the parameters for measuring dispersion observed on the rupture stresses and especially the variation coefficient.
Broutman and Krock [12] estimate that for a variation coefficient of 9% generally measured on the dispersion of rupture stresses of composite materials, the Weibull modulus is the order of 7.
Zweben and Rosen [13] inversely connects the Weibull modulus "m" and the variation coefficient "c" of tensile stresses of composites by the following relationship:
m = 1.2 / c (16)
The same relationship was suggested by Margetson and Brokenbrow [14] who reports that composite materials containing a moderate concentration of fibers show a significant variability of rupture stresses characterized by values of "m" between 12.9 and 16.6.
Margetson and Brokenbrow [14] propose the following relationship:
c = 1.27 / (m + 0.56) (17)
In addition, the measured experimental values of Weibull modulus "m" in both directions for the resin as well as the composite material and those calculated from the empirical relations (16) and (17) are recorded in Table 4.
The values of the Weibull modulus “m” calculated by the formulas (16) and (17) are clearly higher than the experimental values. Thus, this difference is due to the degree of dispersion observed on the measured values of the breaking stresses of the material studied. The sources of this dispersion are various, including defects on the surface layer of the sample as well as volume defects (shapes, sizes, orientations…….). These parameters are of little significance to give an adequate correlation.
Figure 11. Graphical representation of the linear probability equation for the P-V-2P-V-P architecture
Table 3. Report σrf /σrt theoretical and experimental
|
report |
Weibull |
experimental |
|
σrf / σrt |
2.83 |
2.72 |
|
Molding direction σrf / σrt |
2.20 |
1.85 |
|
Perpendicular direction σrf / σrt |
2.17 |
1.76 |
Table 4. Calculated and experimental Weibull modulus "m"
|
Composite P-V-2P-V-P |
Resine |
|||||
|
Laminate |
Traction |
Flexion |
Traction |
Flexion |
||
|
feel |
Molding |
Perpendicular |
Molding |
Perpendicular |
||
|
σ [MPa] |
26(8.5%) |
49(09%) |
48(17%) |
86(15%) |
27 (08%) |
69 (12%) |
|
m exp. |
7.43 |
6.99 |
6.18 |
6.03 |
4.05 |
5.63 |
|
m (Zweben) |
14.11 |
13.33 |
7.05 |
8 |
15 |
10 |
|
m(Margeston) |
14.38 |
13.55 |
6.91 |
7.9 |
15.32 |
10.02 |
4.3 Mechanisms of rupture and ruin
According to the microscopic examinations, the tear observed follows a plane perpendicular to applied load [15]. The extension of this tear is revealed by a modification in appearance and a discoloration of resin which tends towards a white color as shown in Figure 12.
Figure 12. 3D microscopic observations of resin fracture facies
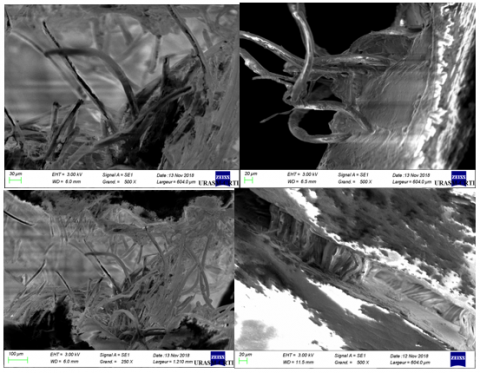
Figure 13. SEM observations of composite fracture facies
Microscopic observations have shown that the tear generally follows the path of the knots of the glass fabric along a plane perpendicular to the axis of load application in the tensile test. The propagation of the rupture is always accompanied by a change in appearance and a discoloration of the composite which turns towards the white color (Figure 13). This is probably the consequence of the first debonding and loosening due to the effect of the applied stress. Some specimens did not show breakage by separation; the two pieces remain attached but show no resistance to the load. The tear generally shows loosening of glass fibers and perlon. These take place without detachment of the matrix suggesting a fiber-matrix interface less resistant than the matrix itself. Other observations made it possible to locate the rupture in the inter-layering spaces as well as in the tissue at the level of the binding points. Interfacial decohesions as well as a brittle fracture of the matrix initiated at the porosities and voids are also observed. Finally, let us point out that the paths of the cracking remain very complex to locate and generally follow tortuous paths.
It should be noted that the deformation and damage mechanisms of woven structures are very complex to identify and analyze because of the complicated structure to model of weaving, binding points, … etc. An interesting study on the characterization of structures fabrics has provided information on tissue damage mechanisms [16].
The experimental part concerning the random aspect of rupture in tension and in bending of acrylic resin and composite glass-perlon-acrylic allowed to analyze the rupture by a statistical-probabilistic analysis based on the model of Weibull with two parameters.
The measured mechanical characteristics are characterized by a dispersion. This is mainly due to the presence of defects in the core of the sample. These defects are introduced in various ways during elaboration and during specimen’s preparation.
The two-parameter Weibull model seems to be well suited to the description of the brittle fracture behavior of these polymers in both tensile and bending stress.
Visual observations of failure facies generally show a failure that follows the axis of application of the load.
The material studied is characterized by brittle fracture and shows a tensile strength in flexion greater than that measured in direct traction. This difference is explained by the notion of size and volume effect resulting from a distribution of constraints obeying Weibull's probabilistic law.
[1] Hermawan, H., Ramdan, D., Djuansjah, J.R. (2011). Metals for biomedical applications. Biomedical Engineering-From Theory to Applications, 1: 411-430. https://doi.org/ 10.5772/19033
[2] Bertolini, J., Castanié, B., Barrau, J.J., Navarro, J.P. (2009). Multi-level experimental and numerical analysis of composite stiffener debonding. Part 1: Non-specific specimen level. Composite Structures, 90(4): 381-391. https://doi.org/10.1016/j.compstruct.2009.04.001
[3] Mummery, P., Derby, B. (1991). The influence of microstructure on the fracture behaviour of particulate metal matrix composites. Materials Science and Engineering: A, 135: 221-224. https://doi.org/10.1016/0921-5093(91)90566-6
[4] Sbiai, A., Kaddami, H., Fleury, E., Maazouz, A., Erchiqui, F., Koubaa, A., Soucym J., Dufresne, A. (2008). Effect of the fiber size on the physicochemical and mechanical properties of composites of epoxy and date palm tree fibers. Macromolecular Materials and Engineering, 293(8): 684-691. https://doi.org/10.1002/mame.200800087
[5] Gurvich, M.R., Dibenedetto, A.T., Pegoretti, A. (1997). Evaluation of the statistical parameters of a Weibull distribution. Journal of Materials Science, 32(14): 3711-3716. https://doi.org/10.1023/A:1018603118573
[6] Shahar, F.S., Sultan, M.T.H., Lee, S.H., Jawaid, M., Shah, A.U.M., Safri, S.N.A., Sivasankaran, P.N. (2019). A review on the orthotics and prosthetics and the potential of kenaf composites as alternative materials for ankle-foot orthosis. Journal of the Mechanical Behavior of Biomedical Materials, 99: 169-185. https://doi.org/10.1016/j.jmbbm.2019.07.020
[7] Berthelot, J.M. (2003). Transverse cracking and delamination in cross-ply glass-fiber and carbon-fiber reinforced plastic laminates: Static and fatigue loading. Appl. Mech. Rev., 56(1): 111-147. http://dx.doi.org/10.1115/1.1519557
[8] McGuinness, G.B., ÓBrádaigh, C.M. (1998). Characterisation of thermoplastic composite melts in rhombus-shear: the picture-frame experiment. Composites Part A: Applied Science and Manufacturing, 29(1-2): 115-132. https://doi.org/10.1016/S1359-835X(97)00061-4
[9] Chermant, J.L., Osterstock, F. (1976). Fracture toughness and fracture of WC-Co composites. Journal of Materials Science, 11(10): 1939-1951. http://dx.doi.org/10.1007/BF00708272
[10] Djeghader, D., Redjel, B. (2020). Weibull analysis of fatigue test in jute reinforced polyester composite material. Composites Communications, 17: 123-128. https://doi.org/10.1016/j.coco.2019.11.016
[11] Arenas, J.M., Narbón, J.J., Alía, C. (2010). Optimum adhesive thickness in structural adhesives joints using statistical techniques based on Weibull distribution. International Journal of Adhesion and Adhesives, 30(3): 160-165. https://doi.org/10.1016/j.ijadhadh.2009.12.003
[12] Thomas, C. (1968). Modern composite materials. Edited by LJ Broutman and RH Krock, Addison-Wesley, Reading, Mass.
[13] Zweben, C., Rosen, B.W. (1970). A statistical theory of material strength with application to composite materials. Journal of the Mechanics and Physics of Solids, 18(3): 189-206. https://doi.org/10.1016/0022-5096(70)90023-2
[14] Margetson, J., Brokenbrow, B.E. (1980). Brittle tensile failure characteristics of propellants derived from flexural tests. Peopellants and Explosives, 5(6): 151-157. http://dx.doi.org/10.1002/prep.19800050603
[15] Vicente, A.R., Saladie, M., Rose, J.K., Labavitch, J.M. (2007). The linkage between cell wall metabolism and fruit softening: looking to the future. Journal of the Science of Food and Agriculture, 87(8): 1435-1448. https://doi.org/10.1002/jsfa.2837
[16] Achouri, S., Redjel, B., Bourebia, M., Berdjane, D., Bouhouche, S. (2015). Fracture behavior and mechanical characterization of a composite orthopedic use in the two direction of flow molding. In 2015 International Conference on Industrial Engineering and Operations Management (IEOM), pp. 1-6. http://dx.doi.org/10.1109/IEOM.2015.7228100