Soufiane Merabti* | Karima Grioui | Younes Menni | Ali J. Chamkha | Giulio Lorenzini | Nasreddine Sakhri | Houari Ameur
OPEN ACCESS
This work has undertaken a study of the influence of some parameters on the energy balance of a premise located in an arid area. The objective of this study is to calculate the heat of a South facing office record, and study the influence of various parameters such as: glazing, insulation, orientation, building materials and occupants. The system is composed of a desktop represented by its design, and external surrounding climatic condition of Bechar city.
energy balance, heat balance, arid zone, thermal comfort, insulation glass
We live in a constantly changing environment. Technological advances allow us to live in more comfortable conditions. Each change involves disruption of the initial equilibrium established between the individual and his environment. We must therefore constantly adapt.
The expected increase in fuel and electricity prices led to seek for ways to reduce heating and cooling costs. Because the habitat presents 30 % of the total energy, one of these is to reduce the necessary energy needs insulating housing or more generally, by reducing losses and gain heat. Therefore, preserve nature [1-3].
Many parameters influencing the thermal comfort. It would be unrealistic to address in this work the problem in its entirety. That is why this work focuses, in particular, on the evolution of energy balance in summer by the influence of some parameters such as: windows, insulation, orientation, construction materials and human [4-5].
The system studied is composed of a desktop represented by its design, and its external surrounding climatic conditions of Bechar city [6-7].
The heat balance corresponds roughly to heat inputs from outside. This is a key component in designing a suitable and economy air conditioning. It allows sizing the air conditioning unit, whose role, is to remove heat from the room to the outside.
To perform a heat balance, many elements should be taken into consideration. Must know the surfaces of walls, windows, floors and ceilings of rooms to be air conditioned, which will be multiplied by coefficients to express the result in watts.
Then, the heat balance calculation is used to determine the power of an air conditioning or heating the building principal purpose in maintaining an atmosphere conditions that contribute to the comfort of the individual in his environment [4].
Calculation of heat transfer coefficient of global:
The calculation of heat transfer through a supposed body surface coefficient known transmission (he, hi) and the side dimensions and coefficients of wall material, or of the heat transfer coefficient "U" global depends the constitution of the wall, the inclination of the walls [4, 8-10]. The general equation of the overall coefficient is:
$\frac{1}{U}=\frac{1}{h i}+\frac{1}{h e}+\sum_{i=1}^{n} \frac{e i}{\lambda i}=R$ (1)
Thermal balance in summer (D.T.R C 3-4):
Internal gains:
In addition to the heating system, we must consider the heat gain from the occupation of the building, i.e., the heat generated by the metabolism of people with artificial lighting and the use of devices office, mainly computers [11-13]. These three types of internal gains are calculated separately.
Gains due to lighting:
Gains lighting contitutes a source of sensible heat. If one knows the installed power for lighting the gains from lighting are given by the following formula:
$G_{e}=\sum P_{n} \times C_{m e} \times C_{c r}$ (2)
Gains due to occupants:
The human body is the seat of endothermic transformations whose intensity varies according to the individual and the activity undertaken. Part of its dissipated in the environment as sensible and latent heat forms:
$\mathrm{G}_{\mathrm{os}}=\mathrm{Nbp} . \mathrm{MS}$ (3)
$\mathrm{G}_{\mathrm{O}_{\mathrm{L}}}=\mathrm{Nbp} \cdot \mathrm{ML}$ (4)
External gains:
Heat gains due to external walls:
The heat gain by the outer walls (wall, roof) are due not only to the difference between the air temperatures lignant their outer and inner faces, but also to the fact that their outer faces are subjected to solar radiation for this there are tables that give the equivalent temperature difference (CLTD) [4].
The heat gain through the walls write:
$\mathrm{Gm}=\mathrm{Um} \cdot \mathrm{Am} \cdot(\mathrm{CLTD})$ (5)
$ (\mathrm{CLTD}) \text { corr }=\mathrm{CLTD}+(25-\mathrm{Tint})+(\mathrm{Text}-29.5)$(6)
Gains due to glass:
Gains due to glazing are the sum of earnings due to the penetration of solar radiation and gains due to the temperature difference.
Gains due to penetration solar radiation:
$\mathrm{Gvr}=\mathrm{Av} . \mathrm{SC} . \mathrm{SHGF} . \mathrm{CLF}$ (7)
Gain due to the difference in temperature:
$\mathrm{G}_{\mathrm{VD}}=\mathrm{UV} \cdot \mathrm{Av} \cdot(\mathrm{Text}-\mathrm{Tint})$ (8)
Gain due to edges:
$\mathrm{Gb}=\mathrm{P.F}(\text { Text }-\mathrm{Tint})$ (9)
Gains by infiltration:
$\mathrm{G} \mathrm{inf}=\mathrm{G} \mathrm{inf}_{\mathrm{s}}+\mathrm{G} \mathrm{inf}_{\mathrm{L}}$ (10)
$\mathrm{G} \text { inf }_{\mathrm{s}}=\operatorname{qinf} . \text { Cpinf }(\mathrm{Text}-\mathrm{Tint})$ (11)
$\mathrm{G} \text { inf }_{\mathrm{L}}=\operatorname{qinf} .(\mathrm{xe}-\mathrm{xi}) . \mathrm{hfg}$ (12)
$\operatorname{qinf}=\frac{N}{3600 \cdot v_{e}} V$ (13)
$\mathrm{N}=\mathrm{a}+\mathrm{b} . \text { wair }+\mathrm{c} |(\mathrm{T} \text { ext }-\mathrm{T} \text { int }) |$ (14)
$\mathrm{Cpinf}=\mathrm{Cpa}+\mathrm{xe} \mathrm{Cpv}$ (15)
The objective of this study is to calculate the heat of a South facing office record, and studied the influence of various parameters such as: glazing, insulation, orientation, building materials and occupants.
Climate:
Consider climate changes Bechar is not stable throughout the season. For this we are based on the worst case. To ensure thermal comfort in the office, we will achieve the basic conditions Interior. Exterior basic requirements are based on the technical regulatory document [14]. They are summarized in the following table:
Table 1. Basic conditions
|
|
Basic conditions: Ext |
Basic conditions: Int |
||
|
|
Winter |
Summer |
Winter |
Summer |
|
T (°C) |
5 |
44 |
20 |
27 |
|
φ (%) |
46 |
20 |
50 |
50 |
|
Tsol (°C) |
10 |
- |
- |
- |
Description of local study:
The office is considered integrated in a public building that work to provide administrative services, on the second floor of it. This office has an area of 12 m², as shown in Figure 1.
Figure 1. The analyzed office: location, orientation, construction and facades
This model, its walls that exchanges heat with the external conditions are: front rear, right side elevation and ceiling. Considering that its other walls are adiabatic and thus neglecting the exchange of heat with the neighboring premises. This idea is based on the fact that all premises must meet the same standards of comfort and thus the temperatures reached in these premises are identical.
The calculations are performed for a main orientation: South. For each of the walls the value of overall transmission coefficient is obtained from the equation (1).
The different layers (components) of different walls are summarized in the tables below:
Table 2. The external walls
|
Composition |
e (m) |
λ (w/°C.m) |
R (m². °C/w) |
|
Cement mortar |
0.015 |
1.15 |
0.013 |
|
Ordinary brick |
0.15 |
1.08 |
0.139 |
|
Plate of air |
0.05 |
0.31 |
0.161 |
|
Ordinary brick |
0.15 |
1.08 |
0.139 |
|
Plaster |
0.015 |
0.35 |
0.042 |
|
$\frac{1}{h i}+\frac{1}{h e}$ |
0,170 |
||
|
U (w/ m². °C) |
1.504 |
||
Table 3. Top floor
|
Composition |
e (m) |
λ (w/°C.m) |
R (m². °C/w) |
|
Gravel rolled |
0.020 |
1.050 |
0.019 |
|
Sealing multilayer |
0.010 |
0.017 |
0.588 |
|
Farm slope |
0.030 |
1.150 |
0.026 |
|
Concrete slab |
0.040 |
1.750 |
0.023 |
|
hollow body |
0.160 |
0.720 |
0.222 |
|
Gypsum plaster |
0.015 |
0.350 |
0.043 |
|
False ceiling: |
|
|
|
|
Internal air |
0.800 |
|
0.140 |
|
Plaster |
0.030 |
0.350 |
0.086 |
|
$\frac{1}{h i}+\frac{1}{h e}$ |
0,140 |
||
|
U (w/ m². °C) |
0,777 |
||
We do not consider the constitutions low floor in our study, by what our office is located on the second floor of the administration building.
In our case:
Glazing: Single type with a common wood carpentry
U = 5.00 w/ m².°C [14].
Metabolism: We consider a person occupying this office liberates approximately 58 W of sensible heat and 73W latent heat.
Lighting: illuminated by a fluorescent tube whose power is: 18W.
Equipment office: the office includes the following devices:
(1). 1 PC (115 W)
(2). 1 Laser printer (100 W).
Digital heat balance in summer application:
Superficial exchanges are slightly larger in summer than in winter. The increase takes into account, on the one hand the fact that indoor air is stirring (agitation due to air conditioning), and secondly the fact that the high temperature of the exposed surface increases the heat transfer by convection [3].
The total installed capacity for a room must not be less than its earnings base. So the total power necessary for this office Q equals the sum of earnings with 15 % increase:
|
internal gains |
external gains |
GT (w) |
Q (w) |
|||||||
|
Ga |
Ge |
Go |
Gm |
Gt |
Gv |
Gb |
Ginf |
|||
|
215.00 |
22.50 |
131.00 |
498.52 |
324.79 |
693.88 |
57.80 |
55.38 |
1998.87 |
2298.68
|
|
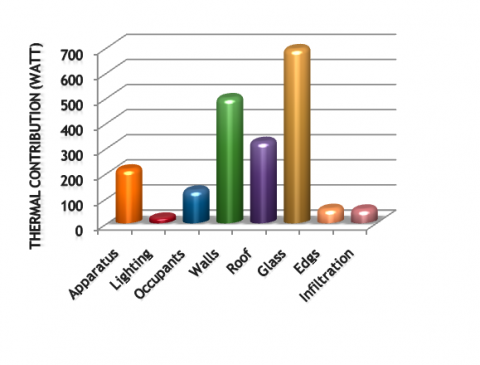
The gains for each heat and the total power Q are summarized in the following table and shown in Figure 2.
Figure 2. The global thermal contribution
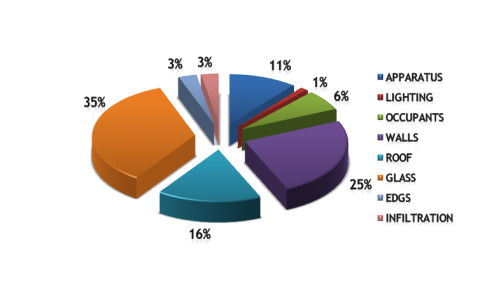
Figure 3. Percentage of the different parameters of the heat balance
By analyzing the energy of office taken as a reference study report, we see that the glass is 35 % of total assets (see Figure 3) and showing his dominance and therefore its direct influence on comfort.
As against the walls account for 25 % and are placed in sequence after the second glazing, it should be noted that the walls are important for the characteristic of thermal comfort.
If you see the roof representing 16 % of the overall balance is not negligible and if added to its walls is 41 % almost half of the heat balance where it is essential to always respect and take care of nature materials and their structure if we want to save energy.
In this case chosen beware the values of other parameters that can be dominant. If the edges here is 3 % for the perimeter of a small office and bonds is almost perfect, there may be the opposite and end up with a significant value even for lighting in our case we see that the occupant and infiltration is 10 % .
4.1 Influence of the type of glass
Glazing plays an important role in the thermal behavior of a building; however its orientation is not overlooked. It is through this reflection that the influence of this parameter was analyzed by considering the non- isolated local studied.
Table 5. Types of glass test
|
Type |
Designation |
U (w/m². °C) |
|
Type 1 |
Simple glazing (Initial Case) |
5.00 |
|
Type 2 |
Glass colored absorbent |
2.80 |
|
Type 3 |
Double glazing |
1.10 |
|
Type 4 |
Double glazing: Ext absorbent - Int ordinary |
0.50 |
The results will be as follows:
Table 6. Gains due to different types of glass
|
Type |
Uv (w/m². °C) |
GVD (w) |
GVr (w) |
GVTotal(w) |
GT (w) |
|
Type 1 |
5.00 |
244.80 |
449.09 |
693.88 |
1998.86 |
|
Type 2 |
2.80 |
137.08 |
345.08 |
482.16 |
1787.14 |
|
Type 3 |
1.10 |
53.85 |
387.63 |
441.48 |
1746.46 |
|
Type 4 |
0.50 |
24.48 |
274.17 |
298.65 |
1603.63 |
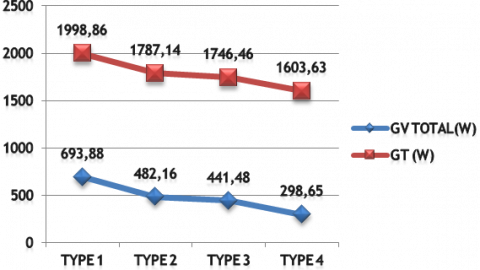
Figure 4. Influence de of each type of glazing needs refreshment
It can be seen from Figure 4 that reduced cooling needs when going from type 1 (ordinary glass) type 4 is very sensitive. This decrease is due to the reduction of heat flow through a selective glazing (type 2, 3, and 4) with respect to an ordinary glass (type 1) for the transmission coefficient is low overall heat moving towards types 2, 3, and 4. Thus benefiting from:
Type 2: 211.72 watts which represents 10.6 % of total needs.
Type 3: 252.4 watts which represents 12.6 % of total needs.
For type 4: 395.23 watts representing 19.7 % of total needs.
4.2 Influence of the orientation of glass
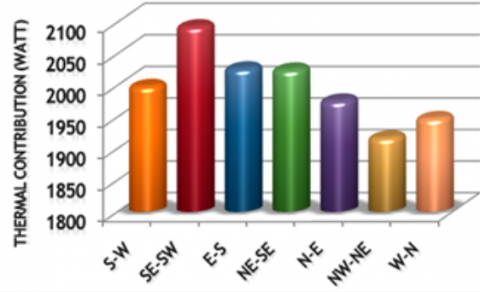
It can be seen from Figure 5 that the decrease in heat input when will an east orientation (Window 1: W1) South (window 2: W2) in a direction North West North East is very light. Needs are when the orientation is for the South East and South West 1 window to the second window. This behavior is explained by the fact that the two walls facing south receives a maximum amount of solar energy in summer , while the north is practically no solar gain is the case of the NW- NE, thus optimizing the orientation of windows leads to a tangible reduction in cooling requirements , it is preferable to add still more of a north south glazed window with a smaller surface and contribute to the improvement of natural light in winter and natural ventilation in summer when windows are open. It is found that the orientation of the glazing to the north is obviously the most favorable summer comfort because it is not likely to bring overheating. Note that the difference is not very large, it is around 23 % and this can be explained by the fact that the orientation of the glazing to the south was not really present much of a problem because the sun is at the top of its trajectory and it can be easily protected by a cap or architectural plants masks. The gain value due to the temperature difference remains constant (GVD = 244.8 W) as Av, Uv, Text and Tint keep its values in all cases guidance for both windows (W1 and W2).
Figure 5. Influence of the orientation of the glazing needs refreshment
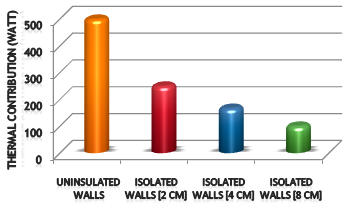
4.3 Influence of isolation
The thermal insulation is a key parameter affecting the reduction of energy costs in air-conditioned buildings; the insulation thickness certainly has a significant role on the thermal performance of the building. For this we study the influence of 2 cm, 4 cm and 8 cm insulation (polystyrene, λ = 0.03 W/m.° C) relative to the outer walls of the room they are not studied in isolation.
Thus the coefficient of overall heat transmission exterior wall becomes:
(1). 2 cm: U = 0.75 w/ m².°C.
(2). 4 cm: U = 0.5 w/ m².°C.
(3). 8 cm: U = 0.3 w/ m².°C.
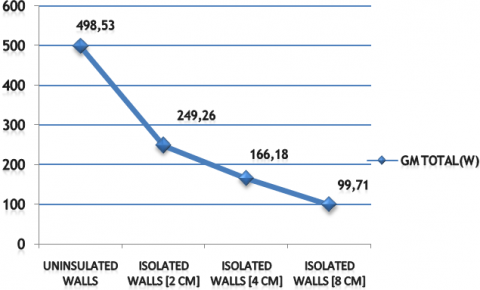
Table 7. Gains due to external walls with insulation
|
Insulation |
Um |
Wall South |
Wall west |
GMTotal(w) |
GT (w) |
||
|
CLTD |
Am |
CLTD |
Am |
||||
|
Uninsulated |
1.50 |
18.3 |
10.56 |
18.4 |
7.56 |
498.53 |
1998.86 |
|
Thic =2 cm |
0.75 |
18.3 |
10.56 |
18.4 |
7.56 |
249.26 |
1749.60 |
|
Thic =4 cm |
0.50 |
18.3 |
10.56 |
18.4 |
7.56 |
166.18 |
1666.51 |
|
Thic =8 cm |
0.30 |
18.3 |
10.56 |
18.4 |
7.56 |
99.71 |
1600.04 |
Figure 6. Heat inputs for different outer walls
Figure 7. Heat inputs for different outer walls
We deduce that local insulation led to a reduction in heat gain in summer, which undoubtedly reduces the cost of cooling.
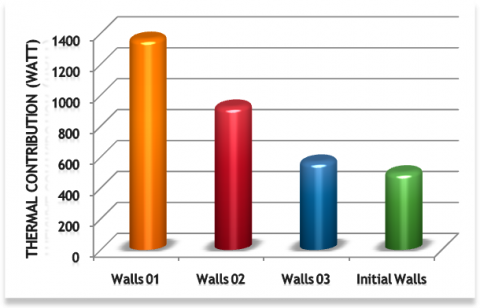
4.4 Influence of construction materials
The building envelope plays a thermal separation between the inner and outer atmosphere, it acts as a heat storage in the building and as a distributor of the latter to the indoor and outdoor air [11-13], continuing our investigation and we propose to study in detail the thermal behavior of single wall or multi different compositions, to identify those that allow greater energy savings in the case of air conditioning for the Saharan context. For opaque walls, we consider the most used in the building construction sector in Southern Algeria variants. It is noted that the compositions of the initial local external walls are studied most optimal in this case compared to other compositions (Figure 8). The various layers (components) of the outer walls are summarized in the table below:
Table 8. Gains due to various layers of the outer walls
|
Wall |
composition |
e (m) |
Um (w/m².°C) |
GmTotal(w) |
GT (w) |
|
1 |
Raw concrete coated |
0.10 0.01 |
4.10 |
1362.64 |
2862.98 |
|
2 |
Coated Cinderblock Coated |
0.01 0.15 0.01 |
2.78 |
923.93 |
2424.27 |
|
3 |
Coated Raw concrete Air layer Raw concrete Coated |
0.01 0.20 0.05 0.20 0.01 |
1.71 |
568.32 |
2068.66 |
Figure 8. Heat inputs for different outer walls tested
Through this study we have tried to highlight some important parameters and the energy balance and their influence on the cooling requirements and thermal comfort.
While the thermal study is an abstract concept, but his understanding and support solves several problems, especially economic and pollution. This aspect is underestimated by the manufacturer, and built housing will quickly reveal uncomfortable because they are poorly exposed, poorly constructed, poorly ventilated and poorly insulated. In this context we undertook a study of the influence of some parameters on the energy balance of a local located Bechar. Based on assessments developed, we found that you should never guide construction south also reduce the glass surface or move towards a selective glazing. It was also found that the way built the walls is very relevant to make insensitive to external weather stresses occupants while minimizing heat gain. Therefore we must now learn to build with the climate. The couple often climaticien architect working hard. Yet if there is one area where a fruitful dialogue is necessary, it is that the climate process.
[1] Merabti, S., Bounaama, F., Draoui, B. (2019). Experimental study and thermal modeling (linearization of nonlinear system) of building: southwest Algeria case. Journal of Advanced Research in Fluid Mechanics and Thermal Sciences, 58: 30-42.
[2] Soufiane, M., Imane, B., Ikram, R., Fatah, B., Belkacem, D. (2018). Modeling and control thermal of building for improve comfort level by using PID and on/off methods in the case south-west Algeria. In Artificial Intelligence in Renewable Energetic Systems, Cham, 383-391. https://doi.org/10.1007/978-3-319-73192-6_40
[3] Merabti, S., Draoui, B., Bounaama, F. (2016). A review of control systems for energy and comfort management in buildings. In 2016 8th International Conference on Modelling, Identification and Control (ICMIC), 478-486. https://doi.org/10.1109/ICMIC.2016.7804161
[4] I. d. C. e. d. É. d. D. Durable, Conception énergétique d’un bâtiment tertiaire, 2004.
[5] Brown, W.C., Stephenson, D.G. (1993). Guarded hot box measurements of the dynamic heat transmission characteristics of seven wall specimens. ASHRAE Transactions 99(1): 632–642.
[6] Boudjema, O. (2019). Gestion du microclimat d’un local de laboratoire de recherche. PhD, Tahri Mohamed University.
[7] Missoum, A., Elmir, M., Bouanini, M., Belkacem, D. (2016). Numerical simulation of heat transfer through the building facades of buildings located in the city of Bechar. https://doi.org/10.1016/j.egypro.2013.07.096
[8] Tanous, C. (2005). Efficacité énergétique des bâtiments résidentiels.
[9] E. I. 6946. (2007). Building Components and Building Elements-Thermal Resistance and Thermal Transmittance-Calculation Method, in European Committee of Standardization, Brussels, ed.
[10] E. I. 13786. (2007). Thermal Performance of Building Components-Dynamic Thermal Characteristics-Calculation Methods.
[11] E. I. 13790. (2008). Energy Performance of Buildings-Calculation of Energy Use for Space Heating and Cooling, in European Committee of Standardization, Brussels, ed.
[12] E. I. 13792. (2005). Thermal Performance of Buildings-Calculation of Internal Temperatures of a Room in summer without Mechanical Cooling-Simplified Methods.
[13] ASHRAE, Handbook of Fundamentals, (American Society of Heating, Refrigerating and Air-conditioning Engineers, 2010.
[14] Mebarki, B. (2004). Etude de dimensionnement d’une installation de ventilation et de conditionnement d’air de l’aéroport de Mécheria, Tahri Mohamed University.