Pallavi Chaudhury* | Sikata Samantaray
OPEN ACCESS
This research paper deals with the study of the thermal modeling of Al-A359 reinforced with 10 % SiC Composites (Particulate metal matrix Composite) machined by Electrical Discharge machining (EDM). The composite has been fabricated by Powder metallurgy (P/M) route. Due to high hardness of the Graphite reinforced particle it has been always difficult to machine these composites by the conventional machining route. In this investigation EDM procedure has been introduced to machining the PMMC. The numerical model has been developed by designing a 3D axi-symmetric work domain with the help of Finite analysis software. The effect of variable thermal properties on the modeling of PMMC is also introduced in this study. The effect of three different types of heat source (Disk heat, Point heat & Gaussian heat source) on the Al-A359 Composite machining has been analyzed. From the analysis it can be concluded that the Gaussian heat source model with varying Specific heat (Model-III) has been validated with the experimental result with least error of 11 %. The highest Material removal rate of 25.12 (*10-3 mm3/min). At 10 A current, 100V voltage and 100µS Pulse-On time has been estimated.
powder metallurgy, particulate metal matrixes composite, thermal modeling, electrical discharge machining, finite element method, specific heat, heat flux, material removal rate
The demand of light weight. durable and strong component in the aviation sector leads to the fabrication of Aluminum based composites. Due to its lightweight Aluminum composite also has a huge application in automobile sector but due to its low melting point and low strength its use has been restricted to that component which has an application of high heat treatment areas. Many researchers found [1-3] Silicon Carbide/Silicon Nitride are very suitable ceramic composites which could raise the strength and thermo-physical composite properties but due to their high sintering temperature its difficult to fabricate. SiC either in particle or in whisker form can be added within the Al-A359 composites by P/M route. The addition of SiC particle in to the composite increases the hardness and strength to weight ration of a composite which is also known as Particulate Composite (PMMC). The literature review suggests that the addition of 10-15 % vol of SiC is the highest range of addition of reinforcement which gives the highest thermo mechanical properties of a PMMC [4].
The machining of Metal matrix material (MMC) especially SiC added Aluminum composites has been restricted due to the tool wear, cracking of the composites, High machining cost & low surface finish of the composites. The need of MMCs over the metal alloys not only due to the light weight and high strength but also increased the wear resistance over the conventional hyper eutectic Al-SiC alloy. Among various application of the MMC, One of the best applications of Al-SiC MMC in the high temperature region of automobile parts is the Piston ring groove which resists the high temperature resulting from combustion [6]. As these applications also required high surface finish texture which can’t be designed by Conventional machining process.
To overcome these obstacles of conventional machining Electrical discharge machining (EDM), Electrical Chemical machining (ECM), Abrasive Jet machining (AJM), and Laser beam machining (LBM) are the suitable technique for machining composites. Due to the poor surface finish quality obtained by AJM restricted its use for machining the Al/SiC composite similarly the thermal damage of the work piece surface restricted the use of LBM & ECM. EDM has a very unique thermo-physical mechanism which involves the conversion of electrical energy to the thermal energy by means of the erosive effect of material from its surface due to the high velocity plasma coming from the tool electrode, the performance parameters like M RR, TWR, Surface finish etc. can be increased by improving the mechanism of EDM [8]. EDM process involves thermo electric phenomena where the work and tool electrode both immersed within a dielectric liquid. With sufficient current and voltage the gap between the two electrodes ionized which produce high temperature spark plasma (around 12000˚C) which is sufficient to melt any reinforced hard ceramic material. Due to the high precision work of EDM now a days many aerospace, biomedical, automobile, MEMS industry are using the EDM process to get highly dimensionally accurate and high surface textured material.
Ponappa et al. [4] studied the machining of Microwave-sintered magnesium nano composites (reinforced with 0.8 and 1.2 wt. % of nano alumina). The Experiments has been optimized by Taguchi Design Expert methodology. Pulse-On time, Pulse-Off time, Current Voltage gap has been taken as the process parameters. ANOVA Analysis also has been performed to know the most significant factors to achieve surface finish. Vishwakarma et al. [5] has been studied the machining of Al6061 SiC composites. A 3D Axi symmetric model also has been developed to estimate the MRR for a single discharge EDM. Similarly for calculating the total MRR the number of pulse has been calculated. Validation of the model has been carried out by conducting the experiment. Puhan et al. [6] has been investigated the machinability of Al/SiC by EDM. The composites have been prepared by Powder metallurgy route. The four most important parameters (Current, Pulse duration, Duty cycle and flushing pressure) has been taken for investigating the influence of the other output parameters such as MRR, TWR, Circularity, SR. Two other input parameters such as weight fraction of silicon carbide in the composite and mesh size has also been studied with respect to the output parameters. Gopalnan et al. [7] studied the EDM of a newly developed metal matrix nano composite (MMNC) of Al 7075 reinforced with 0.5 wt % SiC nano particles by ultrasonic cavitation method. Copper tool has been taken as tool electrode in this analysis. The whole experiment has been optimized by face-centered central composite method. The developed mathematical models of MRR, TWR, and SR are fairly well fitted with experimental values with a 95 % confidence interval. Karthikeyan et.al [8] has been designed a mathematical model for the optimization of EDM of LM25 Aluminum matrix with SiC particle reinforcement. A three level factorial design has been considered for the analysis with linear, quadratic and interactive effects of the parameters such as current, pulse duration and percent volume fraction of SiC. Talla et al. [9] has been designed a Semi empirical models to establish relationship between the input and output parameters using a hybrid regression analysis. In this study the Powder mixed EDM has been performed for the machining of Al/SiC matrix composites. Different model equation has been derived from the regression analysis. From the model equations, it has been cleared that the thermal conductivity, coefficient of thermal expansion and density of the material also significantly affect both MRR and Surface Roughness (SR). Singh et al. [10] investigated a new hybrid mechanism of EDM of AA6061/10 % Graphite Flakes composite by mixing the tungsten powder additives in to the dielectric. The composite has been fabricated by mechanical stir casting process. Peak current, Voltage, pulse on-time, pulse off-time, are the machining parameters for optimizing the experiment. Mathematical equations for Central Composite Rotatable Design (CCRD) have been designed for better quality of output parameters like SR, hardness, Surface topography, RLT, HAZ.
Earlier the EDM process only restricted to the electrically conductive material but in today’s growing industry new engineering materials also need to be precisely machined surface, But as those materials and the EDM machining process are not cost effective so it needs a analytical methodology to analyze the whole machining process either manually (analytical models) or by commercial modeling software (Thermal modeling). Many researchers Since 1971 designed different types of analytical models for the theoretical analyses of EDM e.g., Dibitonto et al. [10]; Van Dijck et al. [11]; Van Dijck et al. [12]; Beck [13]; Jilani et al. [14]; Joshi et al. [15]; Salonitis et al. [16], These models varied from each other by means of different boundary conditions. Kansal et al. [17] has been developed an axi-symmetric 2D thermal model for AISID2 Die steel using the FEM. The model utilizes powder additives added in dielectric liquid along with other parameter to analyze the thermal profile and MRR for the EDM Process. The simulation shows that in this process smaller and shallower crater than normal EDM appears under the same set of machining conditions. The variation in prediction errors for MRR was found within ±5.5 %. As expected, the result shows that the maximum temperature is positioned at the core of workpiece, where intensity of heat flux (Gaussian heat distribution) is maximum and it decreases as move away from the centerline & it is represented by Eq. (3).
1.1 GAP in review
From the above literature review it can be concluded that the No significant work has been performed for the thermal modeling of metal matrix composites which can be machined by EDM. Many Researchers have already been developed theoretical model by considering Gaussian heat source for machining by EDM. But least work has been performed for a comparative study of the effect of different heat flux on the MMC and PMMC machining. Least work has been done by considering the variable thermal properties (Thermal conductivity and specific heat w.r.t temperature change) on the thermal modeling of EDM process. It can be observed that the mathematical model along with optimal condition of the EDM parameters for MMC/PMMC has been reported so far.
1.2 Objective
In the present research the thermal modeling of the Al A359 SiC (PMMC) machined by EDM has been performed along with the experimental validation. Three different types of heat sources (Disk, Point, Gaussian heat source) have been applied to the thermal models to see the effect on the performance parameters. Moreover the effect of variable Specific heat and thermal conductivity on the thermal modeling has been also studied. The obtained result of the thermal modeling has been compared with the experimental results of Crater geometry and MRR.
2.1 Experimental set-up
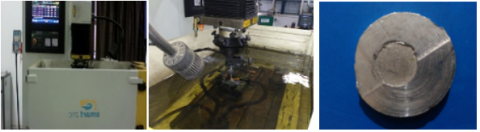
Figure 1. (a) Die-Sinking EDM Machine, (b) EDM Machining of Al-A359, (c) Al-A359 work piece after machining by EDM
The experiments for machining Al-A359 PMMC has been carried out by die sinking EDM machine (Elecktra Plus electrical discharge machine; model SMART ZNC). Normal EDM oil has been taken as dielectric liquid. For the experiment the Powder metallurgy fabricated Aluminum PMMC has been used as work piece and Copper is being used as tool electrode. The gap between tool and work piece has been varied from 2 µm to 4 µm. All the dimension of both the electrodes has been presented on table no.1. For this study all the input parameters have been considered according to Table-3. The experimental set-up and machined work piece have been represented in Figure 1.
2.2 Experimental methodology
The experiment has been carried out by considering Al-A359PMMC as work piece and Cu as tool electrode with straight Polarity condition (W/Pc(-), tool(+)). For this experiment of EDM three different levels of current and pulse-On time has been considered as variable input parameters by keeping Voltage as constant. All the input parameters have been represented in Table 1. The physical properties of the work piece have been represented in Table 2.
Table 1. Process parameters of EDM
|
|
Work piece |
Electrode |
|
Material |
Al A359-10 % SiC |
Copper |
|
Dimension |
(0.7*0.7) mm |
0.24 mm Dia. |
|
Current (I) |
6A, 8 A, 10 A |
|
|
Voltage (V) |
100V |
|
|
Spark Radius (R) |
120 µm |
|
|
Pulse-On Time (Ton) |
20 µs, 40µs, 60µs |
|
|
Pulse-Off Time (Toff) |
10µs |
|
Table 2. Physical property of Al A359-10 %SiC
|
Properties |
Work piece (Al matrix A359) |
Reinforcement (SiC) |
|
Density (Kg/m3) |
2700 |
4370 |
|
Young’s Modulus (GPa) |
72 |
408 |
|
Thermal Conductivity (W/m/K) |
180 |
30 |
|
Specific heat (J/Kg/K) |
963 |
706 |
In this study a 3D axi-symmetric computational domain has been developed for the thermal modeling of Al-A359 PMMC. Although the fundamental principle of EDM is simple, still it’s difficult to model the process due to the involvement of various mechanisms like electro-thermal, magnetic, hydro-thermal etc. at cathode & anode electrode. To simplify the modeling procedure following assumption has been considered for this study.
3.1 Assumption for thermal analysis
(1). The work piece has been considered as an axi-symmetric domain.
(2). The work piece material considered as homogeneous & isotropic.
(3). The physical properties of work electrode are temperature dependent.
(4). Heat transfer due to radiation has been neglected.
(5). Total work domain is considered to be 25 ˚C.
(6). Temperature effect along angular direction has been neglected.
(7). Single spark discharge has been considered for the analyses.
(8). The flushing efficiency is considered to be 100 %.
(9). The work piece is free from any residual stresses.
(10). The shape of Gaussian flux has been considered as circular.
3.2 Governing equation
In EDM Process during the spark discharges, the work piece surface exposed to heat flux that produces enough thermal energy which is sufficient to melt the surface. This thermal analysis involves major heat transfer phenomena i.e. heat due to conduction. The temperature profile & the heat transfer may be calculated by solving Fourier heat conduction equation (1) which is given by:
$ρC_P\frac{∂T}{∂t}=[\frac{1}{r}\frac{∂}{∂r}(kr\frac{∂T}{∂r})+\frac{∂}{∂z}(k\frac{∂T}{∂z})]$ (1)
where, r, z are the coordinates of the axi-symmetrical work domain, T is the increase in temperature (K); K is the thermal conductivity of work piece (W/m K), ρ is density of the work piece (Kg/m3) and Cp is the Specific heat capacity (J/Kg K) of the work piece.
3.3 Boundary condition for modeling
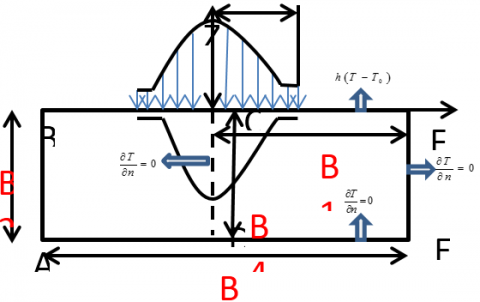
The boundary condition for the analysis of the modeling of the EDM process has been shown by the 3D axi-symmetrical domain Figure 2. The initial temperature of the work domain is at 298K (ambient temperature). The required heat flux has been applied at the spark radius (R) portion of the work piece. The total work domain has been divided in different regions as shown in the Figure 2.
At region-(1) heat flux boundary condition has been applied (Disk, Point & Gaussian heat flux) as given in the equation (Eq. (2)) for different models.
At region-(2) two types of boundary condition has been given i.e either insulated or convective for different model.
At region-(3) insulated boundary condition has been given for all models.
Depending on different combination of boundary conditions the models are named differently as model-I, II, III. For uniform/Disk heat flux, Point heat flux & Gaussian heat flux respectively. The geometric shape of the crater obtained from the work surface after machining depends on two factors firstly the amount of thermal energy and secondly the type of heat source applied to the work surface. The heat amounts entering in to the work piece is being considered as factor Fc. Thus, the relevant boundary conditions for different models are summarized below:
Model-I: (Disk Heat Source): Two dimension uniform heat flow
$BCs:K(\frac{\partial T}{\partial z})=\left\{ \begin{matrix} {{h}_{c}}(T-{{T}_{0}}),r>R \\ q(r)(Disk\text{ heat source}),r\le Ron{{B}_{1}} \\ 0,for\text{ off time} \\\end{matrix} \right\}$(2)
For boundary B2, B3, B4: $\frac{∂T}{∂n}=0$
Model-II: (Point Heat Source): Two-dimensional Point heat flow (Spark radius is very small in comparison to work domain)
$BCs:k(\frac{\partial T}{\partial z})=\left\{ \begin{matrix}{{h}_{c}}(T-{{T}_{0}}),r>R \\ q(r)(Po\operatorname{int}\text{ heat source}),r<<Ron{{B}_{1}} \\ 0,for\text{ off time} \\\end{matrix} \right\}$
For boundary B2, B3, B4: $\frac{∂T}{∂n}=0$
Model-III: Two-dimensional heat flow with Gaussian heat flux with Convective heat transfer
$BCs:K(\frac{\partial T}{\partial z})=\left\{ \begin{align} & {{h}_{c}}(T-{{T}_{0}}),r>R \\ & q(r)(Gaussian\text{ }heat\text{ }source), \\ & r\le R\text{ }on\text{ }{{B}_{1}} \\ & 0,for\text{ }off\text{ }time \\\end{align} \right\}$ (3)
For boundary B2, B3, B4:$\frac{∂T}{∂n}=0$
3.4 Heat source
Figure 2. 3D work domain with boundary condition
The type of heat flux is a most significant factor for analyzing the crater geometry. In this present analysis three different types of heat sources are analyzed by applying it on the spark radius zone. The effect of heat flux on the spark plasma area can be shown by the shape of temperature contour obtained at the end of simulation. The absorbed power and the fraction of heat entering in to cathode is being considered as constant in three different types of heat flux models. The three different heat fluxes are represented as follows.
(1) F1 Point Heat Source,$q=\frac{F_C.VI}{2πR^2}$
(2) F2 Disk Heat source,
$q=\frac{F_C.V^I}{πR^2}$ (4)
(3) F3 Gaussian Heat Source, $q=\frac{4.57.Fc.VI}{πR^2} e^-4.5(\frac{r}{R})^2$
where, q (W/m2) is the amount of heat flux, V (V) is the discharge voltage, I (A) is the discharge current, Fc (%) is the fraction of thermal energy entering in to work piece top surface, which is considered as 5 % in this study, R (m) is the radius of the heat source at the cathode surface, r (m) is the radius of work piece.
3.5 Effect of specific heat
The Specific heat factor has a significant role for absorbing the thermal energy in to the work piece resulting in high temperature around the melt pool. The analytical thermal models of the EDM analysis have not considered the variable thermal properties factor in to the analysis. But in Joshi et al. [14] has considered the variable Specific heat factor by replacing the constant Specific heat. This Specific heat included for the temperature dependency properties can be represent by a smooth Dirac function in the following Eq. (5) [13].
$C_P^γ=C_P(T)+h_f δ_s (T)$ (5)
(1) CP1 (Constant value of Specific heat at room temperature)
(2) CP2 average value (Considered between room temperature to melting temperature)
(Considering Specific heat variation throughout the temperature)
Table 3. Variation in thermal conductivity and specific heat w.r.t temperature for Al-A359 PMMC
|
Temperature (K) |
Thermal Conductivity (W/m K) |
Specific heat Heat (J/Kg K) |
Density (Kg/m3) |
Temperature (K) |
Thermal Conductivity (W/m K) |
Specific heat Heat (J/Kg K) |
Density (Kg/m3) |
|
0 |
180 |
963 |
2700 |
2900 |
165.2 |
1750 |
1900 |
|
100 |
179.3 |
963 |
2640 |
3100 |
164.4 |
1680 |
1870 |
|
300 |
178.5 |
963 |
2600 |
3300 |
162.7 |
1450 |
1740 |
|
500 |
177.8 |
963 |
2570 |
3500 |
158.4 |
1270 |
1655 |
|
700 |
176 |
963 |
2550 |
3700 |
156.7 |
1060 |
1590 |
|
900 |
175.2 |
963 |
2500 |
3900 |
152.8 |
963 |
1400 |
|
1100 |
174.7 |
963 |
2480 |
4100 |
148.6 |
963 |
1365 |
|
1300 |
173.1 |
963 |
2460 |
4300 |
147.7 |
963 |
1280 |
|
1500 |
172.7 |
1000 |
2400 |
4500 |
145.8 |
963 |
1000 |
|
1700 |
171.8 |
1128 |
2350 |
4700 |
141 |
963 |
968 |
|
1900 |
170.4 |
1365 |
2300 |
4900 |
138.6 |
963 |
868 |
|
2100 |
169.5 |
1500 |
2260 |
5100 |
135 |
963 |
756 |
|
2300 |
168.7 |
1677 |
2060 |
5300 |
133.8 |
963 |
760 |
|
2500 |
167.7 |
1780 |
2000 |
5500 |
130.7 |
963 |
755 |
|
2700 |
166.5 |
1900 |
1987 |
5700 |
127.5 |
963 |
750 |
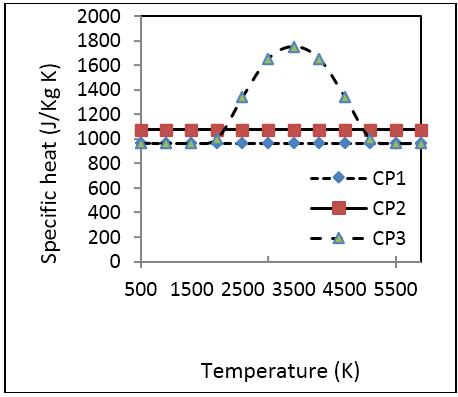
Figure 3. Variation of specific heat (CP1, CP2, CP3) w.r.t temperature
In EDM material removal phenomena mainly affected by melting and Vaporization. So, the change in thermal properties plays a vital role for designing the modeling. The resulting temperature-dependency variation is shown by the temperature dependent co-efficient Cpγ in Figure 3. In this plot CP1 is the Specific heat at room temperature, CP2 is the average Specific heat applied in between ambient to melt temperature, and CP3 is the addition with the Specific heat of fusion. From the figure. it can be concluded that the variation of Specific heat (Cp3) is significant in the temperature range of 1500-5500 (K), where phase change occurs during this range of temperature. The Fourier heat conduction equation represented in Eq. (1) also varied non-linearly with respect to the amount of heat flux. Similarly the thermal conductivity also varies with respect to change in temperature and represented in Table 3. The significant change in thermal conductivity can be seen in between 1100K to 5500K.
A cylindrical 3D Continuum (Figure 2) has been considered for this study. In this study the heat flux q(R) has been applied up to spark radius R. For model III (Gaussian Model) beyond spark radius R convective heat transfer condition has been applied. Similarly for Boundary B2, B3 & B4 thermal insulated boundary condition has been applied for the three models. In this study the determination of Radius of plasma channel has been based on Ikai and Hashiguchi relation. This Plasma radius is also known as “Equivalent Radius”.
$R(t)=2.04\times {{I}^{0.43}}\times To{{n}^{0.44}}$ (6)
where, R (t) is equivalent Radius, I (A) is the Current and Ton (µS) is Pulse On time.
This transient heat transfer problem has been solved by using COMSOL 4.4 FEM software for the three models (model-I, model-II, and model-III). Different heat flux has been applied at the spark location. The thermal analysis with respect to the time has been performed to determine the temperature distribution profile with respect to different boundary condition. The thermal analysis of the work domain has been performed for a hexahedral element of second order with 20 numbers of nodes and 0.75 of mesh size. Figure 4 shows the meshed 3D work domain. Around 28500 number of element has been generated on instance. The nodes where the temperature is more than the melting point temperature of the work piece (for Al-A359 PMMC melting point is around 770˚C) has been eliminated for the determination of the MRR.
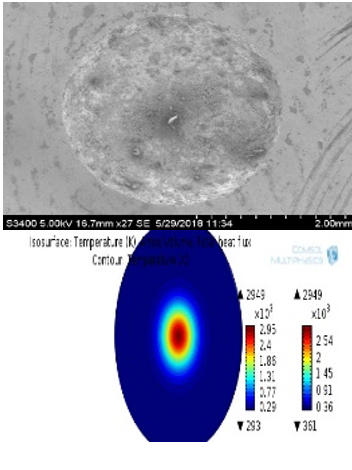
This analysis yields hemispherical/Bowl shape craters (Depending on different types of heat fluxes) after the application of different heat fluxes Figure 5 (a) and (b) is the produced crater during machining by EDM and the isothermal contour plot of the FEM analysis respectively. Figure 6 shows a typical crater shape (temperature contour) produced after simulation for single discharge EDM. For the analysis of the MRR & other output parameters the nodes (greater than melting point) has been eliminated and the generated crater cavity has been divided in to number of cylindrical disc. So now the total crater volume Cv (µm3) is given by:
Figure 4. Meshed model of work piece
${{C}_{v}}=\left\{ \frac{1}{6}\pi h\left( 3{{r}^{2}}+{{h}^{2}} \right) \right\}$ (7)
where the volume of the disc is given by Di
${{D}_{i}}=\pi {{\left( \frac{{{X}_{i}}+{{X}_{i}}+1}{2} \right)}^{2}}\left( {{Y}_{i+1}}-{{Y}_{i}} \right)$ (8)
Table 4. Comparison of crater geometry According to different heat sources (At I=8A, V=100V, Ton=40µS, & Fc=5 %)
|
Simulation Design Parameters |
|
Experimental Results (compared with model-III) |
Disk heat source Model-I |
Point Heat Source Model-II |
Gaussian heat source Model-III |
|
Crater Dimension(µm) |
Crater Radius |
22.48 |
26.56 |
11.34 |
23.44 |
|
Crater Depth |
19.17 |
12.23 |
15.61 |
22.32 |
|
|
Relative Prediction Error (%) |
Error in Radius |
4.09 |
15.7 |
15.4 |
11.10 |
|
Error in Depth |
12 |
14.21 |
15.56 |
10.21 |
In actual practice the MRR of the EDM Process depends on several factors like frequency of sparks, flushing efficiency, phase change of electrodes, random behavior of debris particles, etc. Due to the complex mechanism of EDM it is critical to estimate the exact numerical simulation. But by calculating the total crater volume Cv, the MRR (mm3/min) has been estimated by the following equation.
$MRR(m{{m}^{3}}/\min )=\frac{{{C}_{v}}*NOP}{{{T}_{mach}}}$ (9)
where, Cv=Crater Volume (mm3), NOP=Number of Pulse, Tmach=Machining time in minute
Figure 5. (a) Formation of crater taken by SEM
(b) Temperature Distribution at the end of Single spark EDM V=100V, I=6A, Ton=20 µs & Fc=0.05
4.1 Validation of FEM model
The validation of numerical results (Crater geometry) with the experimental results (Crater geometry) by considering Variable thermal properties has been summarized in Table 3. The relative error in percentage has been also summarized in the Table 3. The highest percentage of error recorded in between the experimental and predicted value of Crater depth is 12 %. It should be noted that the discrepancies in error between the observed and the predicted value of Crater dimension is due to the form of heat flux applied, i.e. Disk and Point heat source. It can be concluded that these two types of heat source do not signify a realistic approach with the observed experimental output parameters. But the Gaussian heat flux shows a close approximation of plasma creation phenomena with least error percentage of 11.10 and 10.21.
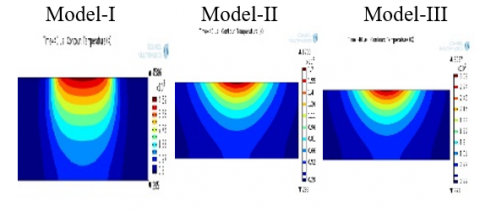
The obtained geometrical shape of three models has been shown in fig ure6. It can be clearly seen that in model-I the geometry of temperature contour looks like a disk shape whereas in model-II & III it looks like a hemispherical bowl. The obtained crater radius is more due to disk shape in comparison to model-II & III. In model-II the spark radius is very less in comparison to III due to the Point heat source.
From Table 3 it has been cleared that the Gaussian approach has a very similar mechanism with respect to the experimental data. Therefore further experiment has been carried out with the Gaussian heat flux with different sets of parameters. The Experimental results for three different Current and different Pulse On time by keeping other Parameter as Constant has been summarized in Table 4. The highest MRR with Gaussian approach has been recorded for 46.198 & 43.37µm as Crater Radius and Crater Depth respectively.
Figure 6. Temperature Profile for three heat source (Disk, Point and Gaussian heat source) at I-8A, Ton-40µS, V=100V and Fc=5 %, respectively
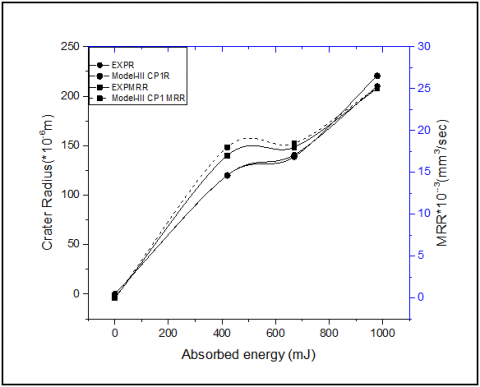
Figure 7. Comparison of MRR & Spark radius 'R' between Model-III & Experimental data
The reported experimental radius ‘R’ has been considered for the numerical analysis as spark radius (R). Figure 6 represents a comparison between the experimental and numerical results of Crater radius and MRR. It can be noted from the graphical analysis of that the predicted values of the MRR closer to the real experimental results for three different set of absorbed thermal energy.
Table 5. Comparison between FE simulation (with Gaussian heat sources) and Experimental Results
|
Expt.No. |
Discharge Parameter |
Crater Dimension (µm) |
Relative Error |
||||||
|
|
I (A) |
Ton (µS) |
Fc (%) |
FE Simulated Crater Depth |
FE Simulated Crater Radius |
Expt. Crater Depth |
Expt. Crater Radius |
Error in Radius (%) |
Error in Depth (%) |
|
1 |
6 |
20 |
20 |
17.35 |
25 |
17.52 |
27.83 |
10.2 |
8.6 |
|
2 |
8 |
40 |
20 |
26.31 |
23.42 |
22.32 |
23.44 |
8.8 |
7.13 |
|
3 |
10 |
60 |
20 |
45.72 |
46.14 |
43.37 |
46.19 |
7.21 |
7.71 |
In the previous section the results of the thermal analysis have been validated with the experimental analysis for the Al-A359 EDM Process. The geometrical shape of crater obtained from different heat source has been predicted by the amount of thermal energy applied to the work piece. To know the effect of input parameters (Specific heat, heat flux) in the thermal model parametric study has been performed in the following section.
Various parameters viz., MRR, crater cavity shape and size obtained from the thermal analysis of these models has been analyzed with respect to experiment results in the following segment. Also the realistic model has been chosen among all the three models and the comparison of MRR with Specific heat and without Specific heat has been presented below.
5.1 Evolution of temperature and crater formation
Figure 8 shows the evolution of the Crater at different instance of time by applying Gaussian heat source (At different set of input parameters). Considering the solution of Conduction equation it has been cleared that it indicates the time dependency of temperature at a fixed location in space.
2D tempreature Contour Plot of simulated Al-A359 PMMC work model
Figure 8. (a) At I-1A, V-100V, Ton-20µS (b) At I-2A, V-100V, Ton-20µS (c) At I-3A, V-100V, Ton-20µS
Model-I shows the evolution of temperature profile by applying the disk heat source. Similarly Model-II & III shows the temperature profile for Point heat source and Gaussian heat source. These three temperature profile has been obtained at I=1,2,3 A, Ton=20, 40, 60µS, and Fc=5 %. It can be seen, that the isothermal profiles are like quartile concentric circles starting from the discharge center towards the depth. From Model-I it can be observed the surface structure obtained after the discharge resemble like bowl shape with temperature rise of 4586K.Similarlry for point heat source and Gaussian heat, the temperature rise shows up to 1700K & 3027K respectively. Meanwhile it can be concluded that the molten boundary, obtained by eliminating all the elements whose temperatures exceeded the melting point of Aluminum PMMC) i.e. 866K, spreads only to a small volume of material.
5.2 Crater geometry and erosion rate
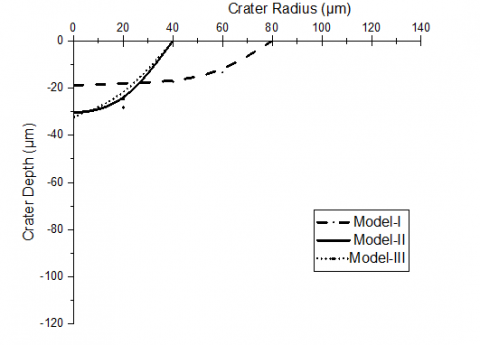
Figure 9 represents the variation of crater along the depth and radius of the work piece at 100V, 10 A, and 40µs pulse-on-time for three different models. The graph shows various shapes of crater profile obtained for different model. Model-I shows a flat bowl shape crater with 80 (µm) crater radius & 20 (µm) Crater depth (in Z Direction refer to Figure 2). Model-II & III reflects perfect hemispherical crater cavity with same crater radius i.e. 40 µm. The differences of crater shape these models are only due to the different types of heat sources. From Figure 8, it has been concluded that a disk type of heat source is uniform in nature creating a large ratio of crater diameter to crater depth. In contrast, a point heat source & Gaussian heat source transfers the heat uniformly distributes in the radial direction, resulting in a hemi-spherical shape of crater. Based on the presented results, model-III is shown to be the most appropriate model to provide the initial approximation of the real conventional EDM process as it involves a uniform heat flux with proper convective boundary condition.
Figure 9. Crater depth w.r.t crater radius at V=100 V, I = 10 A, Fc=0.05, Ton=30µs
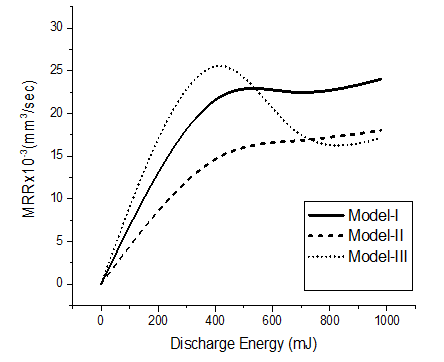
Figure 10. Variation in MRR with respect to discharge energy
Figure 10 represents the variation of MRR w.r.t the Discharge Energy. For model-I, II, III, the MRR increases then remains constant for high discharge energy. Model-III exhibit highest MRR then model-I & II. This is due to the Gaussian nature of crater formation similar to the experimental crater geometry.
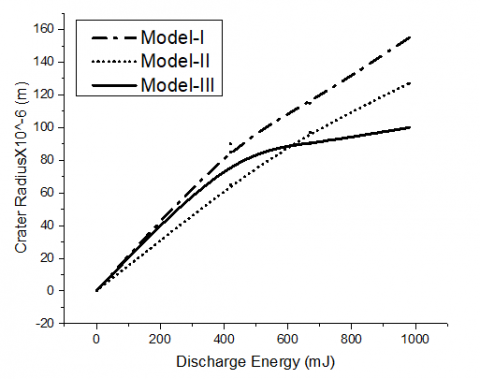
Figure 11. Variation of carter radius w.r.t discharge energy
In Figure 11 the variation of crater radius with respect to Discharge energy has been presented. From the figure it can be concluded that Model –II and III shows a highest Crater radius due to the heat flux nature (Point heat source and Gaussian heat source). At high discharge energy the rate of increase in crater radius reduces. Model-III gives a crater radius ratio of 1–1.1 which represent MRR ratio of 0.99–1.1 at a fixed set of parameters.
5.3 Effect of peak current and pulse-on time on crater geometry
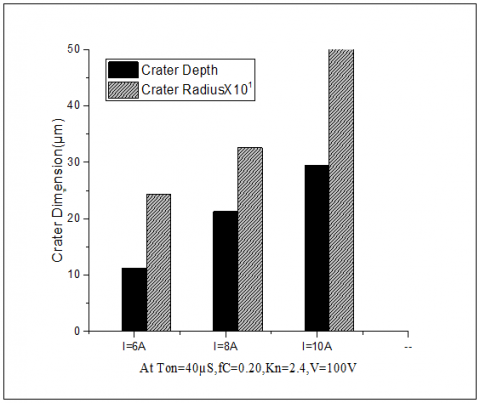
Figure 12 (a) and (b) shows the variation of crater geometry at different current (By keeping all other parameter as constant). It can be concluded from Figure 12 that, both the Crater radius and depth get larger values varying from 21.5 to 49 µm and 12.5 to 29 µm, respectively. This is due to the high levels of discharge energies released during sparking when discharge current increases from 6 to 10 A. However, it is remarkable to note that the ratio of the developed crater depth to radius increases from 0.83 to 0.89. It implies that the crater depth grows at a higher rate than that of crater radius indicating that the melting border advances into the workpiece as a result of high discharge current to avoid re-solidification of molten material.
(a)
(b)
Figure 12. (a) Effect of current on crater depth and radius (b) Effects of crater geometry w.r.t pulse on time
5.4 Influence of heat flux
The type of heat flux is an important parameter which affects directly all other output parameters of the EDM process. In the present study (Figure 13) a comparative analysis of three important heat flux viz. point heat source (F1), disk heat source (F2), and a Gaussian heat source (F3) has been presented. For this analysis of model variations, the Specific heat factor is directly proportional to the Latent heat for these models (using the temperature-dependent behavior of Specific heat (CP3)). The results of the heat flux distribution variations are already shown in Figure 7. It has been cleared from the figure that the three thermal models applied the same amount of heat source at an instance. From the analysis it has been cleared that Model-II & III have a similar MRR performance. Regarding the crater radius variable, the results have a similar behavior as the MRR, i.e., the heat sources F3 and F1 have similar crater radius values.
Figure 13. Comparison between the experimental and numerical models for various heat sources (F1, F2 & F3) with CP3 (Specific heat with temperature dependency)
5.5 Influence of specific heat on gaussian heat source
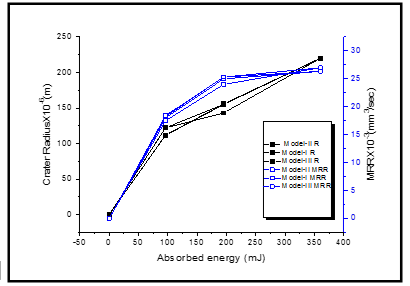
From the above analysis we found mode-III is the perfect model for analyzing the EDM process so the influence of Specific heat has been analyzed by taking only the Gaussian heat source. In Figure 14 the right and left side Y axis represent the MRR and crater radius respectively and X axis shows the absorbed thermal energy. It is observed that the model-III with CP1 with shows a close agreement with the Experimental solution of R & MRR. The Model-III with CP3 shows an overestimated value of crater radius by up to 10 % for the higher energy level. However, for the lower absorbed energy level, the predicted crater radius coincides with the reported experimental radius. The results also indicate that the MRR values at lower energy level for CP1 is higher than the value of the numerical model-III with CP2 and CP3, but it again rises more than CP1 for higher energy. This can be expected since model-III (with CP1) ignores the effect of Specific heat and therefore requires less heat to melt the material. The relevant effect of Specific heat has been clearly identified by the differences between CP2 & CP3. The efficiency of the EDM getting reduced by absorbing too much heat in solid state & the overheating phase by adding Specific heat. The numerical results show the influence of variations of the implemented Specific heat (CP1, CP2 and CP3) on model-III in Figure 14.
Figure 14. Comparison between the experimental and numerical value for MRR and crater radius with absorbed energy
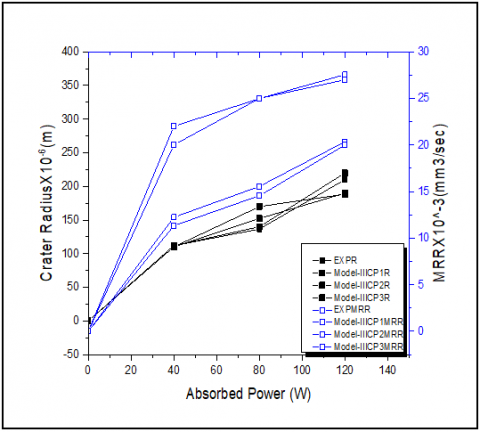
Figure 15. Comparison between the experimental and numerical results for MRR and crater radius with the absorbed discharge power (or heat power), respectively
Figure 15 shows a comparison between the MRR and crater radius w.r.t absorbed Power into the work piece surface. It shows a linear relationship among the model –III with varying Specific heat & Experimental results of R & MRR. Model-III with CP1 shows a good agreement with the experimental results whereas mode-III with CP3 shows a highly overestimated values for overall power range. The numerical results show the influence of variations of the implemented Specific heat (CP1, CP2, and CP3) on Model-III.
In this research an attempt has been made to design a comprehensive thermal model of Al-A-359 PMMC machining by EDM. To analyze the effect of various heat sources with and without considering the Specific heat on the Material removal rate a transient 3D work domain has been developed. The Finite element models have been validated with experimental data of EDM Process. All the output parameters of the machining process have been successfully analyzed and validated by the experimental results. From the numerical analysis it can be clearly seen that the Gaussian heat distribution shows a good agreement with the realistic observed data. In short we can conclude that the boundary condition taken for model-III with all assumption has a good simulation strategy and accuracy. The following points are some of the findings of the present study.
The difference in the geometrical shape of crater has been shown by applying three different heat sources (Disk, Point, and Gaussian).
By adding variable specific energy along with the thermal conductivity the error between the numerical model MRR and experimental MRR has been decreases. It reduces the errors from 23.3 % to 18.1 % and 19.6 % to 14.1 % for predicting crater radius and depth, respectively.
At 250mJ absorbed energy the three models (Disk, Point and Gaussian) exhibit approximately same Material removal rate.
The model with Gaussian heat flux represents much better predictive accuracy compared with disk and point heat sources. It has a maximum verification error of 11 % whereas the disk heat source possesses 14 % and the point heat source 15 %.
The geometric shape of crater has a good resemblance with the crater shapre created after eliminating the nodes in Gaussian heat flux model (Model-III).
The Material removal rate for machining Al-A359 PMMC increases by increasing the current and Pulse-On time.
Lastly, we would like to thanks IMMT Scientist who helped a lot in fabrication of Al PMMC by Powder metallurgy Process and the Advance machining Lab assistant for conducting the experiments by EDM.
[1] Zhang Y, Liu Y, Shen Y, Li Z, Ji R, Wang F. (2013). A new method of investigation the characteristic of the heat flux of EDM plasma. Procedia CIRP 6: 450–455. https://doi.org/10.1016/j.procir.2013.03.086
[2] Sidhu SS, Batish A, Kumar S. (2014). Study of surface properties in particulate-reinforced metal matrix composites (MMCs) using powder-mixed electrical discharge machining (EDM). Materials and Manufacturing Processes 29: 46–52. https://doi.org/10.1080/10426914.2013.852211
[3] Aravindan, Rao PV, Ramkumar PK, Gupta SJM. (2010). The effect of process parameters on machining of magnesium nano alumina composites through EDM. International Journal of Advanced Manufacturing Technology 46: 1035–1042. https://doi.org/10.1007/s00170-009-2158-9
[4] Vishwakarma UK, Dvivedi A, Kumar P. (2013). Finite element modeling of material rem oval rate in powder mixed electric discharge machining of al-sic metal matrix composites. Materials Processing Fundamentals 151-158. https://doi.org/10.1007/978-3-319-48197-5_17
[5] Singh DK, Jayswal SC. (2016). Thermo physical modeling of powder mixed EDM using ANSYS10.0. International Journal for Scientific Research & Development 3(12): 2321-0613.
[6] Puhan D, Mahapatra SS, Sahu J, Das L. (2013). A hybrid approach for multi-response optimization of non-conventional machining on AlSiCp. MMC, Measurement 46(9): 3581-3592. https://doi.org/10.1016/j.measurement.2013.06.007
[7] Talla G, Sahoo DK, Gangopadhyay S, Biswas CK. (2015). Modeling and multi-objective optimization of powder mixed electric discharge machining process of aluminum/alumina metal matrix composite. Engineering Science and Technology an International Journal 18(3): 369-373. 369e373. https://doi.org/10.1016/j.jestch.2015.01.007
[8] Hoang KT, Gopalan SK, Yang SH. (2015). Study of energy distribution to electrodes in a micro-EDM process by utilizing the electro-thermal model of single discharges. Journal of Mechanical Science and Technology 29(1): 349–356. https://doi.org/10.1007/s12206-014-1241-9
[9] DiBitonto DD, Patel MR, Barrufet MA, Eubank PT. (1989). Theoretical models of the electrical discharge machining process. I. A simple cathode erosion model. Journal of Applied PhyGraphite Flakes 66(9): 4095–4103. https://doi.org/10.1063/1.343994
[10] Dijck FS, Dutre WL. (1974). Heat conduction model for the calculation of the volume of molten metal in electric discharges. Journal of Physics D Applied Physics 7(6): 899. https://doi.org/10.1088/0022-3727/7/6/316
[11] Snoeys R, Dijck F. (1971). Investigation of electro discharge machining operations by means of thermo-mathematical model. CIRP Annal 20(1): 35-37.
[12] Beck JV. (1981). Transient temperatures in a semi-infinite cylinder heated by a disk heat source. International Journal of Heat & Mass Transfer 24(10): 1631-1640. https://doi.org/10.1016/0017-9310(81)90071-5
[13] Jilani ST, Pandey P. (1982). Analysis and modeling of EDM parameters. Precisions Engineering 4(4): 215–221. https://doi.org/10.1016/0141-6359(82)90011-3
[14] Joshi S, Pande S. (2010). Thermo-phyGraphite Flakesal modeling of die-sinking EDM process. Journal of Manufacturing Process 12(1): 45–56. https://doi.org/10.1016/j.jmapro.2010.02.001
[15] Salonitis K. (2009). Thermal modeling of the material removal rate and surface roughness for die-sinking EDM. International Journal of Advance Manufacturing Technology 40(3-4): 316–323. https://doi.org/10.1007/s00170-007-1327-y
[16] Kansal HK, Singh S, Kumar P. (2008). Numerical simulation of powder mixed electric discharge machining (EDM) using finite element method. Mathematical and Computer Modelling 47: 1217–1237. https://doi.org/10.1016/j.mcm.2007.05.016
[17] Al-Khazraji A, Ali AS, Mahmood S. (2016). The effect of graphite flakes powder mixing electrical discharge machining on white layer thickness, heat flux and fatigue life of AISI D2 die steel. Engineering Science and Technology, an International Journal 19(3): 1400-1415. https://doi.org/10.1016/j.jestch.2016.01.014
[18] Tan PC, Yeo SH. (2013). Simulation of surface integrity for nanopowder-mixed dielectric in micro electrical discharge machining. Mettalurgical & Material Transactions B 44(3): 711-721. https://doi.org/10.1007/s11663-013-9819-7
[19] Vipin V, Kuriachen B, Manu R, Mathew J. (2014). Experimental and finite element based investigations on powder mixed micro-electrical discharge machining of Ti-6Al-4V alloy. 5th International & 26th All India Manufacturing Technology, Design and Research Conference (AIMTDR 2014) IIT Guwahati, Assam, India334-1
[20] Escobar AM, Lange DF, Medellin CHI. (2016) Comparative analysis & evaluation of thermal models of electro discharge machining. International Journal of Advance Manufacturing Technology 89(1-4): 743-754. https://doi.org/10.1007/s00170-016-9125-z