Nazanin Tataei Sarshar* | Mehdi Abdossalehi
© 2021 IIETA. This article is published by IIETA and is licensed under the CC BY 4.0 license (http://creativecommons.org/licenses/by/4.0/).
OPEN ACCESS
Today, cardiovascular disease has become an epidemic. Statistics show that one person dies every 33 seconds due to cardiovascular disease. It is estimated that 33% of men and 10% of women have a heart attack before the age of 60. Arrhythmias are abnormal beats that cause the heart to beat too fast or too slow to pump. Automatic electrocardiogram analysis is critical to the diagnosis and treatment of heart patients. There are several learning methods for analyzing ECG signals to diagnose arrhythmias. In the proposed method, the heart rate signals are decomposed into different sub bands using the Tunable Q-Factor Wavelet Transform (TQWT) method, then the features are extracted and modified using classification with the aim of better classifying and separating data in the process of identifying the clinical features of the class. They are classified so that normal people and people with cardiac arrhythmias can be distinguished from their ECG signals. The results showed that the proposed method classifies the ECG signal with 99.25% accuracy. Since accuracy in diagnosing cardiac arrhythmias in medicine is a vital and important factor, so the proposed method can be very effective for the decision of cardiologists.
electrocardiogram analysis, ECG signals, disease, diagnose, heart patients
As the heart feeds through the heart, an electrical current travel from the heart to the surrounding tissues that surround the heart and a small portion of this current travels throughout the body. Whenever electrodes are placed on the skin of the body on opposite sides of the heart, the difference in electrical potential generated by this current can be recorded. The resulting curve is called an electrocardiogram (ECG). In recent years, ECG visual analysis is the most common non-invasive method of assessing health or congestive heart disease [1].
In recent years, the idea of diagnosing and classifying different heart diseases is based on software analysis of the signal. Cardiac arrhythmia is one of the most common heart diseases [2]. Cardiac arrhythmias are the leading cause of death after Acquired Immunodeficiency Syndrome (AIDS), with millions of people dying each year worldwide. This increase in mortality rates due to heart disease in the modern world is due to epidemiological changes, obesity, Mellitus, smoking, and other lifestyle changes [3]. Some causes of death in heart patients are misdiagnosis or incorrect treatment or lack of access to appropriate treatment. It should be noted that for young people in the first years of their lives, it affects thirty or forty old years of them. There seems to be a worrying situation in the fruitful years of people's lives [4].
Cardiac arrhythmias often occur in people with heart disease such as hypertension, coronary heart disease, and cardiomyopathy. These cases occur due to a violation in the formation of the heartbeat or the conduction of the heartbeat or due to both of these cases. In cardiac arrhythmia or irregular heartbeat, the activity of the heart is irregular or faster, or slower than usual. Heart rate is very fast (more than 100 beats per minute) or very slow (less than 60 beats per minute) and may be regular or irregular. In other words, cardiac arrhythmia is a term for a condition of the heart states that results in abnormal electrical activity in the heart [5]. Theretofore, several studies have been presented to determine the characteristics of ECG signals and classify cardiac arrhythmias using ECG signal decomposition that is not accurate enough or has high computational complexity [6-8].
This paper will be using a way robust method based on Tunable-Q Wavelet Transform and Resonance-based Signal decomposition (TQWT) to diagnose arrhythmia. With Compared to other similar methods and considering the ability of the TQWT [9], this approach in studied models to diagnose the heart disease and abnormalities in Segmentation, positioning, reconstruction, and thus classification according to murmurs overlap, reducing complexity Computations in smaller specificity dimensions, To provide a model for automatic diagnosis of cardiac arrhythmia, an approach is presented based on the adjustable Q-wavelet transform method nonlinearly in the time-frequency domain. In the proposed model, the heart rate signals are decomposed into different sub-bands using the TQWT method, then the extracted and modified features are categorized using classification with the aim of better classifying and disseminating data in the process of diagnosing clinical features. To be able to distinguish normal people and people with cardiac arrhythmias from their cardiac ECG signal.
The structure of this article is as follows: The second part describes the work related to cardiac arrhythmia. In the third section, the proposed method will be fully described. The fourth part of the experiments and in the fifth part will be presented conclusions.
A classification algorithm was proposed based on the features extracted from discrete wavelet transform (DWT) using ECG signals. Each ECG signal was decomposed using multilevel wavelet decomposition [10]. Then, approximate and details coefficients were calculated for each level. Signal energy distributions along the DWT surface were used to compare different ECG signals. Four key features were used in the classification algorithm in which were classified four anomalies. After testing the classification algorithm developed the accuracy of the algorithm was more than 95% for the detection of each of the five classes. Finally, it was found that this method could be developed for several other arrhythmia classes.
In another method, Empirical Mode Decomposition (EMD) was used to classify cardiac arrhythmia patients [11], which consists of is four stages: preprocessing, empirical mode decomposition, feature extraction, and classification. Six types of arrhythmias were used to isolate normal and arrhythmic signals obtained from the MIT-BIH arrhythmia database. These cases include normal (N), right soft bundle branch block (RBBB), premature ventricular contraction (PVC), premature atrial fibrillation (APB), and left bundle branch block (LBBB) signals. Three different classifiers were used to classify ECG signals. As a result of this method, using a linear resolution analysis classifier (LDA) to detect normal and arrhythmic signals Was obtained with 87% accuracy.
An automated ECG classification method was proposed based on continuous wavelet transform (CWT) and convolutional neural network (CNN) [12]. CWT was used to decompose ECG signals to obtain different time-frequency components and CNN was used to extract the features of the above time-frequency bands. In this work, considering the surrounding peak distance R, also called the RR distance, is useful for detecting arrhythmias. Four RR distance features are extracted and combined with CNN features to form a fully connected layer for the ECG classification. This way, tested in the MIT-BIH arrhythmia database, which achieves 70.75%, 67.47%, 68.76%, and 98.74% for positive prediction and sensitivity, F1 score, and accuracy, respectively.
In another way, a new algorithm was proposed using DWT-based and VMD features [13]. First, DWT was applied to the ECG signal to Be decomposed to level 8. Then, at each level, the VMD algorithm was used to derive a set of 15-time frequency features. then, calculated features were used to identify and classify VT, VF, accurately, and normal rhythm. This feature set was obtained with estimated data from the CUDB and VFDB databases that were validated from the Physio Net database. The proposed algorithm achieved 99.13% accuracy in the CVR classification and 93.88% in SVM classification.
The cardiac arrhythmia classification was presented based on discrete wavelet transform (DWT) [14]. After, ECG signal preprocessing, the Independent Component Analysis (ICA) was considered to reduce the dimensions and feature extraction process and the Perceptron Multilayer Neural Network (MLP) for classification. Also, this study was used the MIT-BIH physiotherapy arrhythmia database, which was used for the training process and the MLP-based classification testing process. The simulation results showed that the classification accuracy of the proposed algorithm using the k-fold10 model was obtained 96.50%. that including normal strokes, premature atrial strokes, and ventricular strokes.
Another approach suggested classifying the cardiac arrhythmias [15] deep learning way, which automatically identified convolutional neural networks (CNNs) and short-term memory networks (LSTMs) to detect six types of ECG signals. The proposed grid of multi-input structure for processing 10 signals of the ECG signal segmentation and the corresponding RR distance from the MIT-BIH arrhythmia database includes sections of normal sinus rhythm (N), atrial fibrillation (AFIB), ventricular biceps (B), walking rhythm (P), atrial flutter (AFL) and sinus bradycardia (SBR). The network achieved 99.32% accuracy with the k-fold10 validation model.
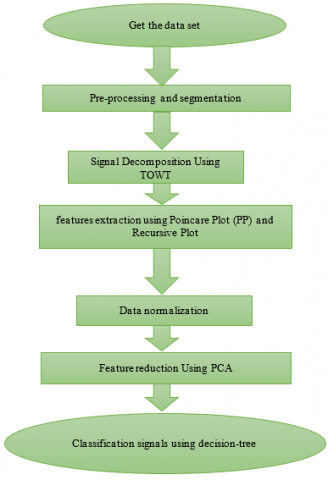
The proposed method, like the process of machine learning algorithms, includes three stages of preprocessing and segmentation, decomposition by TQWT on Tunable-Q wavelet transform, and feature reduction and classification, as shown in Figure 1.
Figure 1. Proposed method
3.1 Pre-processing
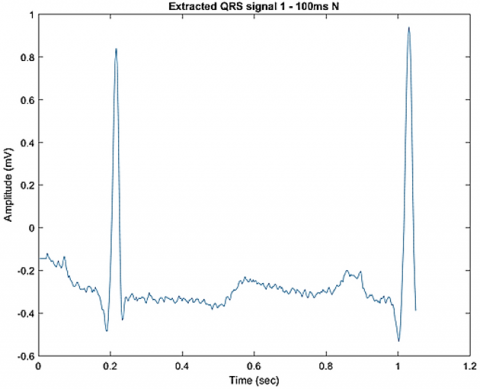
An electrocardiograph is a plot of the recorded changes in the electrical potential caused using stimulation of the heart muscle, that usually abbreviated to ECG (electrocardiogram (ECG) or EKG. Therefore, in the preprocessing section, the collected dataset including normal and abnormal data has been used to categorize individuals. The recorded HRV signals were obtained from the physio next site. Now, 70% of these signals are considered as training data and 30% as test data. It should be noted that first the RR-Interval is extracted by each individual and then the signals are segmented into 2000 samples. Figure 2 shows the QRS extraction method for 1.2 seconds.
Figure 2. Pre-processing cardiac arrhythmia signal
3.2 Signal decomposition using TQWT
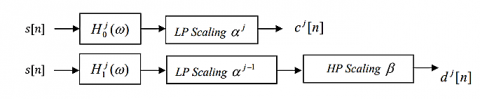
In this section, the signals are decomposed into six components before feature extraction. Therefore, before addressing the extracted features, the TQWT method is presented. Ideally, the Q-factor of the wavelet transform should be adjusted, according to the signal oscillation behavior used in the selected section. For example, when we are using wavelets (violets) to analyze and process oscillating signals (speech, EEG, etc.). The wavelet transform should have a relatively high Q coefficient. On the other hand, when processing signals without oscillating behavior or with low oscillating behavior (such as a scanned line of a photographic image), the wavelet transform must have a low Q coefficient. However, except for continuous wavelet transform, most wavelet transformers offer little ability to adjust the Q factor. Dual wavelet transform has a low Q coefficient and is suitable for non-oscillating fragmentary-soft linear signals. Adjustable Q Wavelet Transform (TQWT) is a flexible discrete wavelet transform in which the amount of over-or over-sampling is expressed as R and the number of decomposition levels denoted by j. Implementation is obtained from the first level based on TQWT analysis of two repeatedly low-pass filter banks. In the first level, it uses the Ho[w] low-pass filter to generate the Cl[n] low-pass sub-band. This low-pass filter is followed by a low-pass scale indicated by the LP scale, α. Similarly, it uses Hl(w) and the HP scale, β, to produce the translucent sub-band dl[n]. The equation system of the j-level is based on the TQWT decomposition of the input signal denoted by s [n], which is used to generate the underpass cj[n]and the underpass dj[n]. Figure 3 shows an example of signal analysis by TQWT.
After the j decomposition level, the frequency response of the low-pass and high-pass signal equations is shown by Eqns. (1) and (2).
$\mathrm{H}_{0}^{(\mathrm{j})}(\mathrm{w})=\left\{\begin{array}{l}\prod_{\mathrm{m}=0}^{\mathrm{j}-1} \mathrm{H}_{0}\left(\frac{\mathrm{w}}{\alpha^{\mathrm{m}}},|w|\right) \leq \alpha^{j} \pi \\ \quad 0 . \alpha^{j} \pi<|w| \leq \pi\end{array}\right.$ (1)
$\mathrm{H}_{1}^{(\mathrm{j})}(\mathrm{w})=\left\{\begin{array}{c}\mathrm{H}_{1}\left(\frac{\mathrm{w}}{\alpha^{j-1}}\right),|\mathrm{w}| \prod_{\mathrm{m}=0}^{\mathrm{j}-1} \mathrm{H}_{0}\left(\frac{\mathrm{w}}{\alpha^{\mathrm{m}}},\right) 1-\beta\left(\alpha^{\mathrm{j}-1} \pi|\mathrm{w}|\right) \leq \alpha^{\mathrm{j}-1} \pi \\ 0 . \text { for other } \mathrm{w} \in[-\pi, \pi]\end{array}\right.$ (2)
Figure 3. Decomposition of the input signal into two sub-bands, low-pass, and high-pass
In the above relations, $\mathrm{H}_{0}^{(\mathrm{j})}(\mathrm{w})$ is the same as the bottom layer and $\mathrm{H}_{1}^{(\mathrm{j})}(\mathrm{w})$ is the same the layer is transient. The original signal can be reconstructed using the synthesis filter banks shown. Redundancy and factor Q are related to bank filter parameters in the form of relations (3) and (4):
$r=\frac{\beta}{1-\alpha}$ (3)
$Q=\frac{2-\beta}{\beta}$ (4)
The Q parameter controls the oscillating behavior of the wavelet. The r parameter controls the ringing phenomenon in the wavelet time domain.
In the proposed method, the signals of normal people and people with the disease are analyzed in six levels.
3.3 Extract features using Poincare Plot (PP) and recursive plot
It is a powerful way to show the graphical relationship of a signal to its modified version. This method is based on nonlinear dynamics and provides useful information about short-term or long-term changes of a signal. The equations required to calculate PP are as follows:
$\mathrm{d}_{1, \mathrm{i}}=\frac{1}{\sqrt{2}}|\mathrm{X}(\mathrm{i})-\mathrm{X}(\mathrm{i}+1)|, \mathrm{i}=1,2,3, \ldots \mathrm{N}-1$ (5)
$\mathrm{SD} 1=\sqrt{\mathrm{vard}_{1, \mathrm{i}}}$ (6)
$\mathrm{d}_{1, \mathrm{i}}=\frac{1}{\sqrt{2}}|\mathrm{X}(\mathrm{i})-\mathrm{X}(\mathrm{i}+1)-2 \widehat{\mathrm{X}}|$ (7)
$\mathrm{SD} 2=\sqrt{\operatorname{vard}_{2, i}}$ (8)
Ratio $_{\mathrm{SD} 1 / \mathrm{SD} 2}=\mathrm{SD} 1 / \mathrm{SD} 2$ (9)
An iterative diagram is another measure of signal irregularity. To obtain this criterion, X(i) is computed as follows [18]:
$X(\mathrm{i})=\{\mathrm{u}(\mathrm{i}), \mathrm{u}(\mathrm{i}+\tau), \ldots \mathrm{u}(\mathrm{i}+(\mathrm{m}+1) \tau\}$ (10)
In the above relation, i = 1, N- (m-1) τ and m latent dimensions, τ latent delay. Now Euclidean distance is obtained from relation (11):
$d(\mathrm{X}(\mathrm{j}), \mathrm{X}(\mathrm{j}))=\sqrt{\sum_{\mathrm{L}=1}^{\mathrm{N-}-\mathrm{m}-1) \tau}\left(\mathrm{u}_{\mathrm{j}}(\mathrm{L})-\mathrm{u}_{\mathrm{i}}(\mathrm{L})\right)^{2}}$ (11)
The return plot is a symmetric matrix with dimensions i=1,…N-(m-1) $\tau \times \mathrm{i}=1, \ldots \mathrm{N}-(\mathrm{m}-1) \tau$. Also includes elements of zero and one as a relation (12):
$R \mathrm{P}(\mathrm{i}, \mathrm{j})=\left\{\begin{array}{c}1 \mathrm{~d}(\mathrm{X}(\mathrm{j}), \mathrm{X}(\mathrm{i})) \leq \mathrm{r} \\ 0 \text { otherwise }\end{array}\right.$ (12)
In the above relation r is the threshold value s which is considered 0.2. The rate of return is written as relation (13):
$R E C=\frac{1}{\mathrm{~N}-(\mathrm{m}-1)} \sum_{\mathrm{i}=1}^{\mathrm{N}-(\mathrm{m}-1) \mathrm{N}-(\mathrm{m}-1)} \sum_{j=1}^{1)} \mathrm{RP}_{\mathrm{i}, \mathrm{j}}$ (13)
In addition to nonlinear properties, other properties such as range, variance, mean deviation, and Shannon entropy are used [16, 17].
3.4 Features normalization
In the proposed method, since different and large values in the feature extraction stage may affect the classification accuracy, the data normalization is used to level the features:
$\hat{x}=\frac{x_{i}-x_{\min }}{x_{\max }-x_{\min }}$ (14)
In the above relation, $\hat{x}$ represents the new value and $x_{i}$ represents the initial value of the property, and $x_{\min }$ and $x_{\max }$ are considered the smallest and largest values [18].
3.5 Reduce features using PCA
The Principal Component Analysis method does this based on determining the principal components or (Principal Components) in the data. The principal components are the specific vector of the data covariance matrix. The largest variance of the data is in the direction in which the eigenvector corresponding to the largest eigenvalue is located. Similarly, the smaller the eigenvalue, the smaller the variance of the data in the direction of the corresponding eigenvector, which in the proposed method is used to reduce the dimensions [19].
3.6 Classification using decision-tree
Decision trees are powerful yet popular tools for both categorization and prediction. The appeal of tree-based methods lies above all in the fact that decision trees represent rules that can easily be translated into English or any other language so that they can be understood by everyone. The decision tree is also used to examine the data to better understand the relationships between a large number of candidate input variables for a target variable. A decision tree is a structure used to divide a large set of collected data into smaller chains of data, based on a series of simple decision rules. In each successive classification, the members of the resulting sets become more and more similar to each other. A decision tree model consists of a set of rules for dividing a large heterogeneous population into smaller and more homogeneous groups based on a specific objective variable.
In the proposed method, we use the ECG signal dataset available in the MIT-BIH database. The signals of healthy individuals and four types of arrhythmias including APB, PVC, LBBB, and RBBB were selected for classification, which is well shown in Table 1 and taken from the website https://www.physionet.org/physiobank/database/mitdb.
Meanwhile, MATLAB version 2019 and 12 GB RAM and Windows 10 operating system have been used to run the simulation. also, Accuracy, Sensitivity, and Specificity criteria were used to evaluate the proposed method.
Table 1. Compare different classifiers
|
Specificity |
Sensitivity |
Accuracy |
Classifiers |
|
96.22% |
95.14% |
95.07% |
Multi SVM |
|
96.41% |
95.35% |
94.95% |
KNN |
|
94.10% |
94.88% |
93.18% |
naive Bayes |
|
98.25% |
97.24% |
98.00% |
Random forest |
|
99.32% |
99.12% |
99.25% |
decision tree(DT) |
4.1 Pre-processing and segmentation
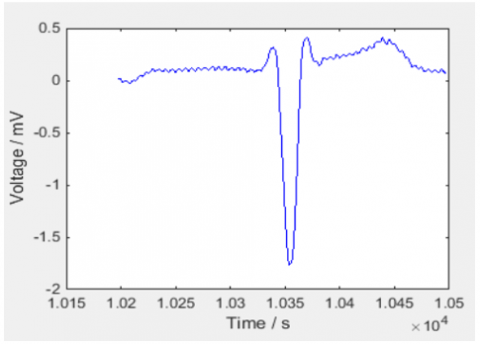
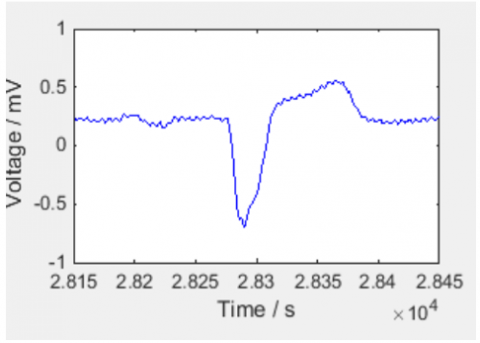
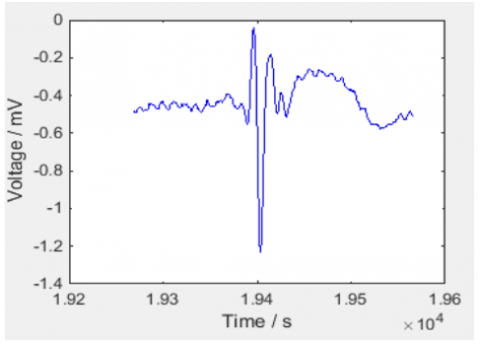
In this section, an example of the different signals of the arrhythmia and normal classes is shown in Figure 4.
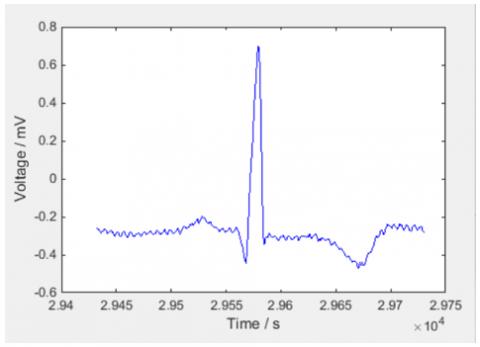
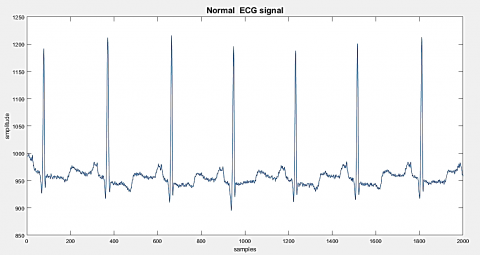
Now, Figure 5 is shown an example of a signal with a sampling rate of 2000 to the normal type.
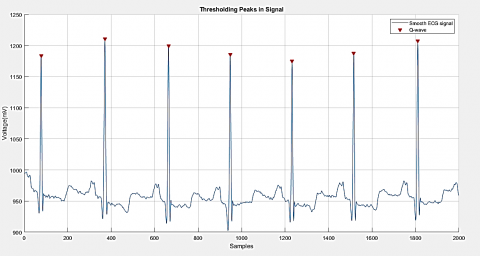
Also, Figure 6 shows an example of normal signals on which have been performed preprocessing and segmentation.
As shown in Figure 6, after receiving the signal, and applying noise to the signal, the signal is filtered and can be seen by the threshold signal of its Q points. The results of using intermediate filters in the preprocessing stages of ECG signals to attenuate the input noise show that the noisy input signal is very close to the original signal.
a
b
c
d
e
Figure 4. Heartbeat. a) normal beat b) APC beat c) LBBB beat d) RBBB beat e) PVC beat
Figure 5. Normal ECG signal
a
b
Figure 6. Pre-processing normal ECG signal a) Filtered noisy ECG signal ECG signal b) Thresholding peaks in normal ECG signal
4.2 Decomposition using TQWT
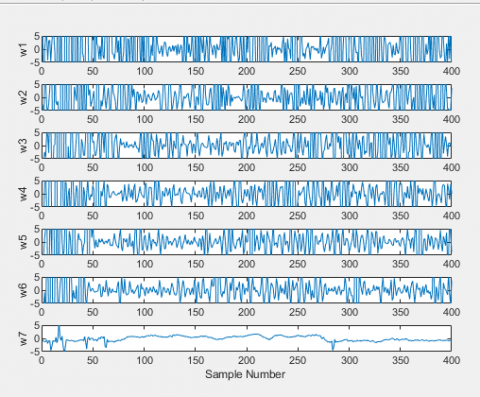
In this section, the results of the normal signal analysis are shown using TQWT decomposition at six levels in Figure 7.
As can be seen in Figure 7, the normal and abnormal signals for both types are decomposed into six levels. The coefficient Q and r for this type of analysis are 3 and 4, respectively. As mentioned, ideally, the Q-factor of the wavelet transform should be adjusted in the selected section according to the oscillation behavior of the signal used. For example, when wavelets are used to analyze and process oscillating signals (speech, EEG, etc.), the wavelet transform must have a relatively high Q coefficient. On the other hand, when processing signals without oscillating behavior or with low oscillating behavior, the wavelet transform should have a low Q coefficient. The dual wavelet transform has a low Q coefficient and is suitable for soft, nonlinear signals. For this reason, in this method, the value of Q is considered in case 3. The other parameter mentioned in this section, i.e. r, the higher it is, the more it compresses the signal, and the less it causes the opening and expansion. After reviewing the experiments, a value of 3 was considered for it.
Figure 7. Decomposition Using TQWT
4.3 Decomposition using TQWT
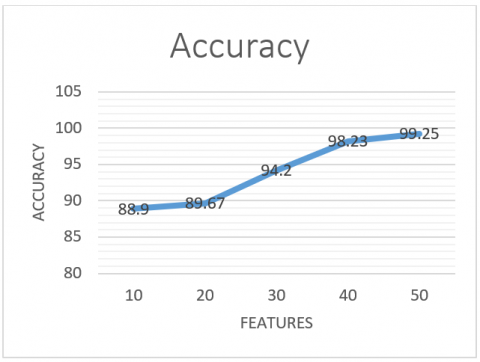
Given that reducing the feature may lead to a decrease in classification accuracy by extracting a very large feature, so in Figure 8, the decision the Check the accuracy process is considered concerning the reduction in six levels.
Figure 8. Redact features using PCA
4.4 Classify and compare the proposed method with other methods
In this section, first, the accuracy, diagnosis, and sensitivity are examined using different classifications in Table 1, and then the proposed method is compared with other methods in Table 2 and Figure 9.
In the following, the proposed method is compared with other methods available in the reference [20-24].
As shown in Figure 9 and Table 2, the superiority of the proposed method can be seen in all four methods. Therefore, in the proposed method, the use of 70% of the data as training data and 30% of the data as test data compared to other methods is observed. However, the method Huang et al. [24] is in the second category, method Ramkumar et al. [21], a method Raju [23], and İzci et al. [22] are in the next categories.
Figure 9. Compare of different of methods
Table 2. Compare of different methods
|
Accuracy |
Methods |
|
96.50% |
[21] |
|
87.00% |
[22] |
|
96.14% |
[23] |
|
98.79% |
[24] |
|
99.25% |
Proposed Method |
In the proposed method, the HRV signal extracted from the ECG signal was analyzed to classify cardiac arrhythmia signals and normal signals. Signal decomposition was estimated using an adjustable Q wavelet transform (TQWT) into a series of sub-bands and values were calculated from different sub-bands. Then the entropy criterion based on quality factor (Q) was proposed to calculate the entropy of the ECG signal in different frequency bands. The extracted features were classified by DT, KNN, and SVM classification methods. A review showed that the proposed method performs better than other methods in terms of quality criteria. It was also quantitatively 99.25 compared to other methods, which shows the strong performance of this method. In future work, we will test this method on larger and more real data sets.
[1] Jha, C.K., Kolekar, M.H. (2020). Cardiac arrhythmia classification using tunable Q-wavelet transform based features and support vector machine classifier. Biomedical Signal Processing and Control, 59: 101875. https://doi.org/10.1016/j.bspc.2020.101875
[2] Anwar, S.M., Gul, M., Majid, M., Alnowami, M. (2018). Arrhythmia classification of ECG signals using hybrid features. Computational and Mathematical Methods in Medicine, pp. 1-9. https://doi.org/10.1155/2018/1380348
[3] Yin, L., Chen, F., Zhang, Q., Ma, X. (2019). Arrhythmia classification based on multi-domain feature extraction. Journal of Physics: Conference Series, 1237(2): 022062. https://doi.org/10.1088/1742-6596/1237/2/022062
[4] Li, H., Yuan, D., Wang, Y., Cui, D., Cao, L. (2016). Arrhythmia classification based on multi-domain feature extraction for an ECG recognition system. Sensors, 16(10): 1744. https://doi.org/10.3390/s16101744
[5] Qaisar, S.M., Mihoub, A., Krichen, M., Nisar, H. (2021). Multirate processing with selective subbands and machine learning for efficient arrhythmia classification. Sensors, 21(4): 1511. https://doi.org/10.3390/s21041511
[6] Li, W. (2018). Wavelets for electrocardiogram: Overview and taxonomy. IEEE Access, 7: 25627-25649. https://doi.org/10.1109/ACCESS.2018.2877793
[7] Mazaheri V., Khodadadi H. (2020). Heart arrhythmia diagnosis based on the combination of morphological, frequency and nonlinear features of ECG signals and metaheuristic feature selection algorithm. Expert Syst. Appl, 161: 113697. https://doi.org/10.1016/j.eswa.2020.113697
[8] Qaisar, S.M., Krichen, M., Jallouli, F. (2020). Multirate ECG processing and k-nearest neighbor classifier based efficient arrhythmia diagnosis. In International Conference on Smart Homes and Health Telematics, pp. 329-337. https://doi.org/10.1007/978-3-030-51517-1_29
[9] Selesnick, I.W. (2011). Wavelet transform with tunable Q-factor. IEEE Transactions on Signal Processing, 59(8): 3560-3575. https://doi.org/10.1109/TSP.2011.2143711
[10] Mahgoub, A., Tanveer, A., Qidwai, U. (2018). Arrhythmia classification using DWT-coefficient energy ratios. In 2018 IEEE-EMBS Conference on Biomedical Engineering and Sciences (IECBES), pp. 259-264. https://doi.org/10.1109/IECBES.2018.8626726
[11] Izci, E., Ozdemir, M.A., Sadighzadeh, R., Akan, A. (2018). Arrhythmia detection on ECG signals by using empirical mode decomposition. 2018 Medical Technologies National Congress (TIPTEKNO), pp. 1-4. https://doi.org/10.1109/TIPTEKNO.2018.8597094
[12] Wang, T., Lu, C., Sun, Y., Yang, M., Liu, C., Ou, C. (2021). Automatic ECG classification using continuous wavelet transform and convolutional neural network. Entropy, 23(1): 119. https://doi.org/10.3390/e23010119
[13] Mohanty, M., Biswal, P., Subudhi, A., Sabut, S. (2018). Classification of ventricular arrhythmias using dwt based VMD features. In 2018 2nd International Conference on Data Science and Business Analytics (ICDSBA), pp. 507-510. https://doi.org/10.1109/ICDSBA.2018.00100
[14] Ramkumar, M., Babu, C.G., Kumar, K.V., Hepsiba, D., Manjunathan, A., Kumar, R.S. (2021). ECG cardiac arrhythmias classification using DWT, ICA and MLP neural networks. In Journal of Physics: Conference Series, 1831(1): 012015. https://doi.org/10.1088/1742-6596/1831/1/012015
[15] Chen, C., Hua, Z., Zhang, R., Liu, G., Wen, W. (2020). Automated arrhythmia classification based on a combination network of CNN and LSTM. Biomedical Signal Processing and Control, 57: 101819. https://doi.org/10.1016/j.bspc.2019.101819
[16] Diker, A., Avci, D., Avci, E., Gedikpinar, M. (2019). A new technique for ECG signal classification genetic algorithm Wavelet Kernel extreme learning machine. Optik, 180: 46-55. https://doi.org/10.1016/j.ijleo.2018.11.065
[17] de Albuquerque, V.H.C., Nunes, T.M., Pereira, D.R., Luz, E.J.D.S., Menotti, D., Papa, J.P., Tavares, J.M.R. (2018). Robust automated cardiac arrhythmia detection in ECG beat signals. Neural Computing and Applications, 29(3): 679-693. https://doi.org/10.1007/s00521-016-2472-8
[18] Jain, P.K., Tiwari, A.K. (2018). A robust algorithm for segmentation of phonocardiography signal using tunable quality wavelet transform. Journal of Medical and Biological Engineering, 38(3): 396-410. https://doi.org/10.1007/s40846-017-0320-7
[19] Alickovic, E., Subasi, A. (2015). Effect of multiscale PCA de-noising in ECG beat classification for diagnosis of cardiovascular diseases. Circuits, Systems, and Signal Processing, 34(2): 513-533. https://doi.org/10.1007/s00034-014-9864-8
[20] UCI Machine Learning Repository. (2018). Arrhythmia Data Set. Retrieved from http://archive.ics.uci.edu/ml/datasets/Arrhythmia.
[21] Ramkumar, M., Babu, C.G., Kumar, K.V., Hepsiba, D., Manjunathan, A., Kumar, R.S. (2021). ECG Cardiac arrhythmias classification using DWT, ICA and MLP Neural Networks. In Journal of Physics: Conference Series, 1831(1): 012015. https://doi.org/10.1088/1742-6596/1831/1/012015
[22] Izci, E., Ozdemir, M.A., Sadighzadeh, R., Akan, A. (2018). Arrhythmia detection on ECG signals by using empirical mode decomposition. In 2018 Medical Technologies National Congress (TIPTEKNO), pp. 1-4. https://doi.org/10.1109/TIPTEKNO.2018.8597094
[23] Raju, N.R. (2019). ECG signal classification using DD-CWT and RFC. Asia-pacific Journal of Convergent Research Interchange, pp. 93-112. https://doi.org//10.21742/apjcri.2019.12.10
[24] Huang, J.S., Chen, B.Q., Zeng, N.Y., Cao, X.C., Li, Y. (2020). Accurate classification of ECG arrhythmia using MOWPT enhanced fast compression deep learning networks. Journal of Ambient Intelligence and Humanized Computing, pp. 1-18. https://doi.org/10.1007/s12652-020-02110-y