Saisai Sun* | Gang Lei | Zhipeng Sun
OPEN ACCESS
Dynamic and static load (DSL) tests provide an important tool for safety inspection of bridge structure. The test results reflect the actual working condition, bearing capacity and working performance of the bridge structure, laying a scientific basis for the operation safety of the bridge. This paper carries out the DSL tests on a rigid-frame bridge, details the loading plans and test process, and analyzes the stress state under static loads and the dynamic properties under dynamic loads. The results show that the bridge belongs to the elastic state under design load, and satisfies the requirements of the design and normal use in terms of bearing capacity, stiffness and working performance. The inspection method and findings of this research provide important references to the DST testing and evaluation of similar bridges.
dynamic and static load (DSL) tests, bearing capacity, working performance, rigid-frame bridge, stress state, dynamic properties
Recent years has seen a marked progress in the inspection of bridge structures, thanks to the emerging theories and devices for bridge test and inspection [1-3]. The dynamic and static load (DSL) tests provide an important tool for completion acceptance and quality assessment of new bridges. The test results reveal the effects in bridge design or construction, laying a scientific basis for completion acceptance and operation.
With the increase of traffic volume, in-service bridges often suffer from problems like concrete damages, material aging and the loss of bearing capacity. These problems pose a serious threat to the operational safety of these bridges. The DSL tests can evaluate the performance and bearing capacity of in-service bridges, and shed light on the continued safe use, maintenance, reinforcement or alteration of these bridges [4-7].
Many scholars have performed the DSL tests on bridges. For instance, Quattrone et al. [8] carried out dynamic measurements before and after static tests under different excitation sources, and concluded that the natural frequency of the beam is a predictor of the ultimate bending moment of existing structures. Xiao et al. [9] investigated the effects of loading position and driving speed on bridge performance through the DSL tests. Some scholars combined finite-element simulation and field tests to study the stress and vibration features of a bridge under dynamic and static loads, and evaluated bridge safety based on the research results, providing scientific and accurate data for maintaining the operational safety of the bridge [10-15].
Targeting a new large-span rigid-frame bridge, this paper evaluates the overall performance of the bridge structure through both theoretical analysis and the DSL tests.
Our research object is a T-shaped prestressed concrete rigid-frame bridge. The 150m-long bridge has two 75m spans and a single-box double-room box girder. The main girder is 7.4m tall in the section of the middle pivot point, and 3.2m tall in the section of each side pivot point. From the section of each side pivot point to that of the middle pivot point, the top plate thickness shifts from 0.35m to 0.85m, and the bottom plate thickness varies from 0.35m to 1.50m. In the height variation segment of the main girder, the girder bottom is in the shape of a 1.5-order parabolic curve. The box girder uses C55 high-performance concrete, and the prestressed steel tendons are ΦS15.2 high-strength low-relaxation steel strands. In addition, the bridge is supported by reinforced concrete variable-section piers and a bored pile foundation. The technical indices of the bridge design are as follows: the design load belongs to Grade A of urban road load, the design vehicle speed is 60km/h, and the seismic fortification intensity is degree VII.
3.1 Test contents
Firstly, the bridge was applied the static load with the same effect as the design load. Then, the author measured the deformation, stress and cracking of the bridge structure with relevant instruments, and judged whether the bridge worked under normal stress state. After that, the structure design and construction quality of the bridge were inspected by comparing the measured data against the theoretical results of the bridge structure under the same load and the values specified in the Technical Code for Test and Evaluation of City Bridges (CJJ/T 233-2015). In this way, the bearing capacity and working condition of the bridge were evaluated in a comprehensive manner [16-19].
3.2 Model construction and arrangement of measuring points
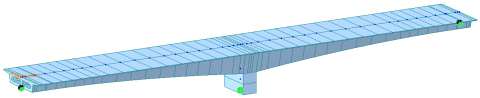
The test bridge was subjected to finite-element modelling by the largescale finite-element software midas Civil 2015. As shown in Figure 1, the entire bridge was meshed into 52 girder elements. Considering the stress features of the finite-element model under design load, the mid-span sections (A-A, C-C) and the pivot point section (B-B) were selected as the control sections of our tests. The locations of the control sections are shown in Figure 2. Specifically, both the mid-span sections and the pivot point section were taken as the test sections for stress measurement, and only the mid-span sections were selected as the test sections for deflection measurement. During the tests, the strain data were collected by JMZX-212HA vibrating wire sensors (Kingmach, China). As shown in Figure 3, five sensors were deployed on each strain test section, including 3 on the bottom of the girder, and 2 under the flange plate. The deflection data were captured by a multi-point dynamic and static displacement detection video system. The deflection measuring points are arranged as shown in Figure 4.
Figure 1. Finite-element model of the bridge structure
Figure 2. Arrangement of control sections (unit: m)
Figure 3. Deployment of sensors
Figure 4. Deployment of deflection measuring points
3.3 Loading plan
The static load tests help to disclose the actual bearing capacity and stress state of the bridge, laying the basis for the safe operation of the bridge. In principle, the test load should be the same as the standard load in the design and should not damage the bridge structure to avoid casualties or property losses. Meanwhile, the loading conditions of the tests must be optimized to achieve the inspection purposes with the minimum number of working conditions.
In our tests, the test bridge was loaded first under the mode with the most unfavorable influence line. Thus, the load size and position needed for the tests were identified, such that the loading efficiency of each control section satisfies the CJJ/T 233-2015.
A total of three loading conditions (Figures 5-7) were prepared for our tests. Eight three-axle lorries (wheel track: 1.8m; front wheelbase: 3.9 m; rear wheelbase: 1.35 m) were selected to apply the load. The axle loads of the lorries are listed in Table 1. The control section bending moments and loading efficiencies under the three loading conditions are displayed in Table 2.
Table 1. The axle loads of the lorries
|
Serial number |
Axle loads (t) |
|||
|
Front axle |
Middle axle |
Rear axle |
Total load |
|
|
(1) |
9.2 |
16.3 |
16.3 |
41.8 |
|
(2) |
8.5 |
16.3 |
16.3 |
41.1 |
|
(3) |
8.7 |
17.0 |
17.0 |
42.7 |
|
(4) |
8.6 |
16.2 |
16.2 |
41.0 |
|
(5) |
8.8 |
16.6 |
16.6 |
42.0 |
|
(6) |
8.0 |
16.1 |
16.1 |
40.2 |
|
(7) |
7.8 |
16.2 |
16.2 |
40.2 |
|
(8) |
8.8 |
16.9 |
16.9 |
42.6 |
Table 2. Control section bending moments and loading efficiencies
|
Loading condition |
Measured bending moment (kN·m) |
Designed bending moment (kN·m) |
Measured loading efficiency $\eta_q$ |
|
Ⅰ |
20,815.7 |
22,002.2 |
0.95 |
|
Ⅱ |
-49,599.7 |
-51,520.5 |
0.96 |
|
Ⅲ |
20,815.7 |
22,002.2 |
0.95 |
According to the CJJ/T 233-2015, the loading efficiency $\eta_q$ of the static tests is the ratio of the computed effect of a control section under the test load to the designed control effect of that section. To fully reflect the stress features of the bridge structure, the loading efficiency for load tests is generally selected from a high range, namely, 0.95~1.05. In our tests, the $\eta_q$ value is set to 0.95~0.96. The mechanical effect of the test load can meet the requirements for inspecting the bridge service status.
Figure 5. The loading plan for condition I (unit: m)
Figure 6. The loading plan for condition II (unit: m)
Figure 7. The loading plan for condition III (unit: m)
3.4 Process control
The test load was applied in three stages, depending on the total load and the actual condition of the bridge. The time interval between two stages was no less than 15min. During the loading, the abnormal sounds, loss of stability, twists and sways were recorded in details. The internal force or deflection of the non-control sections were controlled within the most unfavorable level under the control load.
3.5 Analysis of static load test results
Through the static load tests, the bearing capacity and working state of the bridge were evaluated by the validation coefficient η and the relative residual deformation (strain). The validation coefficient is the ratio of the measured value to the theoretical value. The smaller the η, the better the overall performance of the bridge structure, the higher the strength and elastic modulus of the structural materials, and the larger the margin of safety. The greater the η, the weaker the structural materials, the poorer the connection between structural parts, and the lower the structural stiffness. The relative residual deformation (strain) refers to the ratio of the measured residual deformation (strain) of the structure under the test load to the total deformation (strain) of the structure under that load. The smaller the relative residual deformation (strain), the closer the structure is to the elastic state [11, 20].
After sorting out the results of the static load tests, the deflection and strain measured at each section under each loading condition were obtained. The measured results and the theoretical values are presented in Tables 3 and 4, respectively.
As shown in Tables 3 and 4, under all three loading conditions, the validation coefficients of the deflections measured at sections A-A and C-C were 0.56 and 0.62, respectively, and the validation coefficients of the strains measured at sections A-A, B-B and C-C fell in 0.47~0.70, 0.46~0.82 and 0.59~0.74, respectively. The validation coefficients of deflections and strains were both smaller than 1, as required in the CJJ/T 233-2015. This means the bridge structure performs well under stress, fulfills the design requirements in actual bearing capacity and strength, and enjoys a large safety margin. In addition, the relative residual deflections and relative residual strains of the test sections were all below 20%, which satisfies the provisions in the CJJ/T 233-2015. The results show that the bridge structure is close to the elastic state under the test loads, showing a strong ability to recover from elastic deformation.
Table 3. Measured and theoretical deflections at each section under loading conditions I and III
|
Loading condition |
Section |
Total deformation/mm |
Elastic deformation/mm |
Residual deformation/mm |
Relative residual deformation/% |
Theoretical value/mm |
Validation coefficient η |
|
Condition I |
A-A |
2.171 |
2.001 |
0.17 |
7.83 |
3.862 |
0.56 |
|
Condition III |
C-C |
2.379 |
2.219 |
0.16 |
6.73 |
3.862 |
0.62 |
|
Loading condition |
Section |
Measuring point |
Total strain/(με) |
Elastic strain/(με) |
Residual strain/(με) |
Relative residual strain/(με) |
Theoretical value/(με) |
Validation coefficient η |
|
Condition I |
A-A |
A1 |
-8 |
-7 |
-1 |
12.5 |
-17 |
0.47 |
|
A5 |
-11 |
-10 |
-1 |
9.09 |
0.65 |
|||
|
A2 |
16 |
15 |
1 |
6.25 |
23 |
0.70 |
||
|
A3 |
12 |
10 |
2 |
16.7 |
0.52 |
|||
|
A4 |
16 |
14 |
2 |
12.5 |
0.70 |
|||
|
Condition II |
B-B |
A1 |
-11 |
-11 |
0 |
0 |
-14 |
0.79 |
|
A5 |
-8 |
-7 |
-1 |
12.5 |
0.57 |
|||
|
A2 |
9 |
8 |
1 |
11.1 |
11 |
0.82 |
||
|
A3 |
5 |
5 |
0 |
0 |
0.46 |
|||
|
A4 |
6 |
5 |
1 |
16.7 |
0.55 |
|||
|
Condition Ⅲ |
C-C |
A1 |
-11 |
-9 |
-2 |
18.2 |
-17 |
0.65 |
|
A5 |
-10 |
-9 |
-1 |
10 |
0.59 |
|||
|
A2 |
17 |
15 |
2 |
11.8 |
23 |
0.74 |
||
|
A3 |
14 |
13 |
1 |
7.1 |
0.61 |
|||
|
A4 |
17 |
15 |
2 |
11.7 |
0.74 |
4.1 Test principle
The vibration of the bridge structure was induced by an excitation strategy. Then, the natural frequency, damping ratio, vibration mode and other structural parameters were measured, and used to evaluate the technical condition and overall stiffness of the bridge structure [21-23].
4.2 Test method and arrangement of measuring points
The dynamic load tests were conducted by the pulsation method. A total of 32 high-sensitivity, ultra-low frequency vibration pickups (Figure 8) were deployed on the main girder to record the vibrations of the bridge girder under the excitation of environmental loads like water flow, ground pulsation and wind. The collected vibration signals were subjected to spectral analysis, revealing the self-vibration features of the structure.
Figure 8. Arrangement of vibration pickups
4.3 Data collection and analysis
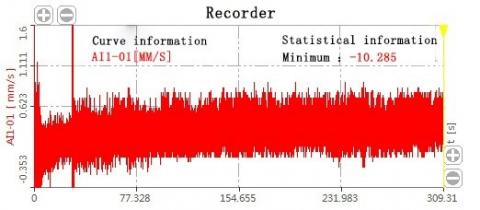
When no lorry drove on the bridge deck, the vibration response of the bridge to environmental loads was recorded by the dynamic signal test system DH5922. The time-history curve of the acceleration under environmental loads was plotted (Figure 9). Then the spectral analysis method was used to identify the modal parameters of the structure. The spectral analysis shows that the measured natural vibration frequency and damping ratio of the bridge were 2.23Hz and 4.6%, respectively. Then, the finite-element model of the bridge underwent dynamic analysis on midas Civil 2015. Through the analysis, the theoretical value of the fundamental frequency of the bridge structure was computed as 1.98Hz.
Figure 9. The time-history curve of the acceleration under environmental loads
The results of dynamic load tests show that: the measured natural vibration frequency (2.23Hz) of the bridge was greater than the theoretical value (1.98Hz), indicating that the structural stiffness meets the design requirements; the measured damping ratio (4.6%) fell in the normal range, revealing that the structure boasts good damping properties and a certain energy dissipation ability.
The following conclusions were drawn through the comparative analysis between the measured data and the finite-element results:
(1) Under all loading conditions in the static load tests, the validation coefficients of deflection and strain, the relative residual deformation and relative residual strain of each control section all satisfied the requirements in the CJJ/T 233-2015; the deflection and strain measured at any control section were smaller than the theoretical results of the finite-element model; no crack was observed on the main girder throughout the loading. The above results show that the bridge structure has a reasonable stress performance, and meets the design requirements on bearing capacity, strength and crack-resistance.
(2)According to the results of the dynamic load tests, the measured natural vibration frequency of the structure was greater than the theoretical result of the finite-element model, revealing that the actual stiffness of the bridge surpasses the designed stiffness; the measured damping ratio fell in the normal range, indicating that the structure boasts good damping properties that greatly suppress the vibration response.
(3) Overall, the DSL test results demonstrate that the bridge structure basically belongs to the elastic state under the design load and enjoys a good dynamic performance. There is no problem with construction quality or technology that affects the normal service.
[1] Obrien, E., Carey, C., Keenahan, J. (2015). Bridge damage detection using ambient traffic and moving force identification. Structural Control And Health Monitoring, 22(12): 1396-1407. http://doi.org/10.1002/stc.1749
[2] Chu, X., Zhou, Z.X., Xiang, X.J., He, S.L., Hou, X. (2018). Monitoring of long-span bridge deformation based on 3D laser scanning. Instrumentation Mesure Métrologie, 17(1): 113-130. https://doi.org/10.3166/I2M.17.113-130
[3] Dawari, V.B., Vesmawala, G.R. (2013). Modal curvature and modal flexibility methods for honeycomb damage identification in reinforced concrete beams. Procedia Engineering, 51: 119-124. http://doi.org/10.1016/j.proeng.2013.01.018
[4] Yang, C.X., Yang, W.J., Zhang, J.R., Wang, H.C. (2011). An analysis of failure risk of the bridge load test based on proof load method. Journal of Changsha Communications University, 20(2): 25-29. http://doi.org/10.3969/j.issn.1674-599X.2004.02.006
[5] Lu, Z.Q., Zhang, T., Zhao, Q.Y. (2013). Study on the load test of continuous beam bridge. Applied Mechanics And Materials, 405-408: 1637-1640. http://doi.org/10.4028/www.scientific.net/AMM.405-408.1637
[6] Hu, Z.J., Jia, L.J., Xiao, R.C., Yuan, S.H. (2006). Comments on assessing systems for the technical state of existing bridges. Traffic Engineering and Technology For National Defence, 4(2): 1-5. http://doi.org/10.3969/j.issn.1672-3953.2006.02.001
[7] Ji, L., Wang, M.L., Sun, M.L., Zhao, W.L., Wang, H.M., Zhang, H. (2018). Forming process of carbon fiber truss bridge units. Revue des Composites et des Matériaux Avancés, 28(4): 471-479. https://doi.org/10.3166/RCMA.28.471-479
[8] Quattrone, A., Matta, E., Fragonara, L.Z., Ceravolo, R., Stefano, A.D. (2012). Vibration tests on dismounted bridge beams and effects of deterioration. Journal of Physics: Conference Series, 382(1): 1-6. http://doi.org/10.1088/1742-6596/382/1/012059
[9] Xiao, Y.G., Hu, L.X. (2014). Load-carrying capacity analysis of prestressed hollow slab bridge based on load test. Highways and Automotive Applications, (1): 210-214. http://doi.org/10.3969/j.issn.1671-2668.2014.01.055
[10] Bin, J., Lei, J.S., Liu, J.J. (2011). Bearing capacity of reinforced concrete simple beam bridge inspection and analysis. Advanced Materials Research, 255-260: 947-951. http://doi.org/10.4028/www.scientific.net/AMR.255-260.947
[11] Ye, J. (2017). Research of dynamic and static loading test in bridge inspection. Urban Roads Bridges and Flood Control, (7): 225-229. http://doi.org/10.16799/j.cnki.csdqyfh.2017.07.070
[12] Zeng, Y., Zeng, Y. (2013). Bridge structure detection based on load test. Applied Mechanics And Materials, 438-439: 891-893. http://doi.org/10.4028/www.scientific.net/AMM.438-439.891
[13] Yu, X.L., Chen, S.R., He, Z.Z., Yan, Q.S. (2013). Dynamic and static load test and analysis of shaoguan east bridge. Science Technology and Engineering, 13(21): 6171-6175. http://doi.org/10.3969/j.issn.1671-1815.2013.21.022
[14] Han, H.B., Wang, L., Li, Z., Long, X.H. (2013). Study on the static and dynamic load test of skew bridge. Advanced Materials Research, 859: 127-130. http://doi.org/10.4028/www.scientific.net/AMR.859.127
[15] Huseynov, F., Brownjohn, J.M.W., O'Brien, E.J., Hester, D. (2017). Analysis of load test on composite I-girder bridge. Journal of Civil Structural Health Monitoring, 7(2): 163-173. http://doi.org/10.1007/s13349-017-0223-x
[16] Ma, G., Li, Z.C., Ke, Z.T. (2008). Inquiry on theoretical calculation of static bridge load test. Railway Engineering, (10): 25-28. http://doi.org/10.3969/j.issn.1003-1995.2008.10.008
[17] Zhang, X.K. (2014). Inspection and evaluation of prestressed concrete beam bridge of a highway. Shanxi Architecture, 40(11): 204-205. http://doi.org/10.3969/j.issn.1009-6825.2014.11.105
[18] Qi, Z.W., Fang, S.J., Lin, G.D., Wang, H. (2011). Static and dynamic experiment of the behavior of the constructed hanjiang super-major railway bridge in laohekou. Advanced Materials Research, 255-260: 1230-1235. http://doi.org/10.4028/www.scientific.net/AMR.255-260.1230
[19] Wu, J.Q., Zheng, X., Zhang, T.T. (2011). Research on static load test in bridge detection. Railway Engineering, (2): 42-44. http://doi.org/10.3969/j.issn.1003-1995.2011.02.012
[20] Deng, R. (2017). Research on structural verification coefficient of railway steel truss girder bridge. Railway Engineering, (5): 1-6. http://doi.org/10.3969/j.issn.1003-1995.2017.05.01
[21] Ma, M.J. (2013). Dynamic load test analysis for continuous steel bridge. Applied Mechanics and Materials, 275-277: 1078-1081. http://doi.org/10.4028/www.scientific.net/AMM.275-277.1078
[22] Plachýa, T., Poláka, M., Ryjáčekb, P. (2017). Assessment of an old steel railway bridge using dynamic tests. Procedia Engineering, 199: 3053-3058. http://doi.org/10.1016/j.proeng.2017.09.555
[23] Lu, Z.G., Li, G.J., Jiang, W.W. (2012). Analysis of dynamic performance testing of bridge based on finite element and dynamic load test. Applied Mechanics and Materials, 178-181: 2323-2328. http://doi.org/10.4028/www.scientific.net/AMM.178-181.2323.