Younes Menni* | Ali J. Chamkha | Chafika Zidani | Boumédiène Benyoucef
OPEN ACCESS
In the present analysis, the heat and Al2O3-H2O nanofluid mass transfer through a two-dimensional channel with detached and attached baffle plates is numerically characterized and investigated. The physical aspect is governed by the Reynolds-averaged Navier-Stokes (RANS) equations, with the standard k-epsilon (ε) turbulence model and the energy equation. The Finite Volume Method (FVM), with the Semi Implicit Method for Pressure Linked Equations (SIMPLE) algorithm, and the Quadratic Upstream Interpolation for Convective Kinetics (Quick) numerical scheme, by means of the Commercial CFD software FLUENT are used in this analysis. The nanofluid dynamics, heat transfer, and friction loss according to different stations in the computational domain are shown in detail. As expected, the presence of nanoparticles and baffle plates has significant effects of heat transfer, and the results of the present analysis may be applied for the design, optimization and flow control of many thermal applications involving nanofluid field effects.
design, optimization, flow control, nanofluid filed, computational nanofluid dynamics
Application of nanotechnology in the field of renewable energy is growing. There are many studies related to the nanofluids application in solar power [1]. Nazari et al. [2] experimentally evaluated the effects of utilizing thermoelectric channel for cooling of the glass cover in the single slope solar still. Ameri and Eshaghi [3] focused on the evaluation and feasibility study of laminar Fe3O4 nanofluid flow in porous media with a constant magnetic field in a flat plate collector which is known as the novel system in comparison to porous foam utilization in the FPC absorbing tubes tube with laminar water flow which is known as the Rival system. Bazdidi-Tehrani et al. [4] numerically studied the turbulent forced convection of TiO2/water nanofluid through a ribbed flat-plate solar collector. The scale-adaptive-simulation approach was employed to simulate the turbulent flow through the plain and ribbed ducts which are surrounded by solid flat-plate. Bellos and Tzivanidis [5] examined the utilization of nanofluids as working fluids of solar collectors which drive an absorption chiller operating with the LiBr-H2O working pair. Edalatpour and Solano [6] numerically investigated the various parameters of heat transfer in a 30-degree inclined three-dimensional tube-on-sheet flat plate solar collector working under conjugated laminar mixed convection. Genc et al. [7] introduced a transient heat transfer approach for determining the thermal inertia of each component such as glass, trapped air, absorber and working fluid for nanofluid based flat plate solar collectors. Shamshirgaran et al. [8] investigated the effect of simultaneous using of nanofluid and selective absorber on the improvement of work extraction by a solar flat-plate collector (FPC). Sint et al. [9] theoretically analyzed the efficiency of a flat plate solar collector using water based CuO nanofluid as a working fluid. Khan et al. [10] integrated a solar parabolic dish system with cavity receiver to a recompression s-CO2 Brayton cycle for power generation. Three oil based nanofluids were introduced in the receiver of dish system to compare the detailed first and second law efficiencies of the integrated CSP system. Korres et al. [11] investigated the use of a nanofluid as the working fluid in a CPC under laminar flow conditions. The studied nanofluid was Syltherm 800/CuO with 5% volumetric concentration and it was compared with the thermal oil (Syltherm 800). Boyaghchi and Chavoshi [12] performed the thermodynamic, economic and environmental analyses of a solar-geothermal driven combined cooling, heating and power (CCHP) cycle integrated with flat plat collectors containing water/copper oxide (CuO) nanofluid as the absorbing medium. Loni et al. [13] performed a detailed energetic and exergetic analysis of a solar dish concentrator with spiral cavity receiver operating with nanofluids. Wang et al. [14] proposed a parabolic trough collector (PTC) system using Al2O3/synthetic oil nanofluid as heat transfer fluid (HTF) to improve the performances of the PTC system. Bhalla et al. [15] investigated the effect of five critical factors such as height of the collector, mass flow rate, incident flux, nanoparticle mass fraction, and length of the collector on the performance of nanofluid-based solar collector. Other similar works can be found in the literature as Ahmadi et al. [16], Vasanthakumari and Pondy [17], Tahmasebi et al. [18], Mehryan et al. [19-21], Demartini et al. [22], Ghalambaz et al. [23-25], Chamkha et al. [26], Ismael et al. [27], Rashad [28], Rashad et al. [29-30], Sivasankaran et al. [31]. Various geometries and different boundary conditions were used in those studies.
The physical model under consideration contains a numerical analysis of a steady turbulent forced-convection flow of Al2O3-H2O nanofluid in a two-dimensional horizontal rectangular channel with simple geometry baffles and fins. Effects of nanofluid and detached/attached obstacles on the convective heat transfer characteristics are numerically investigated for different values of Reynolds numbers. The numerical data for the steady-state dynamic-pressure, stream-function, velocity-magnitude, and axial-velocity fields as well as the distributions of x-velocity, normalized local and average Nusselt numbers, and normalized skin-friction coefficients are reported graphically and discussed.
The study under consideration contains a computational nanofluid dynamic analysis of a rectangular channel with simple geometry obstacles. The problem is potentially interesting for researchers and engineers working on solar collectors and aerospace industry. It is known that heat transfer enhancement can be achieved by creating longitudinal vortices in the flow. These vortices can be generated by flat detached and attached baffles and fins, and a computational analysis of such heat exchangers is not a simple task. Therefore, the authors used a present-day commercial CFD code to solve the problem.
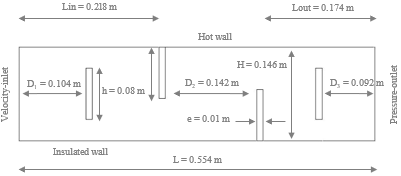
Detail of the computational section with the geometric parameters and boundary conditions is shown in Figure 1. A numerical study is carried out on the dynamic and thermal behavior of a single phase, Newtonian, and incompressible nanofluid of the Al2O3-H2O type with a constant property and flowing turbulently through a two-dimensional horizontal rectangular cross section channel. Two solid-type obstacle pairs, having different situations, i.e. attached and detached, were inserted into the channel to force vortices to improve the mixing and consequently the heat transfer.
At the channel inlet, at x = 0, the Al2O3-H2O nanofluid temperature, Tin, is equal to 300° K. Non slip and impermeability boundary conditions are applied for the solid boundaries. The upper surface was put in a constant temperature condition (Tw = 375 K), while the lower one was thermally insulated. The Reynolds number, Re changes from 12,000 to 30,000 and the nanofluid volume fraction (ϕ) is taken equal to 2 %. Note that the atmospheric pressure (Patm) is prescribed at the channel outlet.
Figure 1. Physical model under consideration
The Al2O3-H2O nanofluid model is governed by the Reynolds averaged Navier-Stokes (RANS) equations with the standard k-epsilon (k-ε) turbulence model and the energy equation, details of which can be found in Ajeel et al. [32]. The detail on governing parameters (Reynolds number, hydraulic diameter, skin friction coefficient, and Nusselt numbers can be found in similar work by Menni et al. [33]. The nanofluid density, thermal conductivity, dynamic viscosity and its heat capacity can be calculated as reported by Chamkha et al. [34].
In the present analysis, the turbulent forced-convection heat transfer of (H2O + 2% Al2O3) nanofluid in a channel with detached/attached baffles and fins is studied. The standard k-ε model [35] is employed to simulate the turbulence effects. The governing flow equations with the thermo-hydrodynamic boundary conditions are solved by the finite volume method [36], using the commercial CFD software FLUENT. The SIMPLE-algorithm [36] is used for the convective terms in the solution equations. The QUICK-scheme in the form given by Leonard and Mokhtari [37] is selected to discretize the convective terms in the governing equations, while a Second-order upwind scheme [36] is used for the pressure terms.
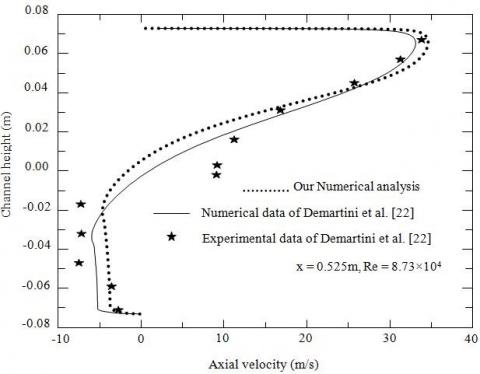
Figure 2. Validation plot of axial velocity with reported numerical and experimental results [22]
A non-uniform and two-dimensional mesh of quadrilateral-type is used. To investigate the impact of the cell size on the CFD solution, different cells are examined and a cell of 245 × 95 nodes is chosen and adopted in X and Y directions, respectively.
The validity of the present results was illustrated in this research by comparing the axial velocity profiles with those of Demartini et al. [22] for a rectangular channel containing two baffle plates installed on the upper and lower walls which are crossed by a steady turbulent, incompressible fluid flow of constant properties. This comparison demonstrated the validity of this simulation. There is a qualitative and quantitative consensus as shown in Figure 2.
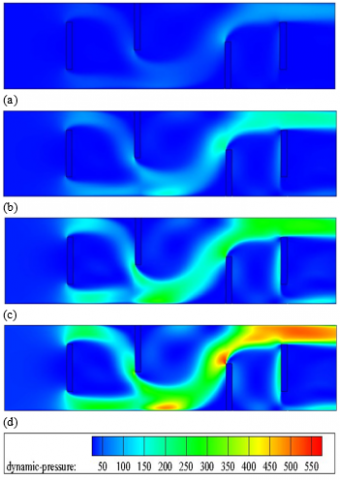
The pressure values rise near the top and bottom edges of the first detached baffle due to a reduction in the flow area at the entrance of the channel, Figure 3. This augmentation is increased near the upper frontal sides of the upper and lower attached baffles. The pressure values are very large at the top of the second detached baffle next to the lower surface of the upper wall of the channel to its outlet. While pressure values decrease before and after the first and second detached baffles, as well as in the back areas of the top and bottom attached baffles. The pressure values are mainly related to Reynolds number values where there is a linear correlation between them.
Figure 3. Dynamic pressure fields for various Reynolds numbers: (a) Re = 12,000, (b) Re = 18,000, (c) Re = 24,000, and (d) Re = 30,000
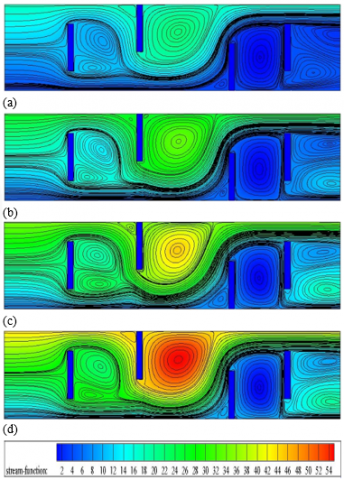
The current enters with regular lines, starting from the channel entrance, Figure 4. These lines are disturbed near the left corner of the first detached baffle, where the field is divided into two direct currents towards the upper and lower gaps above and under this same baffle. The two sharp edges, found upstream, represent the points of the direct current split, where cells of recirculation are formed in the upper and lower regions behind the baffle. These rings were formed due to the reduction in the pressure in this area. Near the first attached baffle, the direct currents are synchronized with the reverse fields, where the nanofluid flows as a main stream down this same baffle, where low-intensity recycling areas form near the upper left side of the baffle, while strong recycling cells are formed behind the same baffle. The flow field collides with the second attached baffle where the pressure is reduced in the lower front where there is a small recirculation zone, while the pressure rises in the upper part where the current is divided into a forward stream and a reverse current is located behind the baffle where the recycling cells are located, extending to the left side of the second detached baffle. The fluid flows with high velocity above the last baffle next to the hot wall of the channel, while two reverse currents are formed. The first is near the upper right of the same baffle, while the second is in contact with the first and extends to the insulated wall of the channel. As shown in this figure, recycling areas are becoming more intense by increasing Reynolds number values.
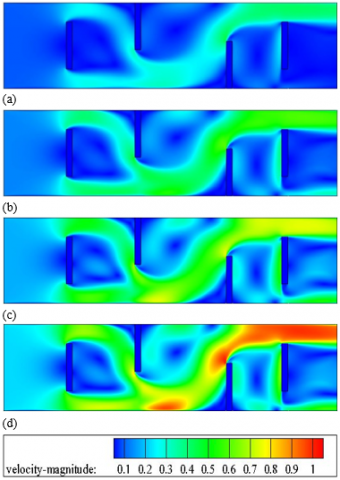
Figure 5 shows the contour plots of velocity-magnitude fields in the detached and attached baffled channel for various Reynolds number values, from 12,000 to 30,000.
Figure 4. Streamlines for different Reynolds numbers: (a) Re = 12,000, (b) Re = 18,000, (c) Re = 24,000, and (d) Re = 30,000
The mean velocity values decrease as the flow is approached from the first detached baffle and then skips towards the top and bottom sides of the same baffle at high speed due to the increase in the pressure due to the reduction in the flow area in this aspect of the channel. The first part of the current next to the hot wall collides with the first attached baffle and goes downwards while the second part near the insulated wall continues to move, then aligns with the first current part towards the area enclosed between the upper corner of the second baffle and the bottom wall of the channel. The velocity values are reduced behind the first baffle and near the upper left side of the second baffle, and also in its downstream region. The flow field deviates towards the upper part of the channel due to the presence of the third baffle passing through the top of the last baffle. While the velocity values downstream of the last two baffles decrease because of the low flow pressure in these areas of the channel. The velocity values are very large next to the bottom of the channel between the two inner baffles and near the upper left corner of the third baffle to the outlet of the channel near the hot top wall. The flow velocity values generally increase during the rise in the Reynolds number value from 12,000 to 30,000.
Figure 5. Contour plots of velocity-magnitude fields for various values of Reynolds number: (a) Re = 12,000, (b) Re = 18,000, (c) Re = 24,000, and (d) Re = 30,000
The distribution of axial velocity fields within the channel is also shown in this study as reported in Figure 6. In general, the axial velocity mainly increases in the high pressure areas due to the presence of the detached and attached baffles where the flow area decreases, while their values are reduced next to the baffles, especially in the back areas adjacent to their right sides. The negative values of the axial velocity indicate the presence of a reverse flow of recycling cells behind the baffles. In the figure, the axial velocity value augments with the augmentation of Reynolds number and thus, the Re = 30,000 forces maximum flow speed.
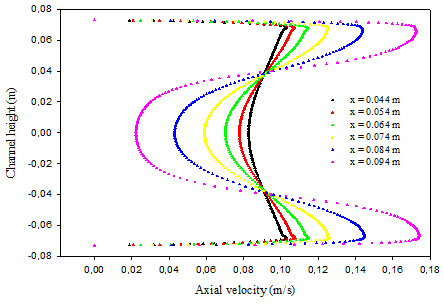
Figure 7 shows the variation of axial velocity profiles on the front of the first detached baffle at successive cross section x = 0.044, 0.054, 0.064, 0.074, 0.084, and 0.094 m from the entrance, respectively 0.06, 0.05, 0.04, 0.03, 0.02, and 0.01 m from the left side of the same obstacle. The axial velocity values decrease as the flow approaches the baffle. While the high speed in the upper and lower regions of the channel as a result of decreasing flow area and high pressure and therefore high speed.
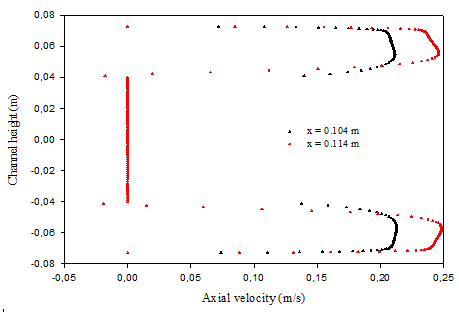
The axial velocity profiles in the two adjacent areas of the upper and lower surfaces of the first detached baffle, up to the opposite channel walls, at transverse stations x = 0.104 m and x = 0.114 m, measured downstream of the inlet, are shown in Figure 8. As expected, the augmentation in the axial velocity in these areas as a result of the increase in the pressure due to the reduction in the flow field surface. The axial velocity passes 270 percent of the entrance speed in this area of the channel.
Figure 6. Axial velocity fields for different Reynolds numbers: (a) Re = 12,000, (b) Re = 18,000, (c) Re = 24,000, and (d) Re = 30,000
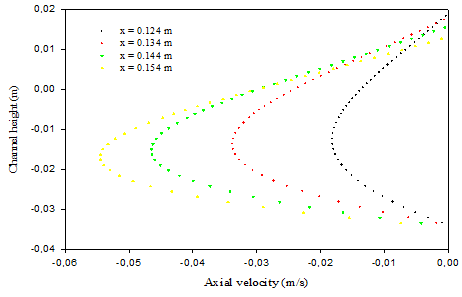
In the region downstream of the first detached baffle, and next to its right side, the axial velocity profiles were represented in cross section at x = 0.124, 0.134, 0.144, and 0.154 m from the entrance, in Figure 9. The axial velocity is characterized by negative values due to the reverse flow in the opposite direction. The negative values indicate the existence of medium-intensity recycling cells and occupy the back side of this same obstacle.
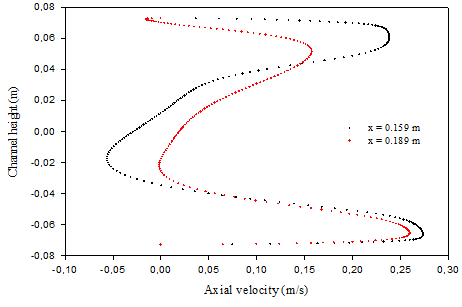
Figure 10 reports the changes in the axial speed of current flow in front of the first attached baffle at transverse locations x = 0.159 m and x = 0.189 m from the channel inlet. The axial velocity values in the upper part of the channel decrease due to the presence of this obstacle.
Figure 7. Profiles of axial velocity upstream of the first detached baffle, Re = 12,000
Figure 8. Profiles of axial velocity in the region opposite of the first detached baffle, Re = 12,000
Figure 9. Profiles of axial velocity downstream of the first detached baffle, Re = 12,000
Figure 10. Profiles of axial velocity upstream of the first attached baffle, Re = 12,000
In the central region, the velocity values are negative and this indicates the extension of the recycling cells located behind the first detached baffle to the left side of the first attached obstacle. On the lower region of the channel, the pressure increases, and the speed rises with the deflection under the same obstacle towards the second attached baffle, as confirmed by Figure 11.
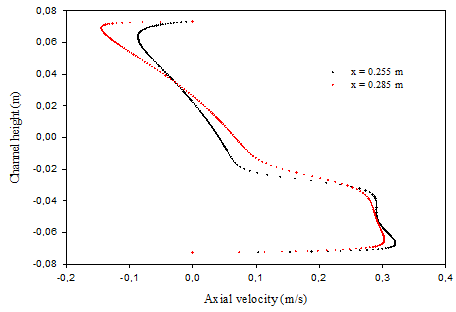
Between the attached baffles, at x = 0.255 m and x = 0.285 m positions of the channel entrance, respectively 0.027 m and 0.057 m from the right side of the first attached baffle, the flow is very fast near the insulated surface of the channel, greater than 330 % of the input speed due to reduced fluid movement area and increased pressure. On the upper side of the channel, the current velocity decreases due to the presence of recycling cells in this region, where the current is moving in the opposite direction with the negative velocities as shown in Figure 12.
Figure 11. Profiles of axial velocity under the first attached baffle, Re = 12,000
Figure 12. Profiles of axial velocity downstream of the first attached baffle, Re = 12,000
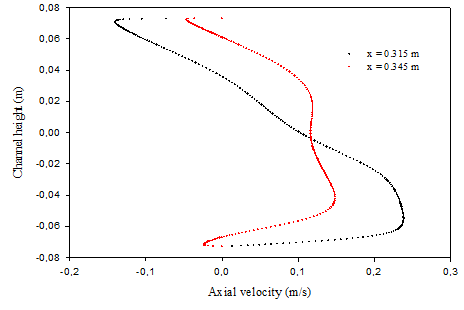
Figure 13. Profiles of axial velocity upstream of the second attached baffle, Re = 12,000
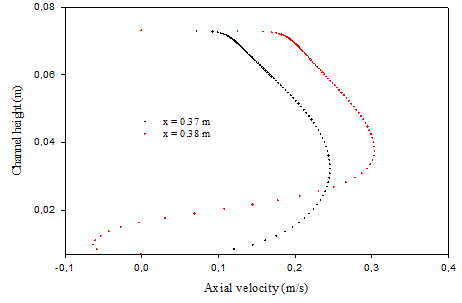
Figure 14. Profiles of axial velocity above the second attached baffle, Re = 12,000
Figure 15. Profiles of axial velocity downstream of the second attached baffle, Re = 12,000
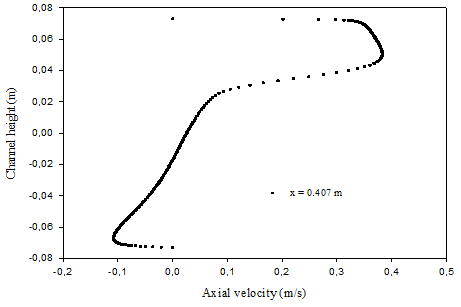
Figure 16. Profiles of axial velocity in the region opposite of the second detached baffle, Re = 12,000
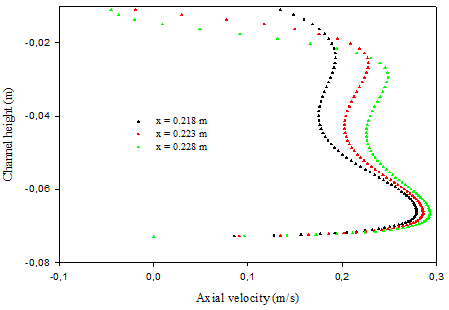
In the vicinity of the second attached baffle, the axial velocity values in the bottom of the channel decrease as the current approaches the left side of this obstacle (see Figure 13 for x = 0.315 m and x = 0.345 m), while the flow starts to accelerate toward the gap above this same baffle, as indicated by the axial velocity profiles at x = 0.37 m and x = 0.38 m from the entrance, Figure 14. Negative velocities in the upper zone indicate the extension of the recycling cells behind the first attached baffle to the second attached baffle.
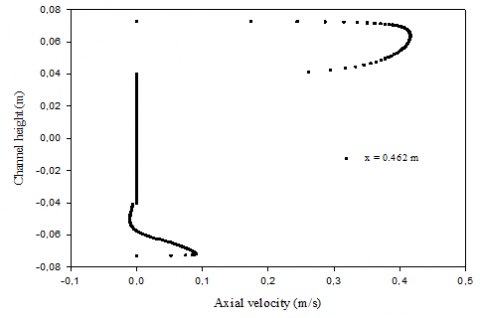
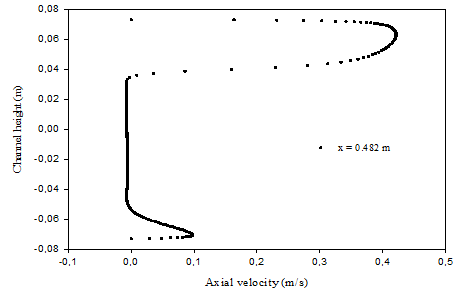
As expected, the speed is very high at the top part of the channel due to the current coming out of the narrow area near the top of the second attached baffle, about 4.25 times greater than the speed of entry, Figure 15. This increase is also due to the recycling cells behind this same baffle on the underside, which force the current towards the upper surface of the channel through the last baffle (see Figure 16 for x = 0.462 m) to the exit, (see Figure 17 for x = 0.482 m).
Figure 17. Profiles of axial velocity after the second detached baffle, near the channel outlet, Re = 12,000
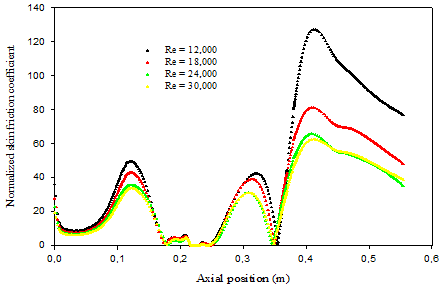
Figure 18. Profiles of normalized skin friction coefficient as function of Reynolds number along the hot channel wall
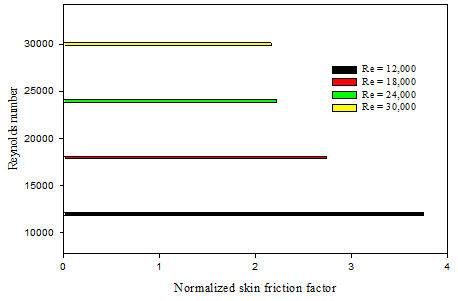
Figure 19. Normalized friction factor for various Re numbers
The profiles of the normalized skin friction coefficient along the hot top surface of the channel are shown in Figure 18. The friction values are almost constant after the fluid input due to its movement along parallel and regular lines.
The current is disturbed as it approaches the first detached baffle as part of the current moves towards the upper part of the channel. The friction values gradually increase as these values are super close to the upper area of the same baffle. The friction values are high behind this baffle due to the presence of recycling cells that push the current upward and contact the hot surface and thus increase the friction. The friction values gradually decrease due to the presence of the upper baffle, causing the current to drift downward and thus decreasing friction until it is missing at the point between the upper main and opposite currents. The friction values are then raised near the left side of the same baffle due to the presence of a small recycling cell where the current is stagnant in this area, and then decreases as the end of the cell ends until it is missing at the base of the baffle. Behind the upper fin, the current rises because of the presence of a large, strong-recycling cell near the left side of the same baffle and then decreases as a result of the end of the recycling cell extension. In the vicinity of the bottom baffle, the friction values increase very significantly as a result of the direction of the current towards the upper part of the channel with high flow velocities.
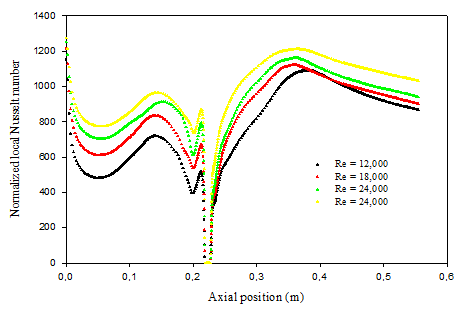
Figure 20. Profiles of normalized local Nusselt number as function of Reynolds number along the hot channel wall
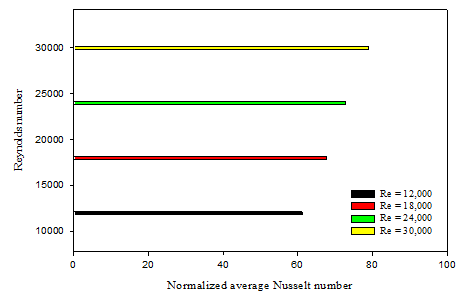
Figure 21. Variation of normalized average Nusselt number with Reynolds number
This increase was due to the presence of baffles especially the lower baffle and also due to the presence of recycling cells behind the last two baffles. In the latter, the friction values near the last baffle are reduced to the end of the output due to the decrease in the contact between the current and the hot area due to the severe collision, causing the current to drop and remove it from the hot surface. The friction values decrease for high Reynolds number values. Therefore, there is an inverse relationship between them. The higher the number of Reynolds; the less the friction values, which is confirmed in Figure 19.
Axial variation of normalized local Nusselt number profiles for the upper channel wall with various Reynolds number values is presented in Figure 20. The heat transfer rate values are increasing in the vicinity of the upper surfaces of the first and last baffles as a result of current deviation with high speeds towards the upper wall of the channel. The values of the thermal gradients in these areas increase, leading to significant thermal exchange and hence the acquisition of thermal energy. The heat transfer rate behind the upper baffle is also increased by the presence of a very strong recycling cell, where the fluid is constantly in contact with the hot space and thus a good thermal exchange. While heat exchange decreases next to the first baffle due to the direction of the current towards the bottom of the channel, and thus decrease in contact, and from the decline in heat exchange. In general, the thermal gradient increases in areas with high velocities, especially during the rise in Reynolds (see Figure 21), where recycling cells become more intense and therefore better heat exchange.
This paper presents a numerical simulation of a steady-state forced-convection in a rectangular Al2O3-H2O channel by inserting simple geometry baffles and fins. The mass, momentum and energy equations were solved using the finite volumes method. The problem solved by is potentially interesting for researchers and engineers working on solar collectors and aerospace industry. It is known that heat transfer enhancement can be achieved by creating longitudinal vortices in the flow. These vortices can be generated by detached and attached baffles, and a computational analysis of such heat exchangers is not a simple task. Therefore, we used a present-day commercial CFD code to solve the problem. As the number of obstacles increases the pressure drop also likely to increases. So that, the future work can study the effect of pressure drop. Also, future work will involve more complex geometries and using nanofluids to assess the optimum conditions for heat transfer enhancements.
[1] Chamkha AJ, Selimefendigil F. (2018). Numerical analysis for thermal performance of a photovoltaic thermal solar collector with SiO2-water nanofluid. Appl. Sci. 8: 2223-2240. https://doi.org/10.3390/app8112223
[2] Nazari S, Safarzadeh H, Bahiraei M. (2019). Performance improvement of a single slope solar still by employing thermoelectric cooling channel and copper oxide nanofluid: An experimental study. Journal of Cleaner Production 208: 1041-1052 https://doi.org/10.1016/j.jclepro.2018.10.194
[3] Ameri M, Eshaghi MS. (2018). Exergy and thermal assessment of a novel system utilizing flat plate collector with the application of nanofluid in porous media at a constant magnetic field. Thermal Science and Engineering Progress 8: 223-235. https://doi.org/10.1016/j.tsep.2018.08.004
[4] Bazdidi-Tehrani F, Khabazipur A, Vasefi SI. (2018). Flow and heat transfer analysis of TiO2/water nanofluid in a ribbed flat-plate solar collector. Renewable Energy 122: 406-418.
https://doi.org/10.1016/j.renene.2018.01.056
[5] Bellos E, Tzivanidis C. (2017). Performance analysis and optimization of an absorption chiller driven by nanofluid based solar flat plate collector. Journal of Cleaner Production 174: 256-272. https://doi.org/10.1016/j.jclepro.2017.10.313
[6] Edalatpour M, Solano JP. (2017). Thermal-hydraulic characteristics and exergy performance in tube-on-sheet flat plate solar collectors: Effects of nanofluids and mixed convection. International Journal of Thermal Sciences 118: 397-409. https://doi.org/10.1016/j.ijthermalsci.2017.05.004
[7] Genc AM, Ezan MA, Turgut A. (2018). Thermal performance of a nanofluid-based flat plate solar collector: A transient numerical study. Applied Thermal Engineering 130: 395-407. https://doi.org/10.1016/j.applthermaleng.2017.10.166
[8] Shamshirgaran SR, Assadi MK, Badescu V, Al-Kayiem HH. (2018). Upper limits for the work extraction by nanofluid-filled selective flat-plate solar collectors. Energy 160: 875-885. https://doi.org/10.1016/j.energy.2018.06.154
[9] Sint NKC, Choudhury IA, Masjuki HH, Aoyama H. (2017). Theoretical analysis to determine the efficiency of a CuO-water nanofluid based-flat plate solar collector for domestic solar water heating system in Myanmar. Solar Energy 155: 608-619. https://doi.org/10.1016/j.solener.2017.06.055
[10] Khan MS, Abid M, Ali HM, Amber KP, Bashir MA, Javed S. (2019). Comparative performance assessment of solar dish assisted s-CO2 Brayton cycle using nanofluids. Applied Thermal Engineering 148: 295-306. https://doi.org/10.1016/j.applthermaleng.2018.11.021
[11] Korres D, Bellos E, Tzivanidis C. (2019). Investigation of a nanofluid-based compound parabolic trough solar collector under laminar flow conditions. Applied Thermal Engineering 149: 366-376. https://doi.org/10.1016/j.applthermaleng.2018.12.077
[12] Boyaghchi FA, Chavoshi M. (2017). Multi-criteria optimization of a micro solar-geothermal CCHP system applying water/CuO nanofluid based on exergy, exergoeconomic and exergoenviron-mental concepts. Applied Thermal Engineering 112: 660-675. https://doi.org/10.1016/j.applthermaleng.2016.10.139
[13] Loni R, Pavlovic S, Bellos E, Tzivanidis C, Asli-Ardeh EA. (2018). Thermal and exergy performance of a nanofluid-based solar dish collector with spiral cavity receiver. Applied Thermal Engineering 135: 206-217. https://doi.org/10.1016/j.applthermaleng.2018.02.070
[14] Wang Y, Xu J, Liu Q, Chen Y, Liu H. (2016). Performance analysis of a parabolic trough solar collector using Al2O3/synthetic oil nanofluid. Applied Thermal Engineering 107: 469-478. https://doi.org/10.1016/j.applthermaleng.2016.06.170
[15] Bhalla V, Khullar V, Tyagi H. (2018). Investigation of factors influencing the performance of nanofluid based direct absorption solar collector using Taguchi method. Journal of Thermal Analysis and Calorimetry, 1-13. https://doi.org/10.1007/s10973-018-7721-x
[16] Ahmadi MH, Ramezanizadeh M, Nazari MA, Lorenzini G, Kumar R, Jilte R. (2018). Applications of nanofluids in geothermal: a review. Mathematical Modelling of Engineering Problems 5(4): 281-285. https://doi.org/10.18280/mmep.050402
[17] Vasanthakumari R, Pondy P. (2018). Mixed convection of silver and titanium dioxide nanofluids along inclined stretching sheet in presence of MHD with heat generation and suction effect. Mathematical Modelling of Engineering Problems 5(2): 123-129. https://doi.org/10.18280/mmep.050210
[18] Tahmasebi A, Mahdavi M, Ghalambaz M. (2018). Local thermal nonequilibrium conjugate natural convection heat transfer of nanofluids in a cavity partially filled with porous media using Buongiorno’s model. Numerical Heat Transfer, Part A: Applications 73(4): 254-276. https://doi.org/10.1080/10407782.2017.1422632
[19] Mehryan SAM, Ghalambaz M, Izadi M. (2019). Conjugate natural convection of nanofluids inside an enclosure filled by three layers of solid, porous medium and free nanofluid using Buongiorno’s and local thermal non-equilibrium models. Journal of Thermal Analysis and Calorimetry 135(2): 1047-1067. https://doi.org/10.1007/s10973-018-7380-y
[20] Mehryan SAM, Izadpanahi E, Ghalambaz M, Chamkha AJ. (2019). Mixed convection flow caused by an oscillating cylinder in a square cavity filled with Cu-Al2O3/water hybrid nanofluid. Journal of Thermal Analysis and Calorimetry, 1-18. https://doi.org/10.1007/s10973-019-08012-2
[21] Mehryan SAM, Kashkooli FM, Ghalambaz M, Chamkha AJ. (2017). Free convection of hybrid Al2O3-Cu water nanofluid in a differentially heated porous cavity. Advanced Powder Technology 28(9): 2295-2305. https://doi.org/10.1016/j.apt.2017.06.011
[22] Demartini LC, Vielmo HA, Möller SV. (2004). Numeric and experimental analysis of the turbulent flow through a channel with baffle plates. Journal of the Brazilian Society of Mechanical Sciences and Engineering 26(2): 153-159. https://doi.org/10.1590/S1678-58782004000200006
[23] Ghalambaz M, Doostani A, Izadpanahi E, Chamkha AJ. (2017). Phase-change heat transfer in a cavity heated from below: The effect of utilizing single or hybrid nanoparticles as additives. Journal of the Taiwan Institute of Chemical Engineers 72: 104-115. https://doi.org/10.1016/j.jtice.2017.01.010
[24] Ghalambaz M, Doostani A, Chamkha AJ, Ismael MA. (2017). Melting of nanoparticles-enhanced phase-change materials in an enclosure: Effect of hybrid nanoparticles. International Journal of Mechanical Sciences 134: 85-97. https://doi.org/10.1016/j.ijmecsci.2017.09.045
[25] Ghalambaz M, Jamesahar E, Ismael MA, Chamkha AJ. (2017). Fluid-structure interaction study of natural convection heat transfer over a flexible oscillating fin in a square cavity. International Journal of Thermal Sciences 111: 256-273. https://doi.org/10.1016/j.ijthermalsci.2016.09.001
[26] Chamkha AJ, Doostanidezfuli A, Izadpanahi E, Ghalambaz M. (2017). Phase-change heat transfer of single/hybrid nanoparticles-enhanced phase-change materials over a heated horizontal cylinder confined in a square cavity. Advanced Powder Technology 28(2): 385-397. https://doi.org/10.1016/j.apt.2016.10.009
[27] Ismael MA, Mansour MA, Chamkha AJ, Rashad AM. (2016). Mixed convection in a nanofluid filled-cavity with partial slip subjected to constant heat flux and inclined magnetic field. Journal of Magnetism and Magnetic Materials 416: 25-36. https://doi.org/10.1016/j.jmmm.2016.05.006
[28] Rashad AM. (2017). Impact of thermal radiation on MHD slip flow of a ferrofluid over a non-isothermal wedge. Journal of Magnetism and Magnetic Materials 422: 25-31. https://doi.org/10.1016/j.jmmm.2016.08.056
[29] Rashad AM, Ismael MA, Chamkha AJ, Mansour MA. (2016). MHD mixed convection of localized heat source/sink in a nanofluid-filled lid-driven square cavity with partial slip. Journal of the Taiwan Institute of Chemical Engineers 68: 173-186. https://doi.org/10.1016/j.jtice.2016.08.033
[30] Rashad AM, Rashidi MM, Lorenzini G, Ahmed SE, Aly AM. (2017). Magnetic field and internal heat generation effects on the free convection in a rectangular cavity filled with a porous medium saturated with Cu-water nanofluid. International Journal of Heat and Mass Transfer 104: 878-889. https://doi.org/10.1016/j.ijheatmasstransfer.2016.08.025
[31] Sivasankaran S, Mansour MA, Rashad AM, Bhuvaneswari M. (2016). MHD mixed convection of Cu-water nanofluid in a two-sided lid-driven porous cavity with a partial slip, Numerical Heat Transfer, Part A: Applications 70(12): 1356-1370. https://doi.org/10.1080/10407782.2016.1243957
[32] Ajeel RK, Salim WSIW, Hasnan K. (2019). Design characteristics of symmetrical semicircle-corrugated channel on heat transfer enhancement with nanofluid. International Journal of Mechanical Sciences 151: 236-250. https://doi.org/10.1016/j.ijmecsci.2018.11.022
[33] Menni Y, Azzi A, Chamkha AJ, Harmand S. (2018). Effect of wall-mounted V-baffle position in a turbulent flow through a channel: Analysis of best configuration for optimal heat transfer. International Journal of Numerical Methods for Heat & Fluid Flow, 1-31. https://doi.org/10.1108/HFF-06-2018-0270
[34] Chamkha A.J., Ismael M.A. (2014). Natural convection in differentially heated partially porous layered cavities filled with a nanofluid. Numerical Heat Transfer, Part A 65(11): 1089-1113. https://doi.org/10.1080/10407782.2013.851560
[35] Launder BE, Spalding DB. (1974). The numerical computation of turbulent flows. Computer Methods in Applied Mechanics and Engineering 3: 269-289. https://doi.org/10.1016/0045-7825(74)90029-2
[36] Patankar SV. (1980). Numerical heat transfer and fluid flow. McGraw-Hill, New York, NY.
[37] Leonard BP, Mokhtari S. (1990). Ultra-sharp nonoscillatory convection schemes for high-speed steady multidimensional flow. NASA TM1-2568, NASA Lewis Research Center, 1990.