Dhruvesh Mehta* | Prasanta Kundu | Anandita Chowdhury
OPEN ACCESS
To understand the behavior of dielectric liquids under non-homogenous electric field requires a test cell (to hold the liquid) and a combination of electrodes (to create non-uniform electric field). The uniformity of the electric field defines as Schwaiger Factor (ratio of mean to maximum electric field intensity). Paper deals with the concept of Schwaiger factor and influence of different test cell / electrode parameter on maximum and average electric field intensity using FEM based software analysis. The outcome of the FEM study of Schwaiger factor provides a ready reference for the dielectric researchers to develop a test cell and suitable electrode geometries to study the liquid dielectric’s partial discharge and breakdown characteristics.
dielectric liquids, partial discharge, Schwalger factor, electric field, permittivity, electrode, finite element method
Electrical machines contains different geometries of electrodes which creates different electric fields. Studies of Electric fields have been done in numerous applications over several decades. To provide better insulation between high voltages to other voltages or to earth, different states of dielectric insulation i.e. solid, liquid and gaseous is used in general. This dielectric materials are stressed under different electric fields in electrical machines. Reliable and satisfactory performance of the electrical equipment depends upon the design of its insulation structure to withstand the electric stress appearing across them under different test conditions and under different electrode configurations. The factor that governs the amount of electric stress on the dielectrics is known as the “electric field intensity”.
Knowledge of electric field intensity across dielectric medium helps to build a reliable, cost-effective, and robust insulation structure for any high voltage equipment. To optimally design insulation that could provide reliable performance of electric equipment, it is important to understand electric field intensity appearing across it. The main cause of the study is to limit the intensity across the dielectric at such a level so that there is no initiation of partial discharges. It is therefore worth estimating the electric field intensity in insulation [1-3]. The region around electrically energized equipment is filled with electric field lines. More the electric field lines passing through dielectric medium, more the electric field intensity is experienced by the dielectric [4]. This paper discusses the calculation method to derive mean and maximum electric field strength (ratio of which known as Schwaiger Factor) appearing across dielectric insulation under specific electrode geometries. The paper covers the concept and calculation methodology of Schwaiger Factor using FEM based ELAX-2D software from VIT, Ukraine. The base test cell model and electrode combinations are selected based on IEC 61294 [5]. In which, Test cell model is described to study the partial discharge Inception voltage of dielectric liquids. The constraints in the standard is that, it is not suitable to change the electrode combinations and distance between electrodes are fixed one. The Paper discusses the dependency of the Schwaiger factor on different Test cell and electrode parameters. The dependency of the parameters are validated using the same software discussed above. The paper firstly discuss the selection of the test cell diameter in view of Schwaiger factor which provide feasibility to change the electrodes without much affecting the electric field proposed in IEC 61294 [5]. Next the length of the needle electrode and then selection of different electrode geometry is discussed. With electrode geometry, the effect of earth electrode diameter is also checked. Another major factor that affects the Schwaiger factor is the distance between electrodes is also studied for different gap between electrodes. Paper also covers the presence of different permittivity material between electrode and their effect on Schwaiger factor. Also, presence of solid and liquid dielectric mixture between electrodes is also discussed in view of Schwaiger factor. Lastly, the applied voltage amplitude effect on the Schwaiger factor is discussed. Discussion in the paper gives a broader view to the researcher to carry out the dielectric material study to understand the partial discharge or breakdown characteristics. The outcome of the studies help the future dielectric insulation researcher to have clear idea about the design of the test cell to carry out the partial discharge behavior of the dielectric liquids. Also, paper helps to decide the needle electrode parameters and share the dimensions of the other electrodes to be used in such studies.
Electric filed configurations are generally categorized into two i.e. uniform electric field and non-uniform electric field. In a ‘Uniform Field’, the equipotential lines are linearly distributed and the electric field intensity is constant in the main field space between the two electrodes. Significant physiognomies of this type of field is that the insulation breakdown takes place without any substantial partial discharges (Ui=Ub). “Non-Uniform Field” is classified further due to its specific behavior as “weakly non-uniform field” and “extremely non-uniform field”. In weakly non-uniform fields, No partial discharges occurs before the complete breakdown in the dielectrics just like uniform field. But, in an “extreme non-uniform field”, the electric field intensity is strongly non-uniform and the potential distribution is extremely nonlinear. Due to this, the insulation breakdown takes place after stable partial discharges (Ui<<Ub). This type of electric field is most critical which hinders the performance of the dielectric, yet usually found in electrical apparatus. In this configuration, the dielectrics have to go through highest electrically stressed condition which affects the performance of the dielectric. In this situation, dielectric is exposed to high electric stress at needle tip of the electrode, but elsewhere between the electrodes it is stressed moderately. Behavior of dielectrics strongly depends upon the type of field they are subjected to. No stable Partial Discharge (PD) occurs under uniform and weakly non-uniform field condition. The transition from weakly to extremely non-uniform field in a dielectric accompanies with Partial Discharge (PD) or corona inception [1, 6-10].
Different dielectric fields are differentiated using degree of uniformity. The degree of uniformity η introduced by Schwaiger in 1992 as a measure of the uniformity of a field is defined as follows:
“Degree of uniformity of a field” is defined as the ratio of mean to maximum electric field intensities in a given electrode configuration [1, 6-10].
Schwaiger Factor, $\eta=\frac{E_{\text {mean }}}{E_{\max }}=\frac{U}{d} * \frac{1}{E_{\max }}$
Or
$U=E_{\max } * \eta * \mathrm{d}$
Emean - Peak values of the mean electric field intensities in dielectric
Emax - Peak values of the maximum electric field intensities in a dielectric
U-Peak value of potential difference applied between the two electrodes at a distance‘d’ apart.
The value of η also represents the degree of utilization of the dielectric between two electrodes. A higher the value of η represents better utilization of the insulating properties of a dielectric. Thus η, a dimensionless quantity, enables a comparison of the uniformity of field configuration formed between different electrodes. The value of η lies between 0 ≤ η ≤ 1. Knowledge of the value for η serves to understand the electric stress appearing across dielectric medium, and provides important information to design a better insulation structure for high voltage equipment. For determining the exact magnitude of maximum electric stress, numerical estimation techniques like empirical formulas are available to calculate.
Schwaiger factor calculation requires average electric field intensity and maximum electric field intensity for a particular electrode system across dielectric insulation medium. This paper calculate Schwaiger factor using electrode system (needle electrode (NE) and spherical electrode (SE)) in accordance with IEC 61294 [5] with 50 mm gap between them in mineral oil dielectric medium. In the older days, High voltage sources are not available to test insulation system for partial discharge test. Therefore, partial discharge test is performed using very sharp needle with tip radius in the range of 3 µm to generate equivalent amount of stress at lower voltage level to obtain similar kind of results. This concept is known as field equivalence principle. But, now-a-days high voltage sources are viable so one can choose needle tip radius equivalent to 0.3 mm or 0.5 mm which can reproduce the sharpest point available inside any electrical equipment. In this paper, needle tip radius considered is of 0.3 mm i.e. in view of minimal sharpest point available in transformers. The test cell used for simulation purpose is of 100 mm diameter to facilitate change of electrodes. FEM based software is used for simulation purpose. As a result of simulation, average electric field intensity and maximum electric field intensity is obtained from which one can calculate Schwaiger factor. Figure 1 shows the maximum electric field intensity and its location in the subjected electrode system.
Electrode system under consideration: Needle Electrode to Spherical Electrode
Maximum Electric Field Strength: 10.45 kVrms/mm (From Figure 2)
Gap Distance between electrodes: 50 mm.
Figure 1. Electric field distribution & Maximum Field strength location for NE – SE electrode system
To calculate the average electric field intensity,
Avg. Electric Field Intensity $=\frac{\text { Applied voltage between electrodes }}{\text { Distance between electrode }}$ (1)
Average Electric Field intensity $=\frac{100}{50}$ $=2.0\left(\frac{\mathrm{kV}}{\mathrm{mm}}\right)$ (2)
Schwaiger Factor, $\eta=\frac{E_{\text {mean }}}{E_{\max }}=\frac{2.0}{10.45} =0.1914$ (3)
Even though upmost cares have been taken during design and production of electrical equipment’s to avoid a strong non-uniform field. But there is always the probability for presence of manufacturing defects due to protrusion on the copper conductor, impurities resulting from long term in-service deprivation due to presence of particle and moisture in the oil, which could cause local electric field enhancement (non-uniform field) and thus might initiate a partial discharge. To study behavior of dielectric materials, world over researchers generates different electric fields using different types of electrode like, needle, spherical, plate/plain, and partially spherical and can add non-uniformity with different gap distances. A needle electrode is used to generate highly non-uniform electric field. In any high voltage electrical equipment, experiences different test voltages under normal operating conditions and under different test voltage condition. To withstand this voltages, different dielectric medium having different dielectric constant are used. Also, presence of different mechanical support structures made of dissimilar materials produces dissimilar shapes of electrodes. All these parameters are influencing aspects to Schwaiger factors. To check the dependency of the Schwaiger factor on above mentioned parameters FEM based study is conducted to thoroughly discuss and analyse their influence. In this paper three pairs of electrode configurations are used to generate non-uniform electric field i.e. needle-plain electrode configuration, needle-sphere electrode configuration and needle - partial spherical electrode configuration. By placing different gap distance between above mentioned electrode configurations and apply power frequency voltages, one can generate different non-uniform electric fields.
4.1 Schwaiger factor as a function of test cell diameter
To understand the dielectric behavior of the insulating liquids, a test cell need to be developed. In IEC 61294, construction of Test cell to measure partial discharge performance is explained. According to IEC, test diameter considered is 40 mm. But to understand the behavior of the dielectric medium under different electrode geometries, one needs to replace electrodes of different geometries. For that, test cell diameter should be such that human hand can access inside the test cell. To fulfil this requirement, higher diameter test cell is required.
Table 1. Emax, Emean and Schwaiger factor as a function of test cell diameter for needle to spherical electrode system, 50 mm gap distance in between and 100 kV applied voltage
|
Test Cell diameter (mm) |
Maximum electric field intensity (kV/mm) |
Average electric field intensity (kV/mm) |
Schwaiger Factor |
|
40 |
10.77 |
2.00 |
0.19 |
|
80 |
12.09 |
2.00 |
0.17 |
|
100 |
13.50 |
2.00 |
0.15 |
|
150 |
13.21 |
2.00 |
0.15 |
|
200 |
12.84 |
2.00 |
0.15 |
Therefore, this paper studies the influence of test cell diameter on Schwaiger factor using needle – spherical electrode system. The obtained result shows that Schwaiger factor is dependent on the diameter of the test cell as the maximum field strength is changed as diameter changes. Table 1 shows the obtained results for different test cell diameter with same voltage level, 50 mm gap distance and needle to spherical electrode configuration.
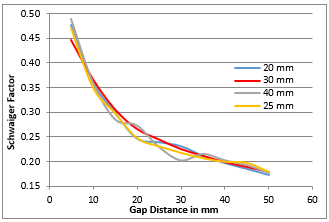
4.2 Schwaiger factor as a function of needle length
In the older days, high voltage is not available to test insulation system for partial discharge test. Therefore, according to IEC 61294, very sharp needle with tip radius of only 3µm is described to perform test. But now-a-days high voltage resources are easily available to generate required test voltages at a very low PD levels. The same point of field of equivalence discussed in section 3 is also applicable here. In any electrical equipment, smallest/minimum sharp point available is considered as 0.5 mm or least 0.3 mm. Therefore, standards may be revised accordingly to accommodate the revised tip radius of the needle. Also, length of the needle specified in IEC 61294 is 25 mm. Result obtained from the study is tabulated in Table 2. Figure 2 shows the Schwaiger Factor as a function of Needle Length and gap distance. From the obtained results, it can be concluded that for up to 50 mm Gap analysis, 30 mm needle length gives much more smooth results compared to other needle length. Therefore, standards may be revised accordingly to accommodate the revised needle length of 30 mm.
Table 2. Emax, Emean and Schwaiger factor as a function of Needle Length for needle to spherical electrode with 100 kV applied voltage
|
Needle Length (mm) |
Maximum electric field intensity (kV/mm) |
Average electric field intensity (kV/mm) |
Schwaiger Factor |
|
20 |
20.451 |
5.03 |
0.24595 |
|
25 |
20.356 |
5.03 |
0.2471 |
|
30 |
18.824 |
5.00 |
0.2656 |
|
40 |
18.246 |
5.00 |
0.2740 |
Figure 2. Schwaiger factor as a function of needle length for needle – sphere electrode geometry and 100 kV applied voltage
4.3 Schwaiger factor as a function of Electrodes Geometry
Electrical equipment and their performance can be realized by experimental work. To represent the electrical equipment geometry and their insulation arrangements, different size and shapes of electrodes are developed by researchers worldwide. These electrodes and their study on performance of the insulating material give important information about performance of the insulation structure. These electrodes represent and demonstrate the electric field distribution inside different equipment. Many standards give the detail about various electrodes, their shapes and dimensions. Partially spherical electrode made from brass material with 25 mm radius is defined in IEC 60156 [11]. Spherical electrode with 12.5 to 13 mm diameter is defined in ASTM 2275 [12]. Disk (Plain) electrode constructed from brass as disks with 25.4 mm diameter in accordance with ASTM D 887/887M – 13 [13]. Needle electrode is described in IEC 61294 [5] with 3μm tip radius.
Table 3. Emax, Emean and Schwaiger factor as a function of electrode geometry for 50 mm gap distance and 100 kV applied voltage
|
Electrode system |
Gap Distance (mm) |
Maximum electric field intensity (kV/mm) |
Average electric field intensity (kV/mm) |
Schwaiger Factor |
|
Partially Spherical to Partially Spherical |
50 |
2.68 |
2.00 |
0.75 |
|
Spherical to Spherical |
50 |
4.06 |
2.00 |
0.49 |
|
Needle to Spherical |
50 |
13.02 |
2.01 |
0.15 |
|
Needle to Plain |
50 |
13.25 |
2.01 |
0.15 |
|
Needle to Partially Spherical |
50 |
11.86 |
2.00 |
0.17 |
|
Spherical to Plain |
50 |
4.17 |
2.00 |
0.48 |
|
Plain to Plain |
50 |
2.29 |
2.00 |
0.87 |
|
Partially Spherical to Plain |
50 |
2.71 |
2.00 |
0.74 |
Results obtained for different shapes of electrodes are tabulated in Table 3 keeping same gap distance and voltage levels. The needle-sphere electrode is a typical configuration which will lead to non-uniform electric field distribution along the needle-sphere axis. It represents the spindle-shaped defect. The electric field near both electrodes will be stronger than field within the middle of the gap. The electric field distribution along the needle-sphere axis is in a U shape, which means both the generation rate and the velocity of charge carriers will be higher in the region near both electrodes than in the gap middle. A needle-plate electrode configuration is another kind of electrode setup which will lead to non-uniform electric field distribution. It represents a cone-shaped defect. Electric field strength near the needle electrode is very strong and decreases rapidly along the axis [13]. Needle to partial spherical electrode represents non-uniform electric distribution more than needle to plate electrode and lesser than needle - sphere electrode combinations.
4.4 Schwaiger factor as function of earth/ground electrode diameter
To study the influence of different diameter of the earth electrode on Schwaiger factor, spherical shape earth electrode along with varied diameter of 12.7 mm, 25 mm, 50.8 mm and 75 mm is analyzed. Electrode system used here is Needle electrode with spherical electrode of different diameter with 50 mm gap between them. The result of the analysis is as given in Table 4.
Table 4. Emax, Emean and Schwaiger factor as a function of ground electrode diameter for 50 mm gap distance between needle to spherical electrode with 100 kV applied voltage
|
Electrode diameter (mm) |
Maximum electric field intensity (kV/mm) |
Average electric field intensity (kV/mm) |
Schwaiger Factor |
|
12.70 |
12.98 |
2.00 |
0.15 |
|
25.40 |
20.94 |
2.00 |
0.10 |
|
50.80 |
21.90 |
2.00 |
0.09 |
|
75.00 |
22.31 |
2.00 |
0.09 |
For any dielectric liquids, presence of impurities is always there due to which the breakdown strength is determined by the “weak link”. Statistical study of electrical breakdown strength of dielectric medium is based on the weakest region in the oil, specifically, the area that stressed to the extreme and by the volume of oil contained within. In non-uniform fields, the stressed oil volume is taken as the volume which is contained between the maximum stress (Emax ) contour and 0.9 (Emax) contour [15]. According to the Stress volume principle as explained in reference [16-18], the insulation strength reduces as its stress volume increase for both power frequency and impulse voltages. According to this theory the breakdown strength is inversely proportional to the stressed oil volume. Increased diameter of electrode increases the volume of the dielectric medium under stress, which increases the possibility of partial discharge inception. The same can be reflected in increased maximum electric field intensity with increase in the diameter of the earth electrode.
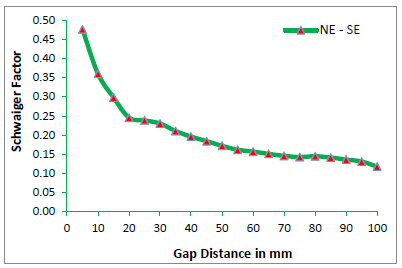
4.5 Schwaiger factor as a function of gap distance between electrodes
In electrical equipment, distance between live and ground electrode is differed according to voltage class requirements. Therefore, it is necessary to understand the influence of gap distance on Schwaiger factor. To understand the effect of gap distance between electrodes on Schwaiger factor, Needle to Spherical electrode system is analyzed for different gap distance in the range from 5 mm to 100 mm. The obtained results are shown in Figure 3. The same stress volume principle discussed in section 4.4 is applicable here as well. As distance between electrodes increases, area under electrodes which is stressed is increased and therefore partial discharge probability increases with increase in gap distances.
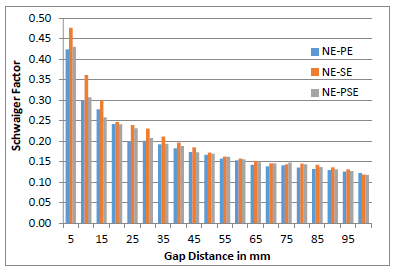
To understand the influence of electrode geometry and gap distance simultaneously, Figure 4 show case the obtained results. From the results it can be concluded that needle to sphere electrode provides highest non-uniform field amongst all the other combination at any gap distances. But still, the maximum electric field is highest for needle to plain electrode geometry amongst all combination; development of partial discharge is highest in them.
Figure 3. Schwaiger factor as a function of gap distance between needle to spherical electrode system with 100 kV applied voltage
Figure 4. Schwaiger factor as a function of gap distance for different electrode configuration with applied voltage of 100 kV
4.6 Schwaiger factor as a function of different dielectric material between electrodes
Different dielectric materials have different permittivity (dielectric constant). This may affect the electric field distribution in electric equipment. To understand the effect of different dielectric material on Schwaiger factor, different insulating liquids with different dielectric constant (permittivity) is analysed using FEM based software. Here, mineral oil (permittivity – 2.2), natural ester liquid (permittivity – 3.1), synthetic ester liquid (permittivity – 3.2) is analysed to check the effect on Schwaiger Factor. Table 5 discuss the analysis results. From the obtained result it can be concluded that there is no effect on Schwaiger factor due to different dielectric materials (only 1 dielectric material with same dielectric constant) in between same electrode geometry.
4.7 Schwaiger factor as a function of mix dielectrics
Section 4.6 discuss about the influence of dielectric medium on Schwaiger factor. In this case, the material in between electrode system is of one single dielectric medium (uniform permittivity) and therefore there is no effect of different dielectric medium on Schwaiger factor though permittivity is different. But, when two materials having different permittivity are used in between the electrodes as a mix dielectric, maximum electric field and average electric field distribution is governed by both materials’ relative permittivity. The analysis is performed using mineral oil (permittivity 2.2) / natural ester liquid (permittivity 3.1) with pressboard material (permittivity 4.4) under needle to plain electrode configuration with 100 kV applied voltage for different combination of oil duct and pressboard sheet thickness. Results of the analysis are tabulated in Table 6. The obtained results are showing the dominance of mix dielectric medium on Schwaiger factor. Thickness of the solid insulation (pressboard) increases against the oil duct size, Schwaiger factor is hampered badly. This means, to design a better insulation, selection of the combination of solid insulation and liquid insulation play a major role.
Table 5. Emax, Emean and Schwaiger Factor as a function of Dielectric Constant for 50 mm Gap Space, applied voltage of 100 kV and using needle to spherical electrode system
|
Dielectric Liquids |
Permittivity |
Maximum electric field intensity (kV/mm) |
Average electric field intensity (kV/mm) |
Schwaiger Factor |
|
Mineral oil (MO) |
2.2 |
13.50 |
2.00 |
0.15 |
|
Natural ester liquid |
3.1 |
13.50 |
2.00 |
0.15 |
|
Synthetic ester liquid |
3.2 |
13.50 |
2.00 |
0.15 |
Table 6. Emax, Emean and Schwaiger Factor as a function of composite Dielectric material (i.e. oil + pressboard) under needle to plain electrode system with 100 kV applied voltage and at mentioned gap distance
|
Dielectric materials (permittivity) |
Maximum electric field intensity (kV/mm) |
Average electric field intensity (kV/mm) |
Schwaiger Factor |
|
10 mm Oil Duct (2.2) + 3 mm P.B. (4.4) |
30.780 |
9.14 |
0.2969 |
|
10 mm Oil Duct (2.2) + 5 mm P.B. (4.4) |
26.565 |
8.54 |
0.32 |
|
10 mm Oil Duct (2.2) + 7 mm P.B. (4.4) |
10.660 |
7.89 |
0.74 |
|
10 mm Oil Duct (2.2) + 10 mm P.B. (4.4) |
10.260 |
7.31 |
0.71 |
|
10 mm Oil Duct (3.1) + 3 mm P.B. (4.4) |
30.780 |
9.14 |
0.2969 |
|
10 mm Oil Duct (3.1) + 5 mm P.B. (4.4) |
26.565 |
8.54 |
0.32 |
4.8 Schwaiger factor as a function of applied voltage
To check the dependency of Schwaiger factor on different voltage levels, the needle – spherical electrode system explained in section 3 is analysed with application of different magnitude voltages. Table 7 gives the result of study and calculated Schwaiger factor. From the result it can be concluded that Schwaiger factor remains same for higher magnitude voltage levels under same electrode geometry and gap distance. But, higher magnitude of voltages will lead to more intense electric field across the dielectric medium which increases the chance of early partial discharges in the insulation.
Table 7. Emax, Emean and Schwaiger factor as a function of applied voltage for 50 mm gap distance using needle to spherical electrode system
|
Voltage Levels (kV) |
Maximum electric field intensity (kV/mm) |
Average electric field intensity (kV/mm) |
Schwaiger Factor |
|
50 |
6.51 |
1.00 |
0.15 |
|
100 |
13.50 |
2.00 |
0.15 |
|
150 |
20.25 |
2.99 |
0.15 |
This paper presents a study concerning the factors influencing the Schwaiger Factor in Liquid Dielectric medium. FEM based analysis have been conducted to study the influence of magnitude of applied voltage, gap distance, electrode geometry, Electrode Diameter, Needle Electrode Length, and test cell diameter on Schwaiger Factor. Discussion of influencing parameters to Schwaiger Factor serves as a ready reference to the high voltage researchers to design a suitable test cell to measure either partial discharge or breakdown voltages of different liquid dielectric medium. Analysis based on the simulation results explains the mechanism of how these affect the Schwaiger Factor. The results may be summarized as follows:
[1] Arora, R., Mosch, W. (2011). High Voltage and Electrical Insulation Engineering, A John Wiley & Sons, Inc., Publication, IEEE Series on Power Engineering, Band 57, 2011.
[2] Venkatesan, S. (2014). Study of the behavior of transformer insulation under non-standard impulse voltages, Ph.D. Dissertation, Faculty of Electrical and Electronics Engineering, Anna University, November 2014. http://hdl.handle.net/10603/27573
[3] Kuffel, E., Zaengl. W.S., Kuffel J., High Voltage Engineering, 2nd Edition, 2000, published by Butterworth – Heinemann
[4] Yusoff, N.A. (2015). Effect of field utilization factor on air breakdown level under lightning impulse (Doctoral dissertation, Universiti Tun Hussein Onn Malaysia). http://eprints.uthm.edu.my/id/eprint/7794/1/NOOR_AIN_BINTI_YUSOFF.pdf
[5] IEC 61294: Insulating Liquids – Determination of the Partial Discharge Inception voltage (PDIV) – Test Procedure.
[6] Holtzhausen, J.P., Vosloo, W.L. (2014). High Voltage Engineering Practice and Theory. Stellenbosch, Western Cape.
[7] NPTEL IIT Kanpur –online lecture series
http://nptel.iitk.ac.in/courses/Webcourse-contents/IIT-KANPUR/HighVoltageEngg/ui/Course_home1_2.html
[8] Haegele, S., Vahidi, F., Tenbohlen, S., Rapp, K. J., & Sbravati, A. (2018). Lightning impulse withstand of natural ester liquid. Energies, 11(8): 122-134. https://doi.org/10.3390/en11081964
[9] Chakravorti, S. (2015). Electric Field Analysis, Taylor & Francis Geoup, CRC Press.
[10] Naidu, M.S., NAIDU, M.K. (2013). High voltage engineering. Tata McGraw-Hill Education.
[11] IEC 60156–1995-07: Insulating Liquids–Determination of the breakdown voltage at power frequency–Test Method.
[12] ASTM-D2275-01-Stadard Test Method for voltage endurance of Solid Electrical Insulating Materials Subjected to Partial Discharge (Corona) on the Surface.
[13] ASTM D877/D877M – 13: Standard Test Method for – Dielectric Breakdown voltage of Insulating Liquids Using Disk Electrodes.
[14] Sima, W., Jiang, C., Lewin, P., Yang, Q., Yuan, T. (2013). Modeling of the partial discharge process in a liquid dielectric: Effect of applied voltage, gap distance, and electrode type. Energies, 6(2): 934-952. https://doi.org/10.3390/en6020934
[15] HIGH VOLTAGE ENGINEERING(3:1:0), 8 th Sem. B.Tech(Electrical), VSSUT http://www.vssut.ac.in/lecture_notes/lecture1423723357.pdf
[16] Hill, L.R., Schmidt, P.L. (1948). Insulation breakdown as a function of area. Transactions of the American Institute of Electrical Engineers, 67(1): 442-446. https://doi.org/10.1109/T-AIEE.1948.5059695
[17] Wilson, W.R. (1953). A fundamental factor controlling the unit dielectric strength of oil [includes discussion]. Transactions of the American Institute of Electrical Engineers. Part III: Power Apparatus and Systems, 72(1): 68-74. https://doi.org/10.1109/AIEEPAS.1953.4498604
[18] Nelson, J.K., Salvage, B., Sharpley, W.A. (1971, February). Electric strength of transformer oil for large electrode areas. In Proceedings of the Institution of Electrical Engineers, 118(2): 388-393. https://doi.org/10.1049/piee.1971.0071