R. Dhasarathan | S. Aejitha | B. Kavitha | H. Aswathaman | N. Senthilkumar | S. Rani*
© 2023 IIETA. This article is published by IIETA and is licensed under the CC BY 4.0 license (http://creativecommons.org/licenses/by/4.0/).
OPEN ACCESS
The electrochemical studies of Eosin Y on glassy carbon electrode were carried out in the different pH conditions by cyclic voltammetey, Chronocoulometry, Controlled potential coulometry and reaction mechanism. The effect of pH on the peak current and peak potential was studied at different pH media. Maximum peak current was observed only at pH 4.0. It was chosen as the best pH for studying the electroanalytical behaviour of eosin Y. Cyclic voltammograms were recorded in the potential range from -1000 V to 1000 mV. The voltammogram shows one oxidation peak at 814.4 mV with peak currents 3.46 $\mu \mathrm{A}$ and reduction peak with higher current of 6.4 $\mu \mathrm{A}$ in the backward scan at -704.5mV. A well-developed voltammetric peak probably related to the cathodic reduction of carbonyl group was obtained in pH 4.0 acetate buffer at -704 mV. An irreversibility nature of the reduction process was confirmed by cyclic voltammetric technique. From the slope value observed from the plot of Q vs. t1/2, the diffusion coefficient was calculated. The number of electrons involved in the overall process was calculated by substituting the diffusion coefficient ‘D’ calculated from chronocoulometry. The number of electrons transferred was 2 for reduction per molecule and 1 for oxidation in all the selected pH conditions was measured through controlled potential coulomogram. The oxidation involved irreversible one electron transfer around 800 mV, a potential where the oxidation of phenolic OH group took place. Hence the oxidation peak is due to the oxidation of phenolic OH group to the corresponding radical.
Eosin Y dye, glassy carbon electrode, chronocoulometry, controlled potential coulometry
Nowadays, commercially prepared hematoxylin and eosin solutions are generally used as a stain in laboratories [1, 2]. Eosin is a xanthenes dye, which has fluorescent property and binds to the salts of eosinophilic substances with a positive charge. The eosin-Y has been used as an electrode modifier for the determination of electrochemically active and inactive molecules [3-7]. Eosin-Y dye was determined in most researches that involved HPLC and HPLC-fluorescence, spectrophotometry spectral analysis and fluorescence method [8]. Due to the low content of these synthetic dyes in some commercial samples and sea water, a powerful electrochemical method was applied to improve the sensitivity and selectivity as needed. In comparison to other analytical procedures, the proposed stripping voltammetric method reduced the length of real time of determination since no pre-treatment steps were requested. Dyes are extremely relevant because food quality and flavor are often associated with colors. Concerning the importance of the identification and characterization of food dyes in food science, this work presents a screening method using voltammetry of immobilized microparticles for identification in solid state of dyes [9]. Among analytical methods, which are frequently applied for the determination of food azo dyes, the most extensively used are spectrophotometry [10], high performance liquid chromatography [11], and capillary zone electrophoresis [12]. However, these methods are not always available and require expensive equipment and reagents. In recent years, the electrochemical methods are widely applied to food analysis [13, 14] and they can successfully compete with traditional analytical methods because of inexpensive instrumentation, fast response, simple operation, suitability to the analysis of much diluted samples, time saving, and high sensitivity accompanied by satisfactory selectivity, precision, and accuracy.
In this paper, an excellent electrochemical activity toward the redox behaviour of eosin Y dye on GCE. The electrochemical behavior of eosin Y was investigated by CV and differential pulse voltammetries (DPV). The results show that the eosin Y exhibits attractive. The work was carried out to provide a low capital cost, economical.
2.1 Materials
Reagent Eosin Y also called C.I. 45380 or Acid Red 87, was purchased from Sigma Aldrich, carbon Nano powder C. I 7440-44-0 from Merck. The stock solutions of eosin Y were prepared by dissolution of the appropriate amounts of dyes in deionized water, taking into consideration the purity of the dyes and stored in the fridge. The calibration solutions of different concentrations were prepared from stock solutions by dilution with supporting electrolyte.
2.2 Instrumentation
Electrochemical measurements were carried out on a CHI 650 C electrochemical analyzer (CH Instruments Inc., USA). The voltammetric measurements were carried out in a 10 ml single compartment three electrode glass cell with Ag/AgCl as a reference electrode, a platinum wire as counter electrode and a GCE as the working electrode. Potentials applied against the Ag/AgCl (3 M KCl). The pH measurements were performed with Elico LI 120 pH meter (Elico Ltd., India). All experiments were carried out at an ambient temperature of 25℃±0.1℃.
Purging and blanketing of nitrogen were done for analyte solution placed in the electrochemical cell of 15 ml capacity for 15 minutes under stirred conditions. Then various voltammograms were recorded. To get reproducible results, great care was taken in the electrode pretreatment. The glassy carbon electrode was pretreated in two ways: Mechanical polishing over a velvet micro-cloth with an alumina suspension and electrochemical treatment by applying a potential of +1.5V for 5 seconds. The electrochemical pretreatment was done in the same supporting electrolyte solution in which the measurements were carried out.
3.1 Cyclic voltammetric studies of Eosin Y
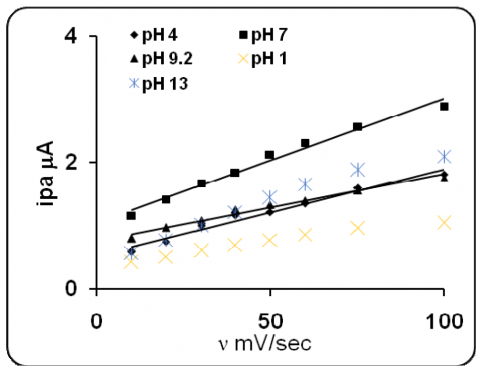
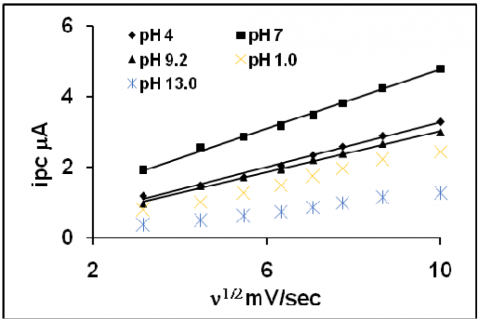
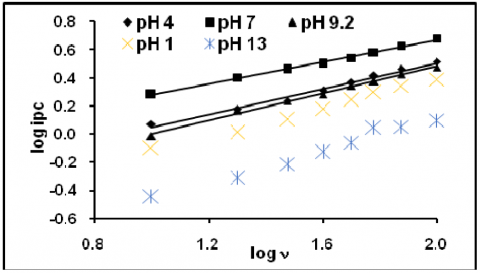
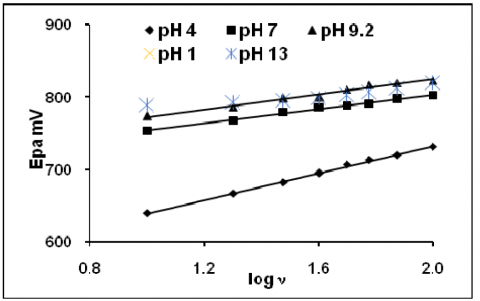
The figure 1 represents the cyclic voltammogram of 200 ppm eosin Y obtained at five different pHs. Similar characteristics were observed as in all pHs, but the peak current was varied. The anodic and cathodic both peak current responses were considered for further discussion. The effect of scan rate and the effect of concentration were studied. Peak current increased linearly with increase in scan rate (Fig2&3). The linear plot, peak current vs. v1/2 (Fig 4&5) with good correlation and the slope obtained from the linear plot log peak current vs. log scan rate (Fig.6&7) indicated that the reaction was controlled by diffusion. The fractional an calculated from the slope of the straight line plot -Ep vs. log v (Fig.8&9) and the absence of reversible peak suggested irreversible electrons transfer. The peak current increased with increase in concentration. There was no appreciable cathodic shift. Similar trends were observed for anodic peaks.
Figure 1. Cyclic voltammogram of eosin Y on GCE with scan rate 50 mV/s at different pHs
Figure 2. Plot of cathodic peak current vs scan rate
Figure 3. Plot of anodic peak current vs scan rate
Figure 4. Plot of cathodic peak current vs square root scan rate
Figure 5. Plot of anodic peak current vs square root scan rate
Figure 6. Plot of log cathodic peak current vs log scan rate
Figure 7. Plot of log anodic peak current vs log scan rate
Figure 8. Plot of cathodic peak potential vs log scan rate
Figure 9. Plot of anodic peak potential vs log scan rate
3.2 Effect of pH
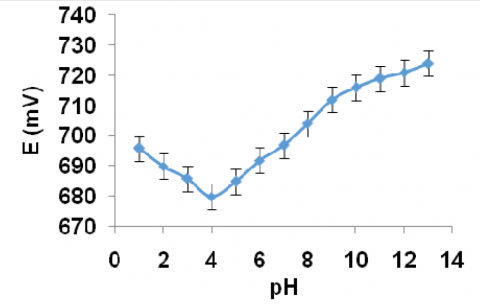
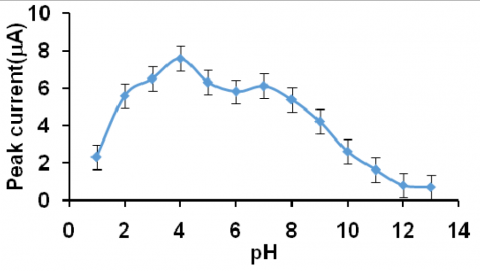
The detailed study about the effect of pH on the cyclic voltammetric response of 200 ppm eosin Y was carried out at 50 mV/s scan rate. The cathodic peak potential and the peak current were measured and correlated with pH. The plots peak potential vs. pH (Fig. 10) and peak current vs. pH (Fig. 11) showed the following results,
1. The peak potential increased upto pH 4.0 and then decreased. Maximum peak potential was observed at this pH.
2. Peak current decreased initially, then increased and reached maximum at pH 4.0. After the pH 4.0, it decreased and then increased little.
From the above information, it was concluded that pH 4.0 was chosen as the best medium for electrochemical determination studies of eosin Y.
Figure 10. Curve of peak potential of eosin Y against pH
Figure 11. Curve of peak current of eosin Y against pH
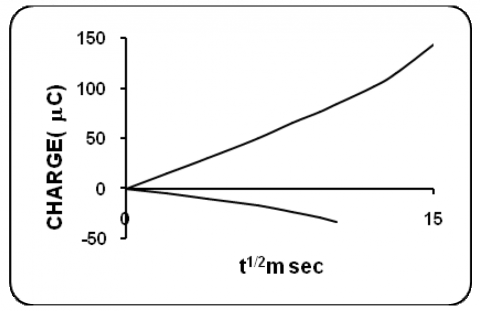
3.3 Chronocoulometry
Chronocoulometric experiments were carried out at 1.25x10⁻⁷M/cm3 concentration of eosin Y in all the three selected aqueous pH media. A representative chronocoulomogram is presented in figure 12. The experiments were carried out as described earlier at the appropriate potential range. From the slope of the straight line portion in the plot Q vs. t1/2, diffusion coefficient values were calculated and are presented in table. The rounded of “n” values were taken for the calculation of D values. The number of electrons involved in the overall process was calculated by substituting the diffusion coefficient ‘D’ from chronocoulometry and an values from voltammetric studies in Randles Sevcik equation for irreversible response. The n values were calculated for all the three selected pH media. This was further confirmed by controlled potential coulometry.
Figure 12. Chronocoulometric behaviour of eosin Y dye
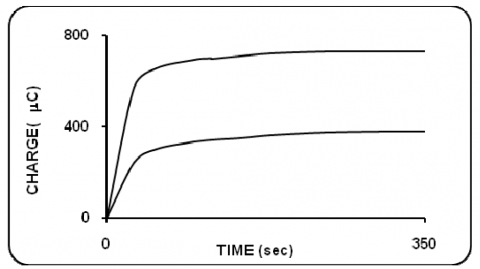
3.4 Controlled potential coulometry
In all selected pH, coulometric number of electrons transferred was calculated from the charge consumed for the exhaustive electrolysis of the compound at the appropriate potential. The concentration of eosin Y was 3.7x10⁻⁹M/dm3. Typical coulomogram, charge vs. time is presented in figure 13. The number of electrons transferred were 2 and 1 for reduction and oxidation respectively.
Figure 13. Controlled potential coulometry behaviour of eosin Y
3.5 Reduction mechanism
The experimental evidences presented above revealed that the electrochemical reduction of eosin Y was diffusion controlled and irreversible. The number of electrons transferred was found to be 2. The reduction potential was around -900 mV which was characteristic of the reduction of conjugated carbonyl system. Hence, on the basis of above discussions, the following probable mechanism is proposed.
The oxidation involved irreversible one electron transfer around 800 mV, a potential where the oxidation of phenolic OH group took place. Hence the oxidation peak is due to the oxidation of phenolic OH group to the corresponding radical.
3.6 Differential pulse Stripping Voltammetry
The stripping voltammetry was carried out cathodically since cathodic current at was higher. The concentration of the solution taken for stripptng process was 300 ppb. Trial experiments leading to optimisation of the various parameters were carried out and the results are given in table. The factors affecting the electrode process that are responsible for the determination are discussed as follows.
Many preconcentration voltammograms were performed for different accumulation potentials (Eacc) varying from 400 to -400 mV and deposition time (DT) varying from 20 to 120 sec in order to understand the electrochemical behaviour of eosin Y. The results indicated that maximum peak current was observed in the positive region at -400 mV and deposition time 80 sec. These parameters were chosen as optimum for further studies.
The initial potential was studied in the range between 200 and -200 mV. High current was observed at 0 mV. Hence 0 mV was chosen as optimum for further studies.
The pulse height was varied from 25 to 125 mV. Peak current observed to be linearly depended on the pulse height up to 100 mV and hence 100 mV was chosen as the optimum pulse height for further studies because of high current response.
Effect of pulse width was varied from 15 to 75 msec. The maximum Peak current was observed at 25 msec. Above this pulse width the peak current decreased continuously. Hence for further studies, 25 msec pulse width was chosen as an optimum.
The effect of scan increment showed that the maximum peak current at 10 mV as an optimum scan increment. After optimising above parameters, the effect of scan rate was studied by varying it from 2 to 12 mV/s. The maximum peak current (2.72 $\mu \mathrm{A}$) was observed at the peak potential -658.5 mV. Hence it was taken as the optimum value for studying the effect of the concentration.
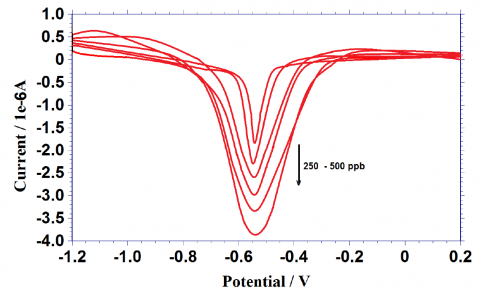
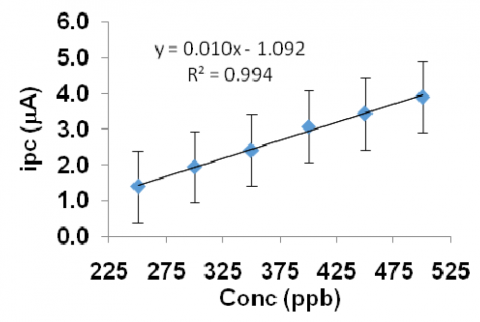
The dependence of the peak current on concentration was studied under the above fixed optimum parameters. Experimental results showed that the peak current increased with increasing concentration of eosin Y. The differential stripping voltammogram obtained for eosin Y is given in the figure 14. A calibration plot (Fig.15) indicated the linear dependence of peak current with concentration. The range of concentration limit is 250 to 500 ppb. The reproducibility of the stripping signal was realized in terms of relative standard deviation for ten identical measurements carried out at a concentration level of 200 ppb.
Figure 14. Differential pulse stripping voltammetric behaviour of eosin Y under optimum condition
3.7 Analysis of real sample
Water sample of eosin Y in tap water and the laboratory wastewater was performed in order to study the application. Various concentrations of eosin Y were added 5 ml of a water sample, and the experiments were carried out with the help of a supporting electrolyte. It was observed that the recovery was in the range of 96.21% to 98.4%.
In order to study the applicability of electrode for the determination of eosin Y in the food sample, candy-coated chocolate, and soft drink were selected and was purchased from the local market. The recoveries were studied by using the standard addition method. The recovery ranges from 92.2% to 98.6%. Recovery ranges show that the electrode is very sensitive and a great application for the determination of trace amount of the compounds.
Figure 15. Calibration plot of different concentration eosin Y dye molecule
Eosin Y electroactive and gave good responses at pH 4.0 as employed glassy carbon was working electrode. Based on the enhanced electroactivity on the electrode, the stripping voltammetric determination procedure was developed. The procedure was simple and it gave limits of determination down to ppb levels. High sensitivity, good reproducibility, and simple instrumentation were the added advantages. This method may be easily applied for the determination of real samples.
[1] J.D. Bancroft, C. Layton, Elsevier, 11, 172 (2013).
[2] M. Chakraborty, A.K. Panda, Spectrochimic Acta A, 81, 458 (2011).
[3] J. He, R.Qiu, W. Li, S. Xing, Z. Song, Q. Li, S. Zhang, Analytical Methods, 6, 6494 (2014).
[4] X. Hao, J.L. Lei, N.B. Li, H.Q. Luo, Analytica chimica acta, 852, 63 (2014).
[5] J. Tang, Y. Mao, J. Guo, Z. Li, C. Zhang, B. Jin, Food Analytical Methods, 11, 3380 (2018).
[6] T. V. Shishkanova, G. Broncova, P. Fitl, V. Kral, J. Barek, Electroanalysis, 30, 734 (2018).
[7] Y. Temerk, H, Ibrahim, N, Farhan, Analytical Methods, 7, 9137 (2015).
[8] Ali F. Alghamdi, Fethi Kool, J. Mater. Environ. Sci. 4 (5) (2013) 762-769.
[9] Ana Maria Munaretto Durigon, Géssica Domingos da Silveira, Flávio Roberto Sokal, Roni Anderson Capa Verde Pires, Daiane Dias, Journal of Solid State Electrochemistry, 24, 2907–2921 (2020)
[10] Yamjala K, Nainar M, Ramisetti N (2016) Methods for the analysis of azo dyes employed in food industry—a review. Food Chem 192:813– 824
[11] Yıldırım S, Ya ş ar A (2018) A core-shell column approach to fast determination of synthetic dyes in foodstuffs by high-performance liquid chromatography. Food Anal Methods 11:1584–1590.
[12] Prado M, Boas L, Bronze M, Godoy H (2006) Validation of methodology for simultaneous determination of synthetic dyes in alcoholic beverages by capillary electrophoresis. J Chromatogr A 1136:231–236.
[13] Alghamdi AH (2010) Applications of stripping voltammetric techniques in food analysis. Arab J Chem 3:1–7.
[14] Xia Hao, Jing Lei Lei, Nian Bing Li, Hong Qun Luo, Analytical Chimica Acta, 852(2014) 63-68.