A. Samson Myles* | O. Savadogo† | Kentaro Oishi
OPEN ACCESS
A photovoltaic thermal module for building integration was designed with novel individual solar cells cooling pipe circuit. This new design has never been developed before. In the first step, the design, fabrication and testing of a field model of a 140W, 36 cells photovoltaic module with the novel cooling pipe circuit is discussed and their performances evaluation in indoor and outdoor condition have been presented. The outdoor per-formance shows uniformity in cooling of individual solar cells and improvement in the electrical performance of the PV module.
In the second step, the design developed in the first step was used to fabricate a new commercial prototype with improved performances by using a better conductive bond between the tube and sheet by bracing/soldering than using conductive silicone glue used in the first step prototype. Ac-cordingly, a BIPV-T prototype using four high efficiency solar cells was fabricated and tested in outdoor natural sunlight. The result shows marked improvement in module efficiency when cooled by water circulation. Even the efficiency of the most efficient existing commercial solar cells used for this model drops at elevated operating conditions. The improvement in design of novel cooling pipe configuration reduces the cost by a factor of six making it attractive for commercial production.
The integration of photovoltaic (PV) module into the roof or façade of building affects the heat flow out of the PV module, thereby elevat-ing its operating temperature. This increases in the module temperature have a major impact on its performances by reducing its power, there-by lowering the efficiency. In addition, higher operating temperatures accelerate the degradation and the failure of the photovoltaic modules. The performance of the photovoltaic module is further affected if the cells within a PV module operate at different temperatures causing mismatching [1-5].
PV modules are rated at 25°C solar cell temperature; however, in field conditions the normal operating cell temperature (NOCT) is 20°C above ambient temperature [6-9] i.e. 45°C. For this case, power output of the PV module decreases by 0.4%/°C; that means the module will deliver 8% lower power when the ambient temperature is 25°C. In warmer climates the solar cells temperature is even higher, say 65°C. In this case the power output of the PV modules may decrease by 16%.
Effectively, when the PV modules are integrated in building to form roof or façade, the solar cells temperature is elevated further as the natural cooling from back of the PV module is impeded [6-8]. Then the Installed Normal Operating Cell Temperature (INOCT) increases by an additional 18°C at least. At an ambient temperature of 25°C, the solar cell temperature is denominated as INOCT = NOCT + 18°C = 63°C. Furthermore, in warmer climates or summer months when ambi-ent temperature is higher than 25°C, the INOCT will rise, thereby reducing the power output substantially.
On the other hand, commercial PV module manufacturing lines start by sorting solar cells with matching current output to ensure highest output or efficiency and to ensure reliability. If one solar cell connect-ed in series in a solar module delivers lower current than other cells, then the net current output is equal to the lowest output delivered by any solar cell. If one cell’s current is lower than the others, then it will absorb current from higher output cells and this may result in the dam-age or the delamination of the module. It may also cause fire of large PV module installations. Accordingly, cooling all cells uniformly in a PV module is very important.
The classical idea is to cool the PV module by circulating water in a pipe circuit under the PV module to improve electrical power output. The heat extracted from a solar panel can be used for hot water supply for domestic use, space heating, swimming pool heating and as process heat in industry for large BIPV-T installations. Further, the combined electrical and thermal output will increase overall efficiency of BIPV-T module substantially. Since at different locations across the World the solar radiation intensity and the ambient temperatures vary. There-fore, a method must be developed to predict performance of BIPV-T module at any given location at various temperatures.
While there are several designs of BIPV-T and PV-T modules pro-posed, these have inherent disadvantage of non-uniform cooling of individual solar cells in a module [1, 4, 6, 7, 10-23]. Unfortunately, the design of the classical BIPV-T is not effective because it does not allow uniform cooling of individual cells in a BIPV-T and PV-T mod-ules. Therefore, the aim of this work is to develop a new design of the BIPV-T design which will use a novel cooling pipe configuration that will ensure uniform cooling of individual solar cells in a PV module.
In near future, this concept can be used to fabricate the BIPV-T module will be developed to use as building façade or roof to replace conventional building material to save cost. The BIPV-T collector can also be integrated in existing buildings by using suitable support struc-ture.
1.1. Classical considerations of thermal performance of BIPV-T module
The appropriate aperture irradiance is the global (total) irradiance falling on the collector aperture $\left(I_{a}\right)$ is given by [24] :
$I_{a}=G_{T} \quad\left(\frac{W}{m^{2}}\right)$ (1)
Where, GT is the global irradiance on a collector aperture.
Equation (1) includes both direct (beam) and scattered and reflected energy.
For Flat-plate thermal collectors , the thermal and photovoltaic col-lector/module efficiency may be calculated as follows by [24]:
$\eta_{\mathrm{TH}}=\frac{\dot{m} C_{p}\left(T_{\mathrm{o}}-T_{\mathrm{i}}\right)}{G_{T} A_{c}}$ (2)
Where, in is mass flow rate of fluid in lit/hr, $C_{p}$ is specific heat of water 1 calories/gram/ ${ }^{\circ} \mathrm{C}$ or 4.1813 joules $/ \mathrm{g} /{ }^{\circ} \mathrm{C}, \mathrm{T}_{0}$ is the outlet temperature of fluid, $T_{i}$ is the inlet temperature of fluid and $A_{C}$ is solar collector area.
For a PV module with flat-plate collector configuration, the electric energy conversion of the solar irradiance is given by [24]:
$\eta_{\mathrm{PV}}=\frac{I V}{G_{T} A_{c}}$ (3)
Where, $I$ is the output current, $V$ the output voltage and $A_{c}$ is the aperture area of the solar module.
The thermal performance of BIPV-T is done outdoors in natural sunlight above 700W/m2 and measure the fluid inlet and outlet temper-atures and fluid flow rate.
The useful thermal energy (Qu) gain is expressed as [8, 24-26]:
$Q_{u}=\dot{m} C_{p}\left(T_{o}-T_{i}\right)$ (4)
Where the parameters of equation (4) are defined in equations (2) above.
The thermal performance of a collector operating under steady con-dition is expressed as [26]
$Q_{u}=A_{c} F_{R}\left[G_{T}(\tau \alpha)_{\mathrm{av}}-U_{L}\left(T_{i}-T_{a}\right)\right]$ (5)
Where, $(\tau \alpha)_{\text {av }}$ is a transmittance-absorptance product, $A_{C}$ is the collector area, $F_{R}$ is the heat removal factor, $U_{L}$ is the overall loss coefficient, $G_{T}$ is the total solar radiation incident upon the collector surface, $T_{i}$ is the inlet water temperature and $T_{a}$ is the ambient temperature. The outdoor testing is done on a clear day near solar noon time. The ( $\tau \alpha$ ) determined for conditions under which a collector provides most of its output.
The above equation 1 & 2 above can be used to define an instantane-ous efficiency ($\eta_{i}$) [26]:
$\eta_{i}=\frac{Q_{u}}{A_{c} G_{T}}=F_{R}(\tau \alpha)-\frac{F_{R} U_{L}\left(T_{i}-T_{\alpha}\right)}{G_{T}}$ (6)
$\eta_{i}=\frac{\dot{m} C_{p}\left(T_{o}-T_{i}\right)}{A_{c} G_{T}}$ (7)
The above equations are the basis of the ASHRAE standard test methods used in North America. The European practice is to base col-lector results on Tm the arithmetic average of the fluid inlet and outlet temperature. Therefore,
$\eta_{i}=F_{\mathrm{av}}(\tau \alpha)-\frac{F_{\mathrm{av}} U_{L}\left(T_{\mathrm{m}}-T_{a}\right)}{G_{T}}$ (8)
Where $F_{\mathrm{av}}$ is the average heat removal factor and $T_{m}$ is the average of the outlet and inlet fluid temperatures. The thermal performance for BIPV-T collector is measured in nearly steady state conditions. We measure $\dot{m}, T_{0}$ and $T_{i}$ to determine $\mathrm{Q}_{\mathrm{u}}$ from equation 4 mentioned above. We also measure $G_{T}$, and $T_{a}$, which are needed for the analysis based on equation 3 and 7 above. The outdoor tests are done in the midday hours on clear days when the beam radiation is high and usually with the beam radiation nearly normal to the solar collector. The transmittance-absorptance product for these test conditions is approximately the normal-incidence value and is written as $(\tau \alpha)_n$.
To minimize effects of heat capacity of collectors, we make the tests should be usually made in nearly symmetrical pairs, one before and one after solar noon, we consider the results of the pairs averaged. We determine the instantaneous efficiencies are determined from $\eta=\dot{m} C_{p}\left(T_{o}-\right.$ $\left.Y_{i}\right) / A_{C} G_{T}$ and are plotted as a function of $\left(T_{i} T_{a}\right) / G_{T}$ or as in European Union $\left(T_{m}-T_{a}\right) / G_{T}$
Where, $T_{i}$ is the inlet temperature of water, $T_{a}$ is the ambient temperature, $T_{m}$ is the average of inlet and outlet temperature of water and $G_{T}$ is the total solar radiation (beam $+$ diffuse ) incident upon the collector surface.
If $U_{L}, F_{R},$ and $(\tau \alpha)_{\mathrm{n}}$ were all constant, the plots of $\eta_{i},$ versus $\left(T_{i}-\right.$ $T_{a} / / G_{T}$ would be straight lines with intercept $F_{R}(\tau \alpha)_{n}$ and slope $-F_{R} U_{L}$ However, they are not, and the data scatter. The UL is a function of temperature and wind speed. Also, $F_{R}$ is a weak function of temperature. Thus scatter in the data are to be expected, because of temperature dependence, wind effects, and angle of incidence variations. The longterm performance estimates of BIPV-T module can be characterized by the intercept and slope i.e., by $F_{R}(\tau \alpha)_{n}$ and $F_{R} U_{L}$
To determination of heat capacity of BIPV-T module time constant method is used. The time constant is defined as the time required for a fluid leaving a collector to change through (1-1/e)=(0.632) of the total change from its initial to its ultimate steady value after a step change in incident radiation or inlet fluid temperature. The ASHRAE outlines two procedures for estimating time constant. The first is to operate a solar collector at nearly steady state conditions with inlet fluid temperature controlled at or very near ambient temperature. The solar radiation is abruptly shut off by shading or repositioning the collector and the de-crease in outlet temperature (with the pump running) is noted as func-tion of time. The time t at which the equality is reached is the time constant of the collector:
$\frac{T_{o, t}-T_{i}}{T_{o, \text { init }}-T_{i}}=\frac{1}{e}=0.368$ (12)
Where, $T_{o, t}$ is outlet temperature of fluid after lapsed time t and $\mathrm{T}_{o, \text { init }}$ is initial outlet temperature. The number $e$ is a mathematical constant that is based on the natural logarithm and its value is approximately 2.717
The second method for measuring time constant is to test collector not exposed to radiation (i.e., at night, indoors, or shaded) and impose a step change in the temperature of the inlet fluid from a value well above ambient (e.g. 30°C) to a value very near ambient. The equation 12 mentioned above also applies to this method. This method was used for determining the time constant of BIPV-T module.
The aim of this work are:
i. To measure parameters that are required to determine the electrical and thermal performance of BIPV-T module.
ii. To size a BIPV-T system for various applications using software such as F-chart or PV F-chart.
Figure 1. Individual PV cell water cooling sketch (a) for 36 cell modules (b) for 60 and 72 cell modules (only two rows are shown for explanation for new concept)
2.1. BIPV-T module fabrication
The test for thermal performance was conducted using European Union test standard EN $12975-2: 2006:$ Thermal solar systems and components - Solar collectors - Part2: Test methods which is same as ASHRAE test method used in North America [26]
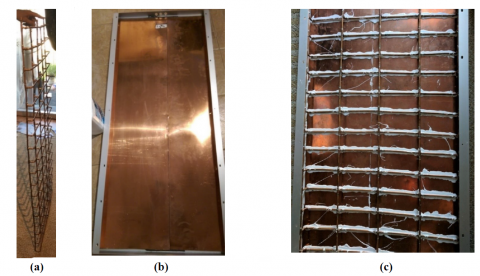
Figure 3 and Figure 4 show the different components of the uniformly cooled of individual cells of a PV module. The components parameters also described in Table $1 .$ A standard polycrystalline PV module rated at $140 \mathrm{W}$ under standard test condition was acquired from Solar Tech. This solar module came with 50 mm high aluminum frame fixed permanently to the module. A copper sheet of $0.2 \mathrm{mm}$ thickness with $380 \mathrm{W} / \mathrm{m} \cdot \mathrm{K}$ conductivity was pasted at the back of PV module using conductive adhesive. A copper cooling pipe of $1 / 4$ " diameter readily available in the market was selected to fabricate a novel cooling pipe layout.
Figure 1 shows the design of the individual PV cell cooling which we used to fabricate the 36 cell prototype shown in Figure 6 and Figure 7. The blue arrows in Figure 1 indicate the cooling water flow direction in the novel BIPV-T module. Each cell of the panel is fed by cooling water at the same temperature. This avoids an increase of the cooling water temperature from the first cell to the last cell in the conventional cooling system shown in Figure $2 .$ In this new design the first cell of the panel where the cooling water is entering is at the same temperature as the last cell of the panel. What is new in our approach as shown in Figure 1 shows is: each cell of the panel is fed with cooling water at the same temperature; whereas in the classical cooling system (see Figure 2), the cooling water of the first cell will go through from the first to the second to the third until it gets through the last cell. Accordingly, the cooling water temperature in a such configuration will increase significantly from the first cell to the last cell. The temperature of the fürst cell where the cooling water is entering will be significantly less hot than the last cell. Thus, non uniformity in cell temperature will contribute to decrease in overall performance of the module and may damage the module prematurely.
To simplify the fabrication of our novel design, all bends and branches were created using tee's, elbows and reducers. Cut lengths of $1 / 4$ " copper pipes were assembled like LEGO using tees and bends to make the novel cooling pipe layout. The joints were soldered (brazed) to make it leakproof.
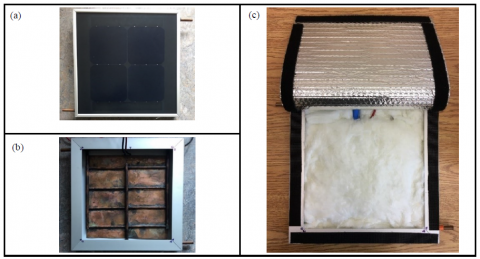
The pipes matrix in Figure 3(a) is pasted on a copper sheet for uniform distribution of temperature and the sheet is glued to back of PV module. Thermally conductive adhesive was used to attach the cooling pipe to the copper sheet and to glue to the back of module. See Figure 3(c) above.
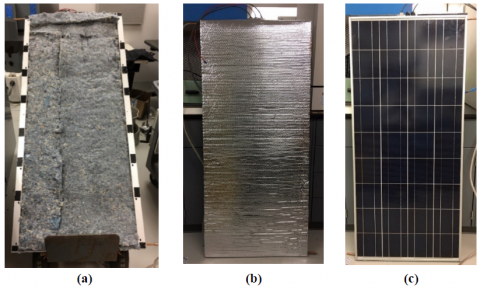
A layer of environment friendly denim R6.7 insulation was placed over cooling pipe to reduce heat loss. The insulation used is 45 mm thick. The insulation was held in place using 8 mm thick reflective sheet. The sheet is anchored to PV module frame using Velcro strips. See Figure 4(b) below.
Table 1. Specification of BIPV-T Module Fabricated
|
S.N. |
DESCRIPTION |
SPECIFICATION |
REMARKS |
|
1. |
40W Polycrystalline PV module |
1466mm x 660mm x 50mm |
Junction Box Removed |
|
2. |
Wire Output for PV Module |
6mm2, 1m each +ve and -ve |
Electrical Performance |
|
3. |
Copper Absorber Sheet |
0.2mm thick |
Thermal |
|
4. |
Copper Riser Tubes |
1/4” Outer diameter |
0.030” wall thickness |
|
5. |
Copper Header Tubes |
3/8” Outer diameter |
0.032” wall thickness |
|
6. |
Copper Elbow 900 |
1/8” Inside diameter |
Pipe Connection |
|
7. |
Copper Tee |
1/4” Inside diameter |
Pipe Connection |
|
8. |
Copper Reducer |
¼” to 1/8” Inside diameter |
Pipe Connection |
|
9. |
Conductive Adhesive SE4485 |
2.2W/m.K |
Thermal Joints |
|
10. |
Denim insulation 45mm thick (R6.7) |
K=0.037W/m.°C, R=1.08 m2/W.°C |
Thermal conductivity & thermal resistance |
|
11. |
Rear cover for insulation 5/16” (8mm) thick |
R-1.08 m2/W.°C |
-60°F – 180°F |
|
12. |
12V, 14.5W DC Water Pump |
10 lpm at 8m head |
Suitable upto 70°C |
|
13. |
Electronic speed controller for pump |
Water flow control |
Flow rate control |
|
14. |
Sealed maintenance-free battery |
12V, 12AH |
Pump operation |
|
15. |
PV module tester with Cell for solar radiation measurement |
100V, 20A |
I-V curve, Solar intensity, temp. |
|
16. |
Thermal imaging camera |
TG165 |
Surface temp. |
|
17. |
Digital and glass thermometer |
0-200°C |
PV/Ambient temp |
|
18. |
Graduated cylinder and stopwatch |
2 litre cylinder |
Flow rate |
NOTE: The junction box from solar module was removed to aid cooling of solar cell below the junction box. The wire output is taken out through width side frame.
Figure 2. Conventional water cooling pipe design for (a) for 36 cell modules (b) for 60 and 72 cell modules (only two row are shown for explanation))
Figure 3. Novel cooling pipe and attachment details at the back of PV module. It is well described below.
3.1. Test Set Up
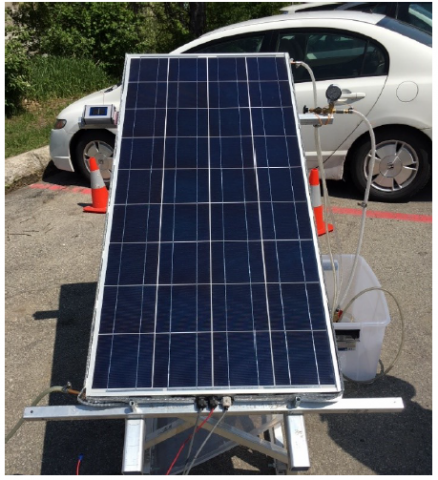
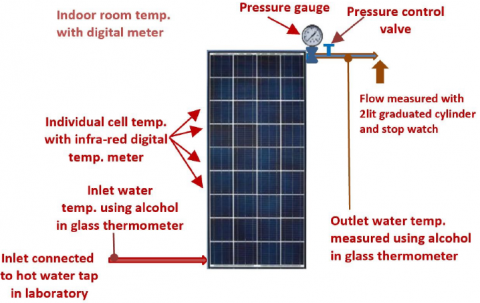
An outdoor test rig for testing PV-thermal modules was created as shown below in Figure 5 and Figure 6.
The test rig consisted of a mounting structure to mount BIPV-T module. The angle of inclination of mounting structure could be adjusted. A reference solar cell to measure the solar intensity in the same plane as the top surface of the BIPV-T is mounted at the side of the structure.
The positive and negative wire output from PV module was connected to an automatic current and voltage tracer (miniKLA) for measuring electrical performance in natural sunlight. The output of reference cell
with built-in temperature sensor is also plugged in the same device to automatically measure the solar radiation and electrical parameters simultaneously.
A 200-litre water tank is connected to a 12V battery operated pump. The 14.5W pump is rated to deliver 10 lpm to 8m head. The pump came with an electronic controller to control speed to vary flow rate. A 12V, 13AH deep cycle AGM battery was used for operating the pump. The inlet of the pump is connected the water tank while outlet of the pump is attached to the lower end of water-cooling pipes attached to the back of the BIPV-T module. A plastic tubing was used connecting the pump to the BIPV-T module.
On the exit of cooling pipe of BIPV-T module, a pressure gage with range of 7 bar was installed. A shut off valve was installed after the pressure gauge to increase pressure by choking the water outflow.
To measure the inlet and the exit water temperature, an alcohol in glass thermometer with range of $-20^{\circ} \mathrm{C}$ to $50^{\circ} \mathrm{C}$ was used. The same thermometer was used for measuring ambient air temperature. The wind velocity recorded from nearest the weather station through iPhone APP in km/hr and converted to meters per second.
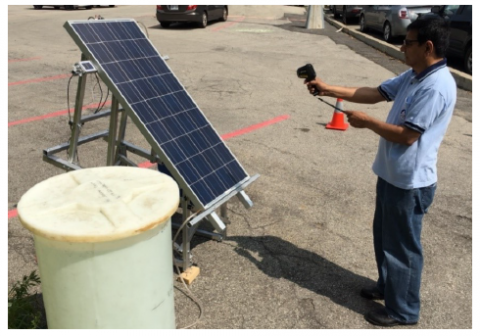
The temperature of the individual solar cells was measured with a digital infrared meter having laser pointer. The temperature was meas-ured in the middle of each of 36 solar cells in the module.
The BIPV-T module was faced true south and inclination of the mounting structure was adjusted based on the solar azimuth and solar altitude at solar noon. The sun altitude, azimuth and solar noon is deter-mined using Sun Surveyor APP. The inclination and orientation adjust-ment for mounting structure is done using orientation meter from Solar Consulting APP. All measurements are done 45 minutes before and 45 minutes after solar noon time. The BIPV-T was left in the sunlight for 12-15 minutes before measuring the electrical output and the cell tem-perature. It was ensured that there is no water inside the cooling pipe for taking readings in stagnation temperature. The readings taken dur-ing water cooling of BIPV-T was allowed 9 to 10 minutes to stabilize the solar cell temperature. This was done every time when cooling the flow rate was changed.
Figure 4. Rear Denim Insulation, Back and Front of BIPV-T Module with Novel Cooling Pipe Configuration
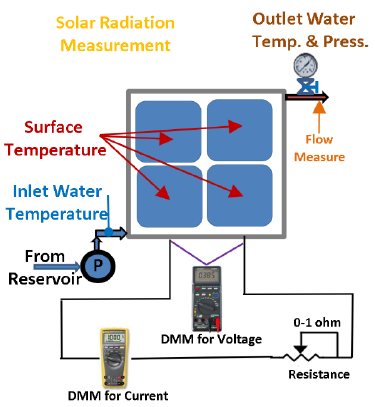
Figure 5. Test set-up for performance evaluation
Figure 6. Outdoor Test Setup showing BIPV-T Module
3.2. Methodology
The following sequence of testing was followed [26].
The testing of BIPV-T module was done 45 minutes before solar noon and 45 minutes after the solar noon. The module mounting rack was designed for 30° to 45° inclination. Since the tests were conducted from June to September the optimum inclination of 30° was selected. The BIPV-T module was oriented True South. The solar noon during the month of June is 12:51PM clock time during which the Sun reaches its highest point and aligned to the surface of the BIPV-T module. Af-ter about 15 minutes of exposure to sunlight the electrical performance of solar module was done in stagnation condition i.e. without circulat-ing the cooling water. This way we could compare the improvement in performance when module was cooled by circulating the water. The temperature of individual cells in the BIPV-T modules is taken with the help of a handheld infra-red temperature meter as seen in Figure 7.
Figure 7. Measuring Temperature of Individual Solar Cells using Infra-red Temperature Meter
The ambient temperature and the wind velocity are also noted. After the stagnation temperature and the electrical performance are observed a battery-operated water circulation pump was switched ON to force the cooling water through cooling pipe attached at the back of BIPV-T module. Once the temperature of the water at the outlet of the BIPV-T module stabilize in 10-12 minutes, the inlet and the outlet temperature readings of the cooling water are measured. The temperature of each of 36 cells in the module is measured simultaneously using infrared tem-perature meter. Thereafter module electrical performance was recorded using the outdoor module tester (MiniKLA). The ambient temperature and the wind speed are also recorded. The above tests are conducted by varying the cooling water flow rates. For every flow rate, individual cell temperatures, solar radiation, wind speed, ambient, inlet and outlet water temperatures and module electrical output are recorded. The tests are conducted when the sunlight was above 700W/m2 in clear sunny days. The cooling water flow rates is varied between 0.02 lit/sec to 0.04 lit/sec [26].
3.3. Measured and Derived Data
The measured experimental values of novel BIPV-T module are presented in Table 2. The measurements are done for ambient tempera-ture $\left(\mathrm{T}_{2}\right),$ the global solar radiation in watt per square meter (G is net solar falling on the BIPV-T module area $0.968 \mathrm{m}^{2}$ ), solar cell temperature of BIPV-T module (Av. BIPVT Temp is average temperature of 36 cells), the PV power (W) , the temperature of the cooling water inlet $\left(T_{i n}\right),$ the temperature of the cooling water outlet $\left(T_{o}\right),$ the flow rate of cooling water in lit/hr at the outlet of BIPV-T module, The pressure is measured at the outlet of BIPV-T module. The pressure is regulated with a shut of valve after the pressure gauge. The flow rate is adjusted both with shut of valve and electronic controller to control the speed of the pump.
Table 2. Outdoor test data of BIPV-T module in natural sunlight and analysis
|
S.N. |
MEASURED TEST CONDITIONS |
SOLAR COLLECTOR MESUREMENTS |
|||||||||||||
|
Ta |
G (Net Solar) |
Wind |
Av. BIPVT Temp |
PV Power |
Ti |
To |
Flow Rate |
||||||||
|
°C |
W |
m/s |
°C |
W |
°C |
°C |
lit/hr |
||||||||
|
1 |
23.0 |
955.0 |
2.22 |
44.92 |
126.5 |
- |
- |
0 |
|||||||
|
2 |
23.0 |
965.6 |
2.22 |
41.68 |
128.2 |
27.0 |
35.0 |
39.46 |
|||||||
|
3 |
22.5 |
947.3 |
2.22 |
38.79 |
127.8 |
30.0 |
37.0 |
50.57 |
|||||||
|
4 |
23.0 |
940.46 |
2.22 |
37.29 |
128.9 |
26.0 |
32.0 |
67.67 |
|||||||
|
5 |
25.0 |
969.5 |
2.22 |
41.75 |
129.7 |
27.0 |
34.5 |
74.20 |
|||||||
|
6 |
25.0 |
962.7 |
2.22 |
39.54 |
129.8 |
28.0 |
33.2 |
88.17 |
|||||||
|
7 |
23.5 |
918.2 |
2.22 |
33.43 |
128.9 |
25.0 |
29.5 |
105.00 |
|||||||
|
8 |
23.2 |
963.7 |
2.78 |
37.22 |
131.4 |
28.5 |
33.0 |
120.64 |
|||||||
|
9 |
23.5 |
900.8 |
2.22 |
34.63 |
123.1 |
24.5 |
28.5 |
140.50 |
|||||||
|
10 |
22.0 |
955.0 |
2.22 |
35.28 |
131.1 |
28.5 |
32.4 |
156.93 |
|||||||
Table 3. Derived results of outdoor test of BIPV-T module in natural sunlight and analysis
|
DERIVED TEST RESULTS |
|||||||
|
S.N. |
To - Ti |
Tm |
Thermal Power |
$\frac{T_{m}-T_{a}}{G}$ |
Thermal Eff., $\eta_{\text {therm }}$ |
PV Eff., $\eta_{\mathrm{PV}}$ |
Overall Eff., $\eta_{\mathrm{overall}}$ |
|
K |
°C |
W |
% |
% |
% |
||
|
1 |
- |
- |
- |
- |
- |
13.24 |
13.24 |
|
2 |
8.0 |
31.00 |
314.93 |
0.00829 |
32.72 |
13.29 |
46.01 |
|
3 |
7.0 |
33.50 |
353.14 |
0.01161 |
37.41 |
13.52 |
50.93 |
|
4 |
6.0 |
29.00 |
405.05 |
0.00638 |
43.17 |
13.72 |
56.89 |
|
5 |
7.5 |
30.75 |
555.17 |
0.00593 |
57.40 |
13.39 |
70.79 |
|
6 |
5.2 |
30.60 |
458.48 |
0.00582 |
47.62 |
13.49 |
61.11 |
|
7 |
4.5 |
27.25 |
471.37 |
0.00395 |
51.46 |
13.99 |
65.45 |
|
8 |
4.5 |
30.75 |
542.88 |
0.00783 |
56.39 |
13.64 |
70.03 |
|
9 |
4.0 |
26.50 |
562.00 |
0.00333 |
62.39 |
13.67 |
76.06 |
|
10 |
3.9 |
31.00 |
612.00 |
0.00885 |
64.09 |
13.73 |
77.82 |
In order to calculate the thermal efficiency of BIPV-T module, useful energy $\mathrm{Q}_{\mathrm{u}}$ as described in equation 4 is used and derived data is presented in Table $3 .$ In this equation $\left(\mathrm{T}_{\circ}-\mathrm{T}_{\mathrm{i}}\right)$ is temperature rise in cooling water. This parameter is dependent on flow rate, solar intensity, ambient temperature and wind speed. The temperature rise is higher if flow rate is lower, solar intensity is higher, ambient temperature is higher and wind speed is lower. However, efficiency at higher temperature rise is lower as compared to lower temperature rise due to increased convection and radiation losses from BIPV-T module. Consequently, at higher flow rates temperature gain in cooling water is lower but efficiency is higher due to reduced losses. Though prescribed flow rate for testing solar thermal collectors are between 0.02 lps $(721 \mathrm{ph})$ to 0.04 lps $(1441 p h)[26],$ readings at lower and higher flow rates is also taken. since BIPV-T is unglazed solar heat collector, we wanted to observe the extent to which outlet temperature will rise at higher and lower flow rates.
In order to compare thermal performance in novel cooling design shown in Figure 1 with classical BIPV-T cooling system as shown in Figure $2 .$ To compare efficiencies $\eta_{\text {them}}$ versus $\left(T_{m}-T_{a}\right) / G$ graph is generated as shown in Figure $9 .$ The novel design proposed by us produces approximately $56 \%$ thermal efficiency as compared to $[11],$ where thermal efficiency is about $45.5 \% .$ The thermal efficiency is also dependent on conductivity and thickness rear insulation that effect the convection loss. Therefore, comparison of thermal performance of two different BIPV-T module is not perfect.
The electrical efficiency of BIPV-T was obtained using Equation 3 The solar radiation is measured in watt/m and net solar G is obtained by multiplying measured solar radiation in watts/m $^{2}$ by area of BIPV-T module which is length x width (1466mm x $660 \mathrm{mm}$ ) given in Table $1 .$ The electrical performance BIPV-T module is measured using an automatic module tester Mini-KLA which measures solar radiation intensity, voltage, current and power. MiniKLA also provides I-V curve for each test as shown in Figure $13,$ Figure 14, Figure 15.
All data presented in Table 2 was measured and tabulated as described in Section 3.2 Methodology. The average BIPV-T temperature presented in Table 2 is the average temperature of all 36 solar cells in the module.
The derived data presented in 1 able 3 are obtained from equations described in Section $1.1 .$ Classical considerations of thermal performance of BIPV-T module. As explained in section $1.3 .$ PV power is obtained directly from automatic module tester whereas thermal power is obtained from Equation 4. The efficiencies of PV is calculated from Equation 3 and Thermal efficiencies are calculated from Equation 7 presented in section $1.1 . \mathrm{T}_{\mathrm{m}}$ is the arithmetic average of the fluid inlet and outlet temperature. The efficiency of PV module is derived from Equation 3 where net solar $\mathrm{G}=\mathrm{G}_{\mathrm{T}}$
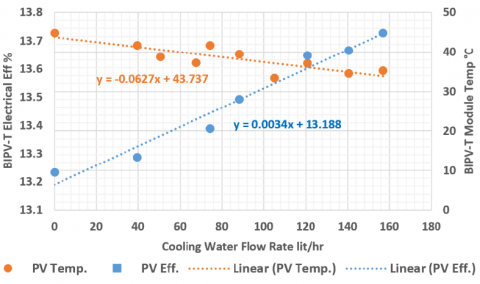
Figure 8 is representaion of BIPV-T module efficiency with respect to cooling water flow rate. The data for plotting this graph is taken from Table 2 and Table $3 .$ The graph shows increase in flow rate reduces the BIPV-T temperature and improves the efficiency. The scattering of points is common because performance is temperature dependent, wind effects, and angle of incidence variations[26].
Using the data of Table $3,$ Figure 8 shows the variation of the PV efficiency with cooling water flow rate. The temperature of the BIVP-T increases as the flow rate decreases. The PV efficiency increases as the cooling water rate increases.
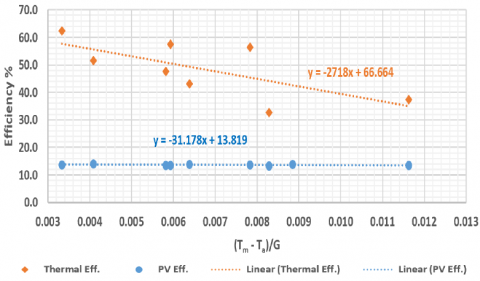
Figure 9 shows thermal and electrical efficiencies $\eta_{\text {thern }}$ and $\eta_{P V}$ with respect to inlet parameter $\left(\mathrm{T}_{\mathrm{m}}-\mathrm{T}_{\mathrm{a}}\right) / \mathrm{G}$. The data for plotting the performance is taken from Table $3 .$ This is a classical representation of thermal performance as per European standard. As explained in equation European method uses $\mathrm{T}_{\mathrm{m}}$ mean temperature of inlet and outlet water temperature passing through BIPV-T collector. The performance estimates of solar thermal collectors can be characterized by intercept $F_{\mathrm{av}}(\tau \alpha)$ and slope $F_{\mathrm{av}} U_{L}$ as decribed in equation 8[26]
Figure 8. Cooling water flow rate vs. Cell Temp. and BIPV-T Efficiency
Figure 9. Variation of the BIPV-T module Electrical and Thermal Efficiencies with (Tm – Ta)/G.
Figure 9. Variation of the BIPV-T module Electrical and Thermal Efficiencies with (Tm – Ta)/G.
Figure 10. Indoor testing of novel water-cooling pipe configuration for temperature uniformity
4.1. Indoor testing by circulating preheated water
After fabricating the BIPV-T module a series of indoor testing was conducted to evaluate the performance at various cooling water temper-atures and flow rates. The objective of indoor testing was to eliminate the effect of wind velocity and shading.
The indoor test setup is exactly same as proposed for outdoor testing in natural sunlight except that preheated water at varying temperatures and flow rates is circulated in the cooling circuit. The temperature of all 36 solar cells is measured to determining the temperature variation.
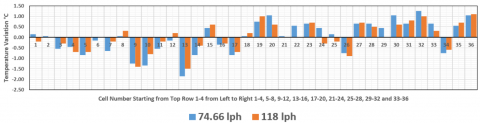
The variation in cell temperature in indoor testing with respect to varying cooling water flow rate is shown in Table 4 and Table 5. The testing was conducted for two flow rates 74.66 liters per hour and 118 liters per hour respectively. The performance of cell temperature uni-formity was done by circulating hot water at 47°C. The temperature of each cell (36) was measured using infra red temperature meter. The cell temperature for novel BIPV-T is remarkable uniform within 2.1°C at 118litres per hour flow rate. Even at low flow rate of 74.66 litres per hour the temperature uniformity is within 2.5°C.
The Vertical Column-wise Column 1: Cells 1-9; Column 2: Cells:10-18; Column 3: Cells 19-27 and Column 4: Cells 28-36); Horizontal Row-wise (Row 1: Cell 1,10,19 and 21); (Row 2: Cell 2,11,20,29); (Row 3: Cell 3,12,21,30); (Row 4: Cell 4,13,22,31); (Row 5: Cell 5,14,23,32); (Row 6: Cell 6,15,24,33); (Row 7: Cell 7,16,25,34); (Row 8: Cell 8,17,26,35); (Row 9: Cell 9,18,27,36).
The vertical column-wise and horizontal row wise cell configuration for measuring cell temperature for 74.66 litres per hour flow rate is exactly same as for 118 litres per hour flow rate described below Table 4. The water is circulated at 3 bar pressure.
Temperature variation with solar cell number for BIPV-T module in indoor testing is shown in Figure 11 and Figure 12. The pattern in cell temperature at flow rate of 118 litres per hours and 74.66 litres per hour is almost same.
Figure 11. Vertical column-wise temperature variation in solar cells for BIPV-T module in indoor testing
Figure 12. Horizontal row-wise temperature variation with solar cell number for BIPV-T module in indoor testing (for 36 cell module)
Table 4. Experimental results of the cell temperature of indoor testing of BIPV-T module with novel cooling pipe circuit at high cooling water flow rate
Table 5. Experimental results of the cell temperature of indoor testing of BIPV-T module with novel cooling pipe circuit at low cooling water flow rate
4.2. Testing of uniformity in cooling of BIPV-T module in outdoor in sunlight
Earlier tests were conducted indoors to check the uniformity of cool-ing with novel cooling pipe configuration. The indoor testing was done without Sunlight. It is important to check how effective is the novel cooling pipe configuration in cooling all 36 solar cells uniformly in outdoor conditions.
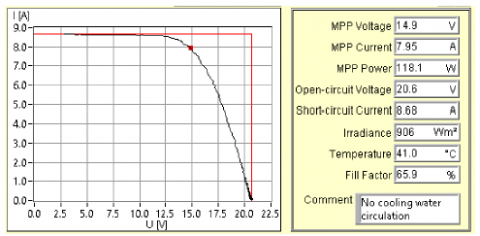
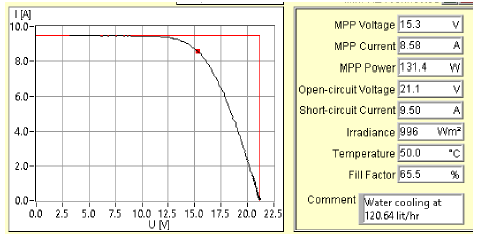
Figure 13, Figure 14 and Figure 15 are the current voltage curves obtained from three tests respectively, in stagnation condition or with-out cooling, low (74.20 lit/hour) and high (120.64 lit/hour) flow rates under pressurized 0.6 bar conditions.
Figure 13, Figure 14 and Figure 15 electrical performance of BIPV-T for uncooled and cooled at low and high water flow rates. The tempra-ture distribution is fairly uniform from one cell to another cell for the 36 cells module as shown in highlighted section of Table 6, Table 7 and Table 8. For a given cell, the cell temperrature is higher in stagnation condition than when the cell is cooled at 74.2 or 120.64 litres per hour. The cell temperature (41.77°C) is higher at low cooling flow rate (74.2 litres/hour) than its temperature at high cooling flow (120.64 li-tres/hour).
Using data of Figure 13, Figure 14 and Figure 15, the normalized of the MPP current in A/Wm2 of irradiance, MPP short circuit current/ Wm2 of irradiance and the MPP POWER/ Wm2 of irradiance are shown in Table 9. It seems that there is no fundamental difference in electrical performance of module at varying water-cooling flow rates.
Figure 13. BIPV-T module outdoor electrical performance in stagnation state (without water cooling)
Figure 14. Experimental results of BIPV-T module electrical performance at low water cooling rate (74.2 lires/hour)
Figure 15. Experimental BIPVT module electrical performance at high cooling water circulation rate (120.64 litres/hour)
Table 6. Experimental outdoor data of BIPV-T module output, module temperature and temperature uniformity tests without cooling
|
Flow Rate, lph |
0 |
INDIVIDUAL CELL TEMPERATURES |
Temp Diff. Rows |
||||
|
Wind Speed |
2.22 m/s |
42.8 |
45.7 |
44.4 |
43.0 |
2.9 |
|
|
Tamb (200C) |
23.5 |
44.7 |
46.9 |
45.9 |
45.3 |
2.2 |
|
|
BIPVT Temp. 0C |
45.99 |
46.1 |
47.9 |
47.5 |
46.7 |
1.8 |
|
|
Voc, Volt |
20.7 |
45.7 |
48.4 |
47.8 |
47.7 |
2.7 |
|
|
Isc, Ampere |
8.65 |
45.8 |
48.5 |
47.6 |
47.1 |
2.7 |
|
|
Pmpp, Watt |
118 |
45.7 |
48.2 |
47.6 |
46.6 |
2.5 |
|
|
Vmpp, Volt |
14.8 |
44.7 |
47.6 |
47.5 |
45.1 |
2.9 |
|
|
Impp, Ampere |
7.95 |
44.7 |
47.0 |
47.2 |
44.9 |
2.5 |
|
|
Solar, Watt/m2 |
906 |
41.8 |
45.0 |
44.8 |
41.7 |
3.3 |
|
|
Temp. Difference Columns > |
4.3 |
3.5 |
3.4 |
6.0 |
|
||
|
WATERin TEMP |
- |
WATERout TEMP > |
- |
||||
Table 7. BIPVT module electrical performance with 74.2 lit/hr cooling water circulation
|
Flow Rate lph |
74.2 |
INDIVIDUAL CELL TEMPERATURES |
Temp Diff. Rows |
||||
|
Wind Speed |
2.22 m/s |
37.0 |
42.0 |
38.8 |
42.8 |
5.0 |
|
|
Tamb °C |
25.0 |
37.2 |
42.5 |
38.5 |
42.1 |
4.9 |
|
|
BIPVT Temp.°C |
41.75 |
44.1 |
44.3 |
44.3 |
38.4 |
5.9 |
|
|
Voc, Volt |
20.8 |
44.1 |
45.0 |
45.0 |
42.9 |
2.1 |
|
|
Isc, Ampere |
9.63 |
40.4 |
44.5 |
41.9 |
39.7 |
4.8 |
|
|
Pmpp, Watt |
129.8 |
44.0 |
42.3 |
44.5 |
39.1 |
4.9 |
|
|
Vmpp, Volt |
14.9 |
43.8 |
42.2 |
41.5 |
40.6 |
3.2 |
|
|
Impp, Ampere |
8.71 |
43.2 |
44.4 |
44.3 |
38.8 |
5.6 |
|
|
Solar Intensity |
1002 |
36.9 |
43.3 |
41.0 |
37.6 |
5.7 |
|
|
Temp. Difference Columns> |
6.9 |
1.9 |
5.8 |
4.5 |
|
||
|
WATERin TEMP |
27 |
WATERout TEMP |
34.5 |
||||
Table 8. BIPVT Module Electrical Performance with 120.64 lit/hr cooling water circulation
|
Flow Rate, lph > |
120.64 |
INDIVIDUAL CELL TEMPERATURES |
Temp. Diff. Rows |
|||
|
Wind Speed, m/s |
2.22 |
33.8 |
34.5 |
37.3 |
34.5 |
3.5 |
|
Tamb °C |
23.2 |
35.5 |
38.4 |
37.3 |
37.2 |
1.2 |
|
BIPVT Temp. °C |
37.22 |
38.2 |
39.9 |
39.6 |
37.4 |
2.5 |
|
Voc , Volt |
21 |
39.4 |
39.7 |
39.5 |
40.3 |
0.2 |
|
Isc , Ampere |
9.5 |
39.9 |
37.5 |
36.7 |
39.5 |
0.4 |
|
Pmpp , Watt |
131.3 |
35.6 |
38.3 |
37.5 |
37.8 |
2.7 |
|
Vmpp , Volt |
15.3 |
34.6 |
38.9 |
38.4 |
39.3 |
3.8 |
|
Impp , Ampere |
8.58 |
35.1 |
36.4 |
36.2 |
39.9 |
4.8 |
|
Solar, Watt/m2 |
995 |
33.8 |
35.3 |
33.5 |
33.3 |
2.0 |
|
Temp. Difference Columns > |
6.1 |
5.4 |
6.1 |
3.1 |
|
|
|
Waterin Temp. °C > |
28.5 |
Waterout Temp. °C > |
33 |
|||
Table 9. Normalized of the MPP current in A/Wm2 of irradiance, MPP short circuit current/ Wm2 of irradiance and the MPP POWER/ Wm2 of irradiance are shown.
|
|
MPP current/ Wm2 of irradiance |
MPP short circuit current/Wm2 of irradiance |
MPP POWER/ Wm2 of irradiance |
|
Stagnation |
0.008775 |
0.00955 |
0.130 |
|
Cooling at 74.2 lit/hr. |
0.00869 |
0.00961 |
0.131 |
|
Cooling at 120.64 lit/hr. |
0.00862 |
0.00955 |
0.132 |
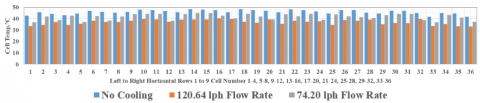
Figure 16 and Figure 18 show the comparative variation of cell tem-peratures for uncooled and cooled BIPV-T module at 120.64lph per hour and 74.2lph per hour respectively. Figure 16 is vertical column wise cell temperatures and Figure 18 is horizontal row wise cells in the BIPV-T module.
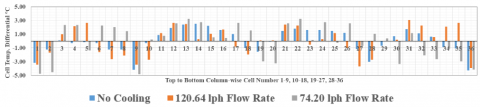
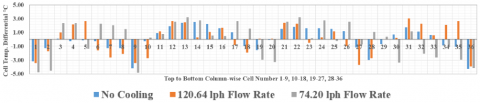
Figure 17 and Figure 19 show temperature differential between each cell with respect to average temperature of all 36 cells. Figure 17 is vertical column wise cell temperatures and Figure 19 is horizontal row wise cells in the BIPV-T module. Some cells are operating at higher than average and some at lower than average cell temperatures. Gener-ally, solar cells in the middle of module show higher temperature. This may be due to poor contact of cooling sheet at the back of module.
Figure 16. Vertical column-wise temperature of solar cells at various flow rates in BIPVT module
Figure 17. Vertical column-wise temperature differential of solar cells at various flow rates in BIPVT module
Figure 18. Horizontal row-wise temperature of solar cells at various flow rates in BIPVT module
Figure 19. Horizontal row-wise temperature differential of solar cells at various flow rates in BIPVT module
4.3. Graphical performance of temperature uniformity of 36 cells in a BIPVT module with novel cooling cirrcuit
Figure 16 shows the temperature of each of 36 cells. The cells are counted top to bottom $1-9 \operatorname{cell}, 10-18$ cell, $19-27$ cell and $28-36$ cell. The comparison of cell temperature without cooling, cooling @74.20lph and @ 120.64lph presented for all 36 cells in new BIPV-T module.
Figure 17 shows the temperature differential of each 36 cells. The cells are counted top to bottom $1-9$ cell, $10-18$ cell, $19-27$ cell and 28 36 cell. The comparison of cell temperature without cooling, cooling @ 74.2 Olph and $@ 120$. 64 lph presented for all 36 cells in new BIPV-T module.
Figure 18 shows the temperature of each of 36 cells. The cells are counted left to right starting with top horizonal row and ending at bottom horizontal row 1-4 cell, 5-8 cell, 9-12 cell, 13-16 cell, 17-20 cell, $21-24$ cell, $25-28$ cell, $29-32$ cell and $33-36$ cell. The comparison of cell temperature without cooling, cooling $@$ 74.20lph and @ 120.64lph presented for all 36 cells in new BIPV-T module.
Figure 19 shows differential temperature of cells about zero axis which is the average temperature of 36 cells. The graph shows which of 36 cells are heating above average and which below average for uncooled and cooled at low and high water flow rates. Figure 18 shows the temperature of each of 36 cells. The cells are counted left to right starting with top horizonal row and ending at bottom horizontal row 14 cell, $5-8$ cell, $9-12$ cell, $13-16$ cell, $17-20$ cell, $21-24$ cell, $25-28$ cell, $29-32$ cell and $33-36$ cell. The comparison of cell temperature without cooling, cooling $@$ 74.20lph and $@ 120.64$ lph presented for all 36 cells in new BIPV-T module.
To simplify and improve the fabrication of BIPV-T module with novel cooling pipe configuration a second working model of size 335mm x 335mm was made and tested. For making this module 125mm x 125mm Sun Power cells was used and cooling circuit was made to fit the cell area. The thermal absorber and novel cooling pipe configuration are shown with water flow direction Figure 20 (a)
Improved cooling pipe attached to copper cooling sheet shown in Figure 20 (b)
Figure 20. View of novel cooling pipe configuration attached to copper plate, (a) Water flow direction, (b) Improved cooling pipe attached to copper cooling sheet
The cooling water flow direction and tube and sheet fabricated by bracing with Sn/Ag solder to improve thermal conductivity between copper tube and sheet.
Figure 21(b) shows how copper tube and sheet heat exchanger is inserted at the back of PV module and held in place with tape instead of pasting with conductive glue. Since PV modules carry 25year warranty it is not advisable to make any physical changes. Moreover, solar water heating collectors usually carry only 5-year warranty and its life is limited to 15 years. The attachment of cooling sheet is therefore kept flexible to replace and repair when needed. The sheet and tube cooling sheet covers solar cell area 0.253m x 0.253m. During the outdoor test-ing, area around four solar cells as seen in Figure 21(b) is masked with opaque tape to ensure heat from excessive width of empty space does not get transferred to the solar cells. This is because the cooling pipe and copper plate is made to the size of four laminated solar cells.
The outdoor test setup is shown in Figure 22. All outdoors measure-ments for ambient temperature, wind speed, water pressure, cooling water inlet and outlet temperatures are done as described earlier for 1st prototype. The solar radiation measurement is done with Mini-KLA but current and voltage measurements are done with two multimeters. For collecting multiple current and voltage data for drawing I-V character-istics 1ohm variable resistance is used.
Figure 21. Picture of front and back of BIPV-T module model
The electrical, thermal and weather data collected from testing is tabulated in Table 10 below. The derived data is also presented in the same table.
Table 10. Outdoor Performance of BIPV-T Module with Improvements in Cooling Pipe Fabrication Methodology
|
S.N. |
MEASURED TEST CONDITIONS |
BIPV-T MEASUREMENTS |
DERIVED RESULTS |
||||||||||||
|
Ambient |
Radiation |
Wind |
PV Temp |
Power |
Ti |
To |
Flow |
ΔT |
Tm |
Therm Pwr |
$\frac{T_{\mathrm{m}}-T_{\mathrm{a}}}{G}$ |
$\eta_{\mathrm{therm}}$ |
$\eta_{\mathrm{PV}}$ |
$\eta_{\mathrm{overall}}$ |
|
|
°C (Ta) |
G (net) |
m/s |
°C (mean) |
watts |
°C |
°C |
lit/hr |
k |
°C |
W |
% |
% |
% |
||
|
1 |
21.0 |
49.60 |
1.39 |
47.05 |
7.94 |
0.00 |
0.00 |
0.00 |
0.00 |
0.00 |
0.00 |
0.00 |
0.00 |
16.01 |
16.01 |
|
2 |
21.0 |
56.65 |
1.39 |
39.45 |
9.43 |
29.50 |
34.00 |
6.85 |
4.50 |
31.75 |
30.83 |
0.18976 |
54.95 |
16.64 |
71.59 |
|
3 |
25.7 |
60.30 |
3.05 |
39.30 |
10.10 |
29.50 |
33.80 |
7.85 |
4.30 |
31.65 |
33.76 |
0.09867 |
55.98 |
16.75 |
72.73 |
|
4 |
27.5 |
60.36 |
3.05 |
38.10 |
10.22 |
29.50 |
32.30 |
12.37 |
2.80 |
30.90 |
34.64 |
0.05633 |
57.38 |
16.93 |
74.31 |
The table below shows the measured and derived data for improved novel BIPV-T module. This data is used for drawing performance curves in Figure 24 and Figure 25.
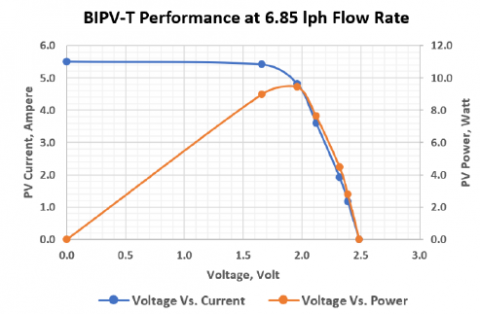
Where, $T_{i}$ is inlet temperature of cooling water, $T_{\circ}$ is outlet temperature of cooling water, $\Delta \mathrm{T}$ is temperature difference between outlet and inlet temperature of cooling water, $\mathrm{T}_{\mathrm{m}}$ is the mean temperature of outlet and inlet temperature of cooling water and $\mathrm{G}$ is the net solar radiation falling on the surface of PV module aperture which is $0.064 \mathrm{m}^{2}(0.253 \mathrm{m}$ x $0.253 \mathrm{m})$.
Table 11 presents the physical and electrical specification of improve BIPV-T module. The electrical performance of uncooled BIPV-T module measured as described in Figure 22.
Figure 23 below shows current, voltage and power characteristics for improved BIPV-T module without cooling.
Table 11. Outdoor performance of BIPV-T before incorporating cooling pipe and insulation
|
Solar Radiation: |
775 W/m2 |
Module Size for Measurements: |
0.253m x 0.253m |
|
Temperature of PV Module: |
48.80°C |
Solar Cell Size (Pseudo Square): |
125mm x 125mm |
|
Open Circuit Voltage: |
2.40 V |
Number of Cells in Module: |
4 Solar Cell |
|
Voltage at Peak Power: |
1.99 V |
Make of Cells: |
Sun Power |
|
Short Circuit Current: |
4.87 Amp |
Module Frame Height |
50mm |
|
Current at Peak Power: |
3.99 Amp |
Module Backsheet |
TPT Black |
|
Peak Power: |
7.94 W |
Encapsulation |
EVA |
Note: Since the module voltage is too low for using automatic module tester a variable resistance and multimeters for voltage and current measurements were used.
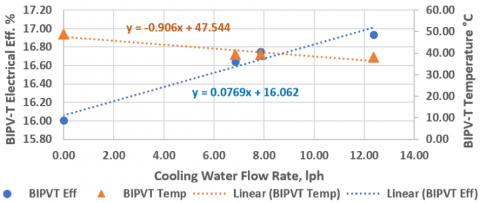
Figure 24 below shows electrical efficiency of improved novel BIPV-T increases at higher flow rate due to drop in cell operating temperature.
Figure 22. Set-up for outdoor testing of small BIPV-T module
Figure 23. Voltage, current & power curve of BIPV=T in Natural Sunlight without cooling
Figure 24. BIPV-T Performance at Varying Cooling Flow Rates
Figure 25. Inlet parameter [(tm – ta)/G, K.m2/W] versus thermal and electrical efficiencies of BIPV-T module
Figure 26. Electrical performance of BIPV-T module at various coolingwater flow rates
6.1. First BIPV-T prototype with novel cooling pipe configuration
The electrical and thermal performance of BIPV-T module tabulated in Table $2,$ Table 3 and Figure 8 and Figure 9 show an increase in electrical and thermal efficiencies with cooling water flow rate. The increase in electrical efficiency obtained is upto $0.75 \%$ ( $5.7 \%$ improve-ment) over uncooled cells. The thermal efficiency based on heat collection in cooling water obtained is upto $57.4 \% .$ These improvements are significant when compared to widely produced polycrystalline cells and modules efficiency increase of only $4 \%$ from year 2009 to 2019 $(0.4 \% / \text { year })[27]$.
The indoor uniformity test shows cell temperatures of novel BIPV-T are within $2.1^{\circ} \mathrm{C}$ at 118 lph flow rate which is close to our target. However, in outdoor uniformity test the cell temperature uniformity increases to $6.1^{\circ} \mathrm{C}$ at 120.64 lph flow rate. The variations in temperature uniformity of 36 solar cell is likely due to variation in wind speed, ambient temperatures and angle of incidence of solar radiation during the course of observation. These improvements are related to the fundamental effect of temperature on the PV module performance. It is well established that the temperature coefficient on cell power is in the range of $-$ 0.3 to $-0.6 \% /{ }^{\circ} \mathrm{C}$ depending of the cell and module technologies. Cooling of cells helps to overcome reduction in power output.
The Figure 8 shows electrical performance of BIPV-T module where scattering of readings is result of variation in atmospheric conditions during outdoor testing. In order to arrive at streamline, result a linear trend line was drawn on the graphical performance. The graph shows improvement in efficiency of BIPV-T module as the cooling water flow rate increases and temperature of module drops.
The Figure 9 shows thermal performance of BIPV-T module with respect to inlet parameter $\left(\mathrm{T}_{\mathrm{m}^{-}} \mathrm{T}_{\mathrm{a}}\right) / \mathrm{G} .$ This is the most standard way of representing thermal performance as per European Union methods of testing [26]. The scattering of points shown in Figure 9 is common for outdoor testing. A linear trendline is shown with equation for use in software like TRNSYS and F-Chart for designing a solar water heating system. Accordingly, these results can be used to design our new water-cooling system with uniform cooling of each cell. The experimental results obtained for fabricated prototype indicate it is possible to $\operatorname{cool}$ individually each cell of a BIPV-T with novel concept of cooling pipe configuration.
The purpose of indoor test was to check if the fabricated BIPV-T module with Novel water-cooling configuration can provide uniform temperature for all solar cells as envisaged. The indoor testing observation will show any shortcoming in fabrication of BIPV-T module with novel cooling circuit that was designed to cool individual solar cells uniformly. For this purpose, hot water was circulated in the cooling pipe at various flow rate and pressure. The temperature of individual solar cells was noted using infrared thermometer. The result showed fairly uniform distribution from $0.7^{\circ} \mathrm{C}$ to $2.5^{\circ} \mathrm{C}$ which is satisfactory for a product made with minimum facility using low conductivity conductive silicone for bonding.
The outdoor performance for the unitorm cooling in natural sunlight is presented in Table 7 and Table $8 .$ As compared to indoor results, the outdoor results show more temperature variation in solar cells. The highest variation recorded was $6.5^{\circ} \mathrm{C}$ and the variation ranged from $0.2^{\circ} \mathrm{C}$ to $6.5^{\circ} \mathrm{C}$. There are several reasons may be attributed to higher variation in cell temperature as compared to indoor testing. First, in the outdoor testing temperature recording of individual cell with infrared temperature meter was a challenge. The laser beam was not very visible in sunlight to focus exactly on the center of each solar cells. Secondly, coming too close to the module caused shadowing. Thirdly, during the temperature reading for 36 cells the periodic wind gust would change the temperature. Fourthly, the cooling water tank capacity was limited to allow long duration cooling as the BIPV-T was tested in single pass method. Fifthly, the cooling water could not be pressurized as much as in indoor testing due to pump limitations. The pressure ranged from
0.6 bar to 0.8 bar whereas indoor the pressure could be increased up to 3bar. The sixth but most important observation that graphical distribution and variation of cell temperatures in columns and rows shows that temperature variation is following sinusoidal pattern. That means center of the BIPV-T module is operating at higher temperature than edges. This may be attributed to improper contact of copper plate and cooling water pipe in the center of BIPV-T module.
6.2. Second improved BIPV-T with novel cooling pipe configuration
The objective of fabricating and testing an improved model of BIPV-T module is to make a more compact cooling pipe configuration and to improve the conductivity of water pipe to copper plate. In first proto-type cooling pipe design the height of inlet and outlet headers pipes was very close to the frame height of the solar module due to use of Tee and Elbow joints. This resulted in difficulty in filling the insulation properly at the back of BIPV-T module. In addition, cost of material and labor was too high, the conductivity of thermally conductive adhe-sive used to attach cooling pipe to plate was very low 2.2W/m.K.
With the improved design proposed in this paper, the copper plate was braced to copper plate providing far better conductivity of 78 W/m.K (SnAg 96.5/3.5). The height of inlet and outlet header pipes reduced to 1/4th of earlier design.
Since the copper cooling plate attached to cooling pipe was fabricat-ed as same size as 4 solar cells the extra space around the solar cells was masked with tape for testing. The solar cells used are the highest efficiency solar cells available in market. The test results show that even for high efficiency solar cells the output power and efficiency drop substantially at high operating temperatures. As the solar cells are cooled the efficiencies increases. The test data in Table 10 and Figure 24 shows that at cooling water flow rate of 12.37 liters per hour the efficiency increases to 16.9% from 16.01% without cooling. An in-crease of 0.89% (8.8% over uncooled) in electrical efficiency and addi-tional 57.38% thermal efficiency is good achievement. At this flow rate the output water gains 2.8°C temperature. The electrical and thermal efficiency obtained is good considering the fact that cooling plate is not glued to the back of BIPV-T module. The outlet water temperature of 32.3°C is obtained in single pass cooling which is additional thermal energy as compared to uncooled BIPV-T modules. This enhances the overall efficiency of BIPV-T system.
One of the main objectives of the novel cooling pipe configuration was to achieve uniform cell temperature in a PV module. In this case the uniformity is shown in Table 5.14. At highest flow rate the temper-ature difference between highest to lowest cell temperature is 1.3°C where as for lowest cooling water flow the difference increases to 4.2°C. Considering that copper plate attached to cooling water pipe is not pasted to the back of PV module this temperature uniformity is satisfactory. It is expected to achieve much better uniformity if cooling plate is laminated to the back of PV module.
Table 12. Solar Cell temperature uniformity in BIPV-T module at various flow rates and weather conditions
|
Stagnation (no cooling) |
Cooling Water Flow Rate 6.85 lit/hour (0.75bar) |
||||||
|
Solar Radiation, W/m2: |
933 |
Cell1 |
Cell3 |
Solar Radiation, W/m2: |
885 |
Cell1 |
Cell3 |
|
Ambient Temp., °C: |
24.0 |
47.4 °C |
48.1 °C |
Ambient Temp., °C: |
21.0 |
38.8 °C |
43.0 °C |
|
Input Water Temp., °C: |
N/A |
Cell2 |
Cell4 |
Input Water Temp., °C: |
29.5 |
Cell2 |
Cell4 |
|
Output Water Temp., °C: |
N/A |
45.7 °C |
47.0 °C |
Output Water Temp., °C: |
34.0 |
39.3 °C |
42.7 °C |
|
Wind Speed, kmph: |
11.0 |
Av. Temp: |
47.05 °C |
Wind Speed, kmph: |
5.0 |
Av. Temp: |
40.95 °C |
|
Cooling Water Flow Rate 7.85 lit/hour (0.75bar) |
Cooling Water Flow Rate 12.37 lit/hour (0.75 bar) |
||||||
|
Solar Radiation, W/m2: |
885 |
Cell1 |
Cell3 |
Solar Radiation, W/m2: |
845 |
Cell1 |
Cell3 |
|
Ambient Temp., °C: |
25.7 |
38.0 °C |
39.9 °C |
Ambient Temp., °C: |
21.0 |
37.9 °C |
38.5 °C |
|
Input Water Temp., °C: |
29.5 |
Cell2 |
Cell4 |
Input Water Temp., °C: |
29.5 |
Cell2 |
Cell4 |
|
Output Water Temp., °C: |
33.8 |
38.7 °C |
40.6 °C |
Output Water Temp., °C: |
31.0 |
38.1 °C |
39.2 °C |
|
Wind Speed, kmph: |
5.0 |
Av. Temp: |
39.30 °C |
Wind Speed, kmph: |
5.0 |
Av. Temp: |
38.43 °C |
Note: Cooling plate and pipe is not glued to the back of solar module.
7.1. First BIPV-T prototype with novel cooling pipe configuration
A BIPV-T module with novel water-cooling pipe configuration per-forms well. It improves electrical performance of BIPV-T module and delivers extra thermal energy thereby increasing overall efficiency of BIPV-T module. The water output temperature reaches 37°C at low flow rates which is good for space heating. To improve electrical per-formance flow rate can be increased and a booster thermal panel can be used for pre-heat water from BIPV-T module for higher temperature. Also, this BIPV-T uses very low insulation of 50mm, 6.7R whereas most other PV-T and BIPV-T modules use 100mm thick glass wool insulation that causes module temperature to increase. So far none of the publications has shown individual cell temperature in a PV-T or BIPV-T modules. One reference [10] has shows highest and lowest temperature of PV-T module (non uniform module temperature) is indicated as 10°C while another study [23] shows cell temperature difference of 32°C. The cell uniformity in BIPV-T module with novel cooling pipe layout shows only 6.1°C as presented in Table 8.
7.2. Second improved BIPV-T with novel cooling pipe configuration
The improved design using new method of fabricating low height, high conductivity design for novel cooling pipe for cooling individual solar cells is successful. The bracing of the cooling pipe to copper plate improved the heat transfer between by a factor of 35 as compared to conductive adhesive. Since the copper plate is very thin only low tem-perature bracing was possible for which Sn/Ag alloy was used for brac-ing. Even at low bracing temperature the copper plate developed wavi-ness which cause non uniform contact at the back of PV module. In-stead of bracing ultrasonic welding will prevent waviness and improve the heat transfer further due to copper to copper contact. Inspite of imperfections the electrical efficiency in 2nd prototype is much better than 1st prototype.
Another significant achievement in improved fabrication technique is in the cost reduction in which dropped from Cad$ 2,500 /m2 from 1st prototype to Cad$ 400/m2 for the second one.
Further reduced height of cooling pipe provides flexibility of lami-nating the cooling pipe at the back of PV module under vacuum to improve thermal contact with copper plate. By making positive contact at the back of PV module instead of allowing air gap will improve the performance further.
[1] Y. Hu, W. Cao, J. Ma, S. J. Finney, and D. Li, IEEE Transactions on Device and Materials Reliability, 14(4), 951 (2014).
[2] D. C. Jordan, T. J. Silverman, B. Sekulic, and S. R. Kurtz, Research and Applications, 25(7), 583 (2017).
[3] P. Manganiello, M. Balato, and M. Vitelli, IEEE Transactions on Industrial Electronics, 62(11), 7276 (2015).
[4] M. Rosa-Clot, P. Rosa-Clot, and G. M. Tina, Solar Energy, 85(10), 2433 (2011).
[5] K. Wilson, D. D. Ceuster, and R. A. Sinton, 2006 IEEE 4th World Conference on Photovoltaic Energy Conference, l(1), 916 (2006).
[6] M. K. Fuentes, "A simplified thermal model for flat-plate photovol-taic arrays," Sandia National Labs., Albuquerque, NM (USA), 1987.
[7] J. W. Stultz, Journal of Energy, 3(6), 363 (1979).
[8] T. Matuska, "Theoretical analysis of solar unglazed hybrid photo-voltaic-thermal liquid collector" in Proceedings of the Eurosun, 2010.
[9] H. A. Zondag and W. G. J. V. Helden, "Stagnation temperature in PVT collectors," PV in Europe, Rome (Italy), 2002.
[10] I. L. Alboteanu, C. F. Ocoleanu, and C. A. Bulucea, "Cooling sys-tem for photovoltaic module," Recent Researches in Enviromental and Geolegical Sciences, pp. 133-138, 2012.
[11] K. Touafek, M. Haddadi, and A. Malek, Applied solar energy, 45(3), 181 (2009).
[12] K. A. Moharram, M. Abd-Elhady, H. Kandil, and H. El-Sherif, Ain Shams Engineering Journal, 4(4), 869 (2013).
[13] K. Sopian, G. L. Jin, M. Y. Othman, S. H. Zaidi, and M. H. Ruslan, "Advanced absorber design for photovoltaic thermal (PV/T) Col-lectors," Recent Researches in Energy, Environment, and Land-scape Architecture, 2011.
[14] K. Toufek, M. Haddadi, and A. Mk, Applied Solar Energy, 47(3), 189 (2011).
[15] M. Bakker, H. Zondag, and W. Van Helden, Design of a dual flow photovoltaic/thermal combipanel. Stan Ackermans Institute, 2002.
[16] M. Bosanac, B. Sorensen, K. Ivan, H. Sorensen, N. Bruno, and B. Jamal, "Photovoltaic/thermal solar collectors and their potential in Denmark," Final Report, EFP Project, www. solenergi. dk/rapporter/pvtpotentialindenmark. pdf, 2003.
[17] M. Y. Othman, A. Ibrahim, G. L. Jin, M. H. Ruslan, and K. Sopian, Renewable Energy, 49, 171 (2013).
[18] P. Dupeyrat, C. Ménézo, M. Rommel, and H.-M. Henning, Solar Energy, 85(7), 1457 (2011).
[19] R. Hosseini, N. Hosseini, and H. Khorasanizadeh, "An experimen-tal study of combining a photovoltaic system with a heating sys-tem," in World Renewable Energy Congress-Sweden; 8-13 May; 2011; Linköping; Sweden, 2011, no.057: Linköping University Electronic Press, pp. 2993.
[20] T. T. Chow, Applied energy, 87(2), 365 (2010).
[21] A. Ibrahim et al., WSEAS Transactions on Environment and Deve-lopment, 5(3), 321 (2009).
[22] A. Popescu, C.-E. Panaite, and O.-V. Stadoleanu, "Combined Pho-tovoltaic and Thermal Solar Panels-Enhanced Energy Conversion and Heat Transfer," Termotehnica Supliment, vol. 1, 2013.
[23] L. Brottier, J.-M. Hugo, and R. Bennacer, "An innovative PV-T collector: CFD and experimental results," vol. Research Gate, 2014.
[24] Stine, W. B., and G. Michael, "Power from the Sun," ed, 2001.
[25] D. Y. Goswami, F. Kreith, and J. F. Kreider, Principles of solar engineering. CRC Press, 2000.
[26] J. A. Duffie and W. A. Beckman, Solar engineering of thermal processes. John Wiley & Sons, 2013.
[27] "Best Research-Cell Efficiency Chart." NREL. https://www.nrel.gov/pv/cell-efficiency.html (accessed 2018).