Giulio Lorenzini![]() | Mehrdad Ahmadi Kamarposhti*
| Mehrdad Ahmadi Kamarposhti*![]() | Mohammad Kanan
| Mohammad Kanan![]() | Ahmed Solyman
| Ahmed Solyman![]() | Mohammad Hafez Ahmed
| Mohammad Hafez Ahmed![]() | El Manaa Barhoumi
| El Manaa Barhoumi![]()
© 2024 The authors. This article is published by IIETA and is licensed under the CC BY 4.0 license (http://creativecommons.org/licenses/by/4.0/).
OPEN ACCESS
Reliability assessment in distribution systems done using network methods in which failure probability distributions and negative components repair or the severity of failure and repair is clear. However, in real networks and Industry, these amounts are usually not precise and it conforms a probability distribution. Fuzzy logic is a typical method to consider indecision in engineering parameters, responsible consumption and production. As an innovation, in this paper using fuzzy logic, uncertainties are considered in assessment reliability indicator. Affecting factors on the rate of line failure and distribution transformers and factors affecting load consumption is considered as membership functions and by choosing the right rules failure rate and restoration time, are gained by considering the effect of these uncertainties.
reliability, failure rate, distribution system, fuzzy logic, uncertainties
One of the rudimentary problems in reliability studies of distribution systems is the unobtainability of adequate statistics. The lack of sufficient data makes the approximation of reliability input parameters an unrealistic and uncertain estimate. Uncertainty in the estimation of these parameters also causes the intended reliability indices to be inexact and impractical. In the 1960s, a new logic for qualitative analysis and the use of inaccurate data has been introduced under the name of fuzzy logic. This logic can give a mathematical form to many concepts that have expressive and imprecise variables and permit their quantitative analysis. In this logic, it is possible to use the verbal information of the related experts in influential the failure rate and the repair time of the equipment. By using the views of experts, the failure rates and repair time of the equipment can be expressed more realistically and well [1-5].
In reference [1], the effect of numerous manipulating components on the transmission line is defined mathematically using fuzzy logic and the risk index for each feeder is stated as an output index, and by using this index, to regulate the feeders with high risk and the system design has been completed according to its reliability. In reference [2], assuming that the probability of failure of production and transmission units is recognized, the effect of ecological conditions on the reliability of the power system and the uncertainties in the calculation of the reliability of the system were measured, and the EENS and ELC files of the power system were calculated. In reference [3], a method based on fault effect analysis techniques and minimum cut-sets was used to evaluate system reliability and load points. In addition, the uncertainties of component accessibility were taken into account by applying the theory of fuzzy sets in the identification of minimum cassettes. In reference [6], by selecting a triangular membership function, the failure rates and repair time are expected to be fuzzy and by using fuzzy numbers and relations, the coefficients of the load facts of the system have been gained in a fuzzy form. In reference [7], with the help of fuzzy logic, the effect of two-mode and three-mode climate modeling was examined in the evaluation of power system reliability indicators. In references [3, 6], by means of fuzzy sets and considering a triangular membership function for the failure rate and repair time, they calculated the reliability files with fuzzy relations and the factors that affect the failure rate. In addition, the effective repair time has not been considered as a fuzzy input. In reference [2], the circumstances of temperature, season and load consumption curve are considered as fuzzy input to calculate the failure rate of the transmission line, but in this paper, using fuzzy logic, the factors affecting the failure rate of distribution lines and transformers and Also, the factors affecting the amount of load consumption are considered as input membership functions for distribution systems, and by selecting suitable rules, failure rate and repair time are attained by considering the effect of these uncertainties. By trying on the RBTS-bus2 network using MATLAB software, system reliability files for seven diverse inputs are calculated and the results are compared.
Failure rate and repair time of elements are significant input parameters and have an excessive impact on system reliability files. Due to the high availability of equipment, usually adequate data is not available to define their credible behavior. As a result, the values considered for failure rate and repair time of elements are inexact and indeterminate values. Ambiguity and accuracy in the estimation of input parameters make the calculated reliability files inexact and impractical. To model this uncertainty, the use of fuzzy set theory is recommended. This theory is a strong mathematical form to deal with inexact phenomena. The variety of operators in this theory permits the designer to select what is appropriate according to his knowledge of the system. Another advantage of using the theory of fuzzy sets is to use the verbal information of the relevant experts in determining the failure rate and repair time of the equipment. When no statistics are available, it is possible to estimate failure rates and repair time of elements using the experiences of an expert. When the statistics of failure and repair time of system elements are also available, by using the views of experts, the failure rates and repair time of equipment can be defined more realistically and well.
In order to contain uncertainties in the reliability assessment of distribution systems, it is essential to consider the factors affecting the failure rate and consumption load. In the following, we present these factors.
2.1 Factors affecting load consumption
Electrical load consumption is a function of numerous parameters, including weather conditions such as temperature, wind speed, and air illumination. Each day of the week has its own load curve. The load curves of working days are parallel; the load consumption curves on holidays are dissimilar from working days. In different seasons of the year, according to the special conditions of each season, such as the length of the day and the illumination of the air, the load curve changes. Thus, these factors should be considered in load modeling [8].
Inputs:
a) Load consumption curve
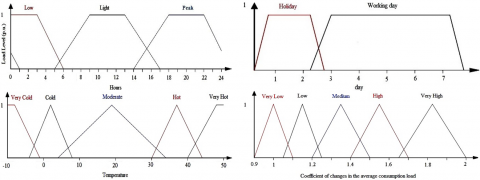
For this variable, three fuzzy sets "low" in the range of hours [6–24], "light" in the range of hours [5–17] and "peak" in the range of hours [14–24] are explained with linear membership functions.
b) Days of the week
One of the important and beneficial factors on the amount of variations in the consumption load of subscribers is the type of days of the week (working days or holidays). Therefore, for this variable, two fuzzy sets of "holiday" and "working" days are explained with linear membership functions.
c) Temperature
For this variable, five fuzzy sets of "very cold" air in the range of [–1 to –10] degrees Celsius, "cold" in the range of [– -4 to 8] degrees Celsius, "moderate" in the range of [4 to 34] degrees Celsius, "hot" in the range of [30 to 44] degrees Celsius and "very hot" in the range of [40 to 50] degrees Celsius are defined with linear membership functions.
Output: The output variable is the coefficient of variation of the average consumption load, and with five fuzzy sets, the amount of variation is "very low" in the range [0.9 to 1.1], "low" in the range [1.05 to 1.25], "moderate" in the range [1.1 to 2/5], "high" in the range [1.1 to 4.7] and "very high" in the range [1.2 to 65], with Linear membership functions are defined.
2.2 Factors affecting the failure rate of lines
Inputs:
a) Life
One of the prominent factors in growing the failure rate is the life of electrodes and distribution system lines. With the growth in life, the failure rate also increases. For this purpose, three fuzzy sets of young, working age and old have been cleared for the life variable.
b) Being in danger
Exposure to risk is another factor that has been used as a fuzzy input affecting the failure rate. To be at risk, we can point to factors such as the number of trees on the road, rocky areas, and other factors that lead to a rise in the fault on the distribution lines because of the geographic environments of the region. This variable is defined with three fuzzy sets of low, medium and high risk and with linear membership functions. The level of risk can also be determined giving to the environmental conditions and the view of experts.
c) Weather conditions
The failure rate of most elements is a function of the weather conditions in which they are located. The IEEE standard [4] divides the environmental conditions into three categories; Natural, adversative and disastrous storms. Normally, the first and second states of the climate (two-state climate model) are considered, and the third state is typically dispensed to examine the effect of major system disorders. Those weather conditions that are unproductive or less effective on the failure rate are classified in the natural weather category, and those that leave excessive effects are classified in the adversative weather category. Take examples of adversative weather contain storms with lightning, tornadoes, snow and ice [2, 5, 7]. The weather variable is defined by two fuzzy sets of normal and disapproving weather.
d) Failure rate of similar networks
Other factors determining the failure rate are the failure statistics of elements, which are available from the system history, and the failure rates of elements in similar systems. Thus, we can describe these failure rates as a fuzzy input. The failure rate variable of similar networks is defined by two fuzzy sets of good and bad failure rates.
Output: The output variable of the line failure rate and the output variable of the repair time are cleared by four fuzzy sets, good, suitable, bad and very bad, with linear membership functions. Concerning the repair time of the lines, it should be specified that in adversative weather conditions and according to the IEEE standard, repairs are very slow and sometimes incredible. Therefore, in case of adversative weather conditions, the repair time is very severely represented by the fuzzy set. But in appropriate weather conditions, if the specified inputs are unsuitable and according to the rules created in the rules database, the repair time will increase.
2.3 Distribution transformers
Distribution transformers are considered the most important equipment in distribution systems, and due to their importance in providing system reliability and their high price, they have a superior place. Major factors affect the existence of faults and breakdowns of the transformer, among which we deliberate the following factors as phase inputs and affect the breakdown rate of the transformer [9].
a) Life
As the equipment ages, the rate and probability of injury to them rises, and if they are not used correctly and properly during use, the possibility of flaws in them increases. The life variable is expressed with three fuzzy sets: young, working and old, with linear membership functions.
b) Being in danger
Among the other factors that increase the rate of failure and burning of distribution transformers are coincidences such as car collisions (due to their installation in exposed space), earthquakes, or geographical conditions such as environments with high moisture and rainfall, etc. Thus, the variable of being at risk of transformer is defined with three phase sets of low, medium and high-risk levels. The operator can determine the risk factor of the transformer conferring to the experience and environmental conditions.
c) Exploitation
Factors such as failure to track the instructions during transportation and installation of the transformer, failure to install suitable defensive equipment on the transformers, use of unsuitable oils, and failure to carry out periodical appointments are caused by the lack of proper use of the transformer, which affects the failure rate of the transformer. According to the mentioned cases, two fuzzy sets of proper and unsuitable exploitation are defined for the exploitation variable. According to the history of the system, experience, expert opinions and environmental situations, the operator can determine the variable coefficient of process [10-12].
Output: The output variable is the coefficient of change in transformer failure rate, which is characterized by four fuzzy sets, good, good, bad, and very bad, with linear membership functions.
Since the duration of transformer repair is long (according to reference [4], 200 hours), and in emergencies, transformer replacement is used (according to reference [4], 10 hours), so in this paper, the time Trans repair was considered as a deterministic variable according to reference [4]. An example of input and output membership functions is represented in Figure 1.
Figure 1. The membership function of the load input and output
2.4 Base of rules and fuzzy inference
Table 1. Some of the rules used in the load consumption rule base
|
Then |
If |
Law |
||
|
Load factor curve |
Temperature |
Day |
load level |
|
|
1 |
Hot |
Holiday |
Low |
1 |
|
2 |
Hot |
working |
Low |
2 |
|
2 |
Normal |
Holiday |
Light |
3 |
|
3 |
Normal |
working |
Light |
4 |
|
3 |
Normal |
Holiday |
Peak |
5 |
|
4 |
Very hot |
Holiday |
Peak |
6 |
|
4 |
Normal |
working |
Peak |
7 |
|
5 |
Hot |
working |
Peak |
8 |
After selecting the membership functions, the correct rules must be selected. Mamdani's minimum-maximum method has been used in the rules and fuzzy inference section. In this method, among the membership degrees of various inputs of a fuzzy rule in each range, the lowest membership degree is selected and transferred to the output.
Table 2. Some of the rules used in the rules database related to transformer
|
Then |
If |
Law |
||
|
Coefficient Curve Trans Failure |
Production and Exploitation |
Riskiness |
Life |
|
|
Good |
Desirable |
Low |
Young |
1 |
|
Desirable |
Desirable |
Medium |
Young |
2 |
|
Bad |
Undesirable |
High |
Young |
3 |
|
Bad |
Desirable |
High |
Working periods |
4 |
|
Very bad |
Undesirable |
High |
Working periods |
5 |
|
Bad |
Undesirable |
Low |
Old |
6 |
|
Very bad |
Undesirable |
High |
Old |
7 |
This work is repeated for all the rules in the entire range of variable changes, and the output fuzzy variable must be converted to a real number using one of the non-fuzzy methods. The AND and OR methods used are min and max, respectively, and the non-fuzzy centroid method is used. The definition of rules is often based on human logic. For example, we know that if the lifetime of the transformer is long, the failure rate will increase, or during peak hours, the level of load demand will be higher. An example of selection rules for load and transformer is shown in Tables 1 and 2.
To achieve mathematical studies, the bus distribution system number 2 of the RBTS standard network has been used. The total average load of this network is 12.291 megawatts, which contains household, commercial, office and small uses. Data correlated to the structure and average amount and sort of load at consumption points as well as the reliability parameters related to this network are provided in reference [4]. By programming in MATLAB atmosphere, system reliability indicators have been calculated. Table 3 shows the input values of fuzzy sets for seven diverse modes in order to evaluate the reliability indicators. The basic values of system indicators [4] and the results of system reliability indicators in three protection states for different input modes are specified in Table 4. The bar chart of these indicators is exposed in Figures 2-5.
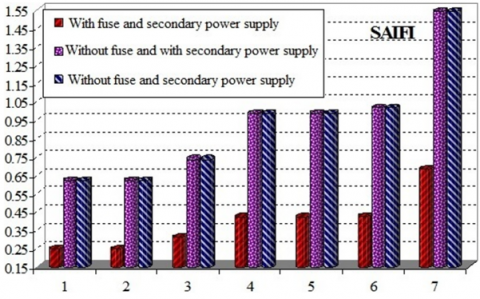
Figure 2 displays that the maximum value of SAIFI is for mode 7. In this case, the climate conditions are in the hostile weather range, and giving to the IEEE standard definition for the two-mode weather model, the failure rate in this case may be several times the failure rate in favorable climate conditions, and according to the rules written in the rule base, if such weather happens, the failure rate and repair time are in a very unsuitable situation, and thus the indicators that are affected by these rates have several variations.
Table 3. Various inputs for evaluating system reliability indicators
|
Transformer Inputs (Life, Risk, Exploitation) |
Load Inputs (Load Level, Type of Day, Temperature) |
Line Inputs (Life, Vulnerability, Weather, Similar Networks) |
State |
|
(15, 0.5, 0.3) |
(7, 3, 30) |
(12, 0.2, 0.2, 0.065) |
1 |
|
(15, 0.5, 0.3) |
(7, 1, 30) |
(12, 0.2, 0.2, 0.065) |
2 |
|
(15, 0.5, 0.3) |
(7, 3, 30) |
(12, 0.2, 0.2, 0.075) |
3 |
|
(25, 0.5, 0.3) |
(7, 3, 30) |
(21, 0.6, 0.2, 0.065) |
4 |
|
(25, 0.5, 0.3) |
(20, 3, 35) |
(21, 0.6, 0.2, 0.065) |
5 |
|
(25, 0.7, 0.7) |
(20, 3, 35) |
(21, 0.6, 0.2, 0.065) |
6 |
|
(15, 0.5, 0.3) |
(7, 3, 30) |
(12, 0.2, 0.95, 0.065) |
7 |
Table 4. RBTS-bus2 network system indicators for seven modes of different inputs in three different performance conditions
|
Status |
RBTS |
1 |
2 |
3 |
4 |
5 |
6 |
7 |
|
|
SAIFI |
0.248 |
0.2485 |
0.2485 |
0.3102 |
0.4206 |
0.4206 |
0.4251 |
0.6844 |
* |
|
0.602 |
0.6029 |
0.6029 |
0.7360 |
0.9872 |
0.9872 |
1.0172 |
1.5420 |
** |
|
|
0.602 |
0.6029 |
0.6029 |
0.7360 |
0.9872 |
0.9872 |
1.0172 |
1.5420 |
*** |
|
|
SAIDI |
3.61 |
3.6133 |
3.6133 |
3.7780 |
4.8133 |
4.8831 |
5.7820 |
7.1352 |
* |
|
6.74 |
6.8132 |
6.8132 |
7.1102 |
9.1162 |
9.1162 |
10.8261 |
12.6669 |
** |
|
|
9.93 |
9.9828 |
9.9858 |
10.3604 |
13.2285 |
13.2285 |
15.8061 |
18.1664 |
*** |
|
|
CAIDI |
14.55 |
14.5406 |
14.5406 |
12.1763 |
11.6094 |
11.6094 |
13.6012 |
10.4249 |
* |
|
11.19 |
11.2999 |
11.2999 |
9.6602 |
9.2338 |
9.2338 |
10.6427 |
8.2143 |
** |
|
|
16.49 |
16.5616 |
16.5616 |
14.0760 |
13.3992 |
13.3992 |
15.5383 |
11.7805 |
*** |
|
|
ASUI |
0.000412 |
0.000412 |
0.000412 |
0.000431 |
0.000557 |
0.000557 |
0.000660 |
0.000816 |
* |
|
0.000769 |
0.000777 |
0.000777 |
0.000811 |
0.001040 |
0.001040 |
0.001225 |
0.000144 |
** |
|
|
0.001134 |
0.001139 |
0.001139 |
0.001182 |
0.001510 |
0.001510 |
.001804 |
0.002073 |
*** |
|
|
ENS |
37746 |
37762 |
33988 |
39721 |
51874 |
63546 |
74726 |
80225 |
* |
|
67197 |
65884 |
59299 |
69089 |
89149 |
109208 |
129002 |
128438 |
** |
|
|
149188 |
147739 |
132973 |
153046 |
195980 |
240085 |
287097 |
273309 |
*** |
|
|
AENS |
19.78 |
19.7917 |
17.8135 |
20.8184 |
27.1878 |
33.3051 |
39.1650 |
24.0470 |
* |
|
35.22 |
34.5305 |
31.0792 |
36.2103 |
46.7240 |
57.2369 |
67.6115 |
67.3156 |
** |
|
|
78.19 |
77.4317 |
69.6924 |
80.2128 |
102.7190 |
125.8308 |
150.4706 |
143.2438 |
*** |
* Presence of fuse and alternative power supply; ** Presence of alternative power supply and absence of fuse; *** Absence of fuse and alternative power supply
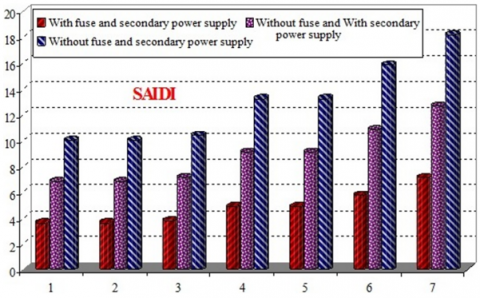
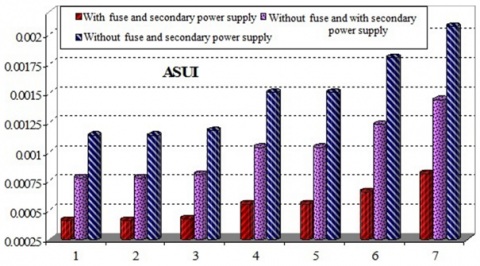
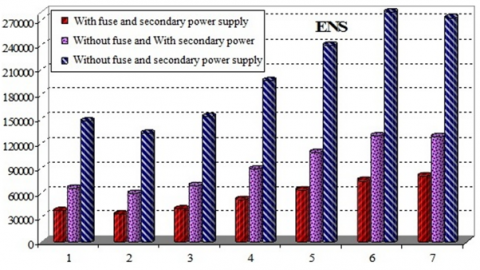
Also, by comparing the inputs of mode 1 and 2 as well as modes 4 and 5 in Figures 2-4, it can be observed that the indicators of these modes are equal to each other. Because the only difference between these modes is related to the load inputs, which has no effect on the failure rate and repair time of the system, so the indicators affected by the failure rate and repair time (SAIFI, SAIDI, ASUI) are equal for these modes. In Figure 5, you can observe the effect of changing the inputs related to the load on the ENS index. The comparison between the inputs of mode 1 and 2 as well as modes 4 and 5 displays this.
In the operating mode with the presence of a fuse and an alternative power source, due to advanced protection and load supply from the secondary source, the system indicators are more favorable. However, in the other two performance conditions, we observe the failing of these indicators due to the lack of protection and supply of load for disconnected load points.
Figure 2. SAIFI index for 7 different inputs in three situations
Figure 3. SAIDI index for 7 different inputs in three situations
Figure 4. ASUI index for 7 different inputs in three situations
Figure 5. ENS index for 7 different inputs in three situations
In this paper, consuming fuzzy logic, the uncertainties caused by the factors affecting the failure rate of lines and transformers, as well as the factors affecting the consumption load, were taken into account to gain system reliability indicators. The results gained from diverse inputs, taking into account these uncertainties, presented a more realistic evaluation than the basic indicators of the target test network. In addition, by comparing the results of indicators for different inputs, it is possible to compare the influence of each or a set of the inputs had a better or worse effect on system indicators.
[1] Lang, B.P., Pahwa, A. (2000). Power distribution system reliability planning using a fuzzy knowledge-based approach. IEEE Transactions on Power Delivery, 15(1): 279-284. https://doi.org/10.1109/61.847263
[2] Fotuhi, M., Ghafouri, A. (2007). Uncertainty consideration in power system reliability indices assessment using fuzzy logic method. In 2007 Large Engineering Systems Conference on Power Engineering, Montreal, QC, Canada, pp. 305-309. https://doi.org/10.1109/LESCPE.2007.4437398
[3] El-Sayed, M.A.H., Seitz, T., Montebaur, A. (1994). Fuzzy sets for reliability assessment of electric power distribution systems. In Proceedings of 1994 37th Midwest Symposium on Circuits and Systems, Lafayette, LA, USA, pp. 1491-1494. https://doi.org/10.1109/MWSCAS.1994.519089
[4] Allan, R.N., Billinton, R., Sjarief, I., Goel, L., So, K. S. (1991). A reliability test system for educational purposes-basic distribution system data and results. IEEE Transactions on Power Systems, 6(2): 813-820. https://doi.org/10.1109/59.76730
[5] Allan, R.N. (2013). Reliability Evaluation of Power Systems. Springer Science & Business Media.
[6] Paci, A., Bualoti, R., Çelo, M. (2021). Evaluation of distribution system reliability indices using fuzzy reasoning approach. European Journal of Electrical Engineering and Computer Science, 5(3): 1-8. https://doi.org/10.24018/ejece.2021.5.3.264
[7] Kavousifard, A., Samet, H. (2011). Consideration effect of uncertainty in power system reliability indices using radial basis function network and fuzzy logic theory. Neurocomputing, 74(17): 3420-3427. https://doi.org/10.1016/j.neucom.2011.05.017
[8] Al-Ani, B.R.K., Erkan, T.E. (2022). A study of load demand forecasting models in electricity using artificial neural networks and fuzzy logic model. International Journal of Engineering, 35(6): 1111-1118.
[9] Thango, B.A., Nnachi, A.F., Dlamini, G.A., Bokoro, P.N. (2022). A novel approach to assess power transformer winding conditions using regression analysis and frequency response measurements. Energies, 15(7): 2335. https://doi.org/10.3390/en15072335
[10] Yahya, K., Attar, H., Issa, H., Dofan, J.A.R., Iqteit, N.A., Yahya, A.E., Solyman, A.A.A. (2023). Investigating and calculating the temperature of hot-spot factor for transformers. Indonesian Journal of Electrical Engineering and Computer Science, 30(3): 1297-1307. https://doi.org/10.11591/ijeecs.v30.i3.pp1297-1307
[11] Makahleh, F.M., Amer, A., Manasrah, A.A., Attar, H., Solyman, A.A., Kamarposhti, M.A., Thounthong, P. (2023). Optimal management of energy storage systems for peak shaving in a smart grid. Computers, Materials and Continua, 75(2): 3317-3337. https://doi.org/10.32604/cmc.2023.035690
[12] Ahmed, Q.I., Attar, H., Amer, A., Deif, M.A., Solyman, A.A. (2023). Development of a hybrid support vector machine with grey wolf optimization algorithm for detection of the solar power plants anomalies. Systems, 11(5): 237. https://doi.org/10.3390/systems11050237