Akram N. Merzah*![]() | Abbas H. Abbas
| Abbas H. Abbas![]() | Firas M. Tuaimah
| Firas M. Tuaimah![]()
© 2024 The authors. This article is published by IIETA and is licensed under the CC BY 4.0 license (http://creativecommons.org/licenses/by/4.0/).
OPEN ACCESS
The transmission network of a power system is important in connecting interactions between the generation and distribution sides. A significant aspect in the power system profile is voltage improvement. This study intends to examine the impact of inserting High Voltage Direct Current (HVDC) on the system's voltage stability, network power losses and power transfer capacity of transmission network under several cases of load contingency. IEEE 57-Bus test system is used for testing the addition of HVDC transmission based on genetic algorithm. Modeling of point-to-point HVDC transmission and multi-terminal HVDC transmission is carried out using the Power System Simulator for Engineering (PSS/E) version 32 Package Program (A collection of computer programs and organized data files called PSS/E software was developed by Siemens PTI to handle the fundamental tasks of power system performance simulation work). The system's performance was compared with and without the HVDC inserted under different loading scenarios: 5%, 10%, and 20% of the total load. The comparative results can show that active power losses at the normal load case are reduced by 55.714% after inserting point to point HVDC topology, and after inserting multi-terminal HVDC topology reduced by 68.214%. Also, the reactive power losses reduce by 55.714% after inserting point to point HVDC topology and after inserting multi-terminal HVDC topology reduced by 66.830% at the same case. The results shown that inserting HVDC Transmission to the system gives better improvement in bus voltage profile and a significant reduction in total network power losses and increase in power transfer capacity of transmission network. The results also showed that multi-terminal HVDC transmission is better in voltage improvement and total power losses reduction when HVDC Transmission is added to the system.
voltage improvement, HVDC, network power losses, load contingency, PSS/E
In order to transfer significant amounts of electrical energy, high voltage alternating current (HVAC) systems have been in use for more than a century [1]. However, typical HVAC transmission systems have certain limitations, including lowered reliability in transporting electrical energy, issues with environmental, efficiency, losses in power, cost of construction, and the system's voltage stability, which is of the highest priority [2-4]. Since a significant portion of failures in a power system are caused by voltage instability, voltage stability has been recognized as an essential need for a power system to operate safely and reliably [5]. Due to the weakness of the HVAC system, massive power losses observed in long-distance transmission lines [6] are what lead to the majority of voltage stability issues. Therefore, the usage of High Voltage Direct Current (HVDC) to enhance AC system networks' quality and reliability has been based on the requirement to enhance transmission capacity as well as reduced plant running costs. This is because the HVDC system has the advantage of overcoming the limitations of the AC systems [7]. The reactive power consumption issue that occurs during line charging, especially on cable lines HVAC, is resolved by HVDC. Reactive power in transmission lines, which limits the power transmission capacity in HVAC technology and increases the current which led to increase transmission losses, is not a problem in the HVDC system. Comparing this to AC high-voltage lines, more power can be transmitted over longer distances at a lower cost. HVDC systems allow for the connection of different electrical systems and regions divided by a large water area, as well as the connection of continental regions with island regions (such as the UK with Europe). Also, they are used in linking power systems in situations where frequency maintenance is problematic or there are different frequencies [8]. Even while renewable energy sources have many advantages, their intermittent nature and the distance between major installations and demand centers have a significant impact on the stability of the connected grid. In the presence of large renewable energy installations, HVDC systems are used as a solution for reliable and stable grid operation, this is a significant benefit of HVDC, when offshore areas employ this technology [9]. Hybrid HVAC/HVDC transmission systems provide several advantages over HVAC transmission systems, such as a better voltage profile, lower cost of losses, system stability, better efficiency and management, and lower short circuit current levels [10, 11]. Depending on the application, location, and technology, there are two main topologies for HVDC transmission systems: two-terminal and multi-terminal HVDC transmission systems [12].
In numerous studies, the HVDC transmission system has been investigated for its ability to transmit large amount of electricity over a long distance while minimizing power loss in the HVDC transmission line [13]. In the study [14], the power loss in the HVDC transmission line has been calculated and simulated in two models. Jafarishiadeh et al. [15] suggested a novel dc/dc converter for linking multiple DC grids with various voltage levels while additionally controlling the power flow between them. In the study [16], HVDC links/bipolar connections were added in a power system to enhance the voltage profile. Several load scenarios are also taken into account to assess the system's voltage stability and power loss. Telang and Bedekar [17] described a method of applying the load increase pattern that involves changing the active and reactive loads at all of the load buses under consideration simultaneously, in order to create stressed circumstances for load flow analysis using STATCOM. In the study [18], a simulation of the integration of the HVDC network shows a reduction in power loss with increasing demand. The optimal power flow of the combined AC and VSC-MTDC system has a growing impact on the transmission grid, as shown in the study [19], to decrease active power losses [20]. Kumar et al. [21] proposed the idea of network change to improve the voltage profile and decrease transmission losses in the practical utility transmission network.
In this paper, the power transmission stability is enhanced by inserting the HVDC to the IEEE-57bus test system during load contengincy. At the most studies deal with adding HVDC into the AC system, the position for adding HVDC to the system found by analyzing the Newton-Raphson load flow results and replacing out the AC line with the highest losses with an HVDC link. In this study, the best location for adding HVDC to the system is determined using the genetic algorithm in order to improve voltage magnitude and reduce the total power losses.
2.1 HVDC system converter model
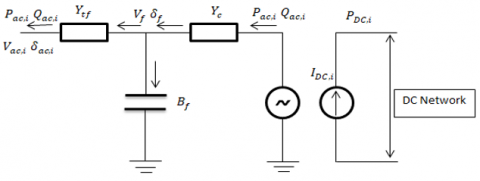
With the use of the Pulse-Width Modulation (PWM) switching technique, the VSC converter serves as a controlled voltage source [22]. The output voltage of the VSC converter can be modulated in terms of magnitude and phase angle using this technique. Figure 1 shows the VSC converter's equivalent circuit model, where $Y_c$ phase reactor's complex admittance; $V_f, \delta_f$ and $B_f$ respectively, denote for the voltage magnitude, voltage phase angle, and susceptance of the filtering bus; The converter transformer's complex admittance is represented by $Y_{t f}$; The voltage magnitude and voltage phase angle on $\mathrm{AC}$ bus $i$ are, $V_{a c, i}$ and $\delta_{a c, i}$, respectively. $I_{D C, i}$ is the current flow of the bus $i$ on the DC side.
Figure 1. Equivalent circuit model for a VSC station [22]
2.2 Power flow analysis of the AC/DC hybrid system
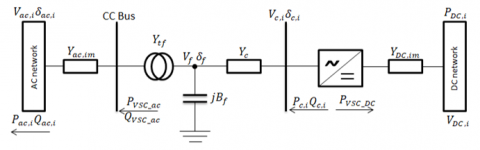
Finding the voltage on each bus, its magnitude, its phase angle, and the active and reactive power values passing via each transmission, is the key information of power flow analysis [23,24]. When HVDC is added into the system, the process becomes more complicated, difficult. The Jacobian matrix will alter when more variables from each VSC of the HVDC are added. The computational process and computational time will rise during load flow steps as more partial derivatives with regard to HVDC variables are added and the Jacobian matrix needs to be updated with each repetition. This problem makes the procedure more challenging and intricate. The $\mathrm{AC} / \mathrm{DC}$ hybrid system, that provides the network with power flow, is shown in detail in Figure 2, where $P_c$ and $Q_c$ denote, respectively, the active power and reactive power injected by the VSC converter at the AC terminal; $P_{V S C D C}$ is the power that the VSC converter injects at the DC terminal, and the active and reactive power that VSC injects into the AC network after flowing via the phase reactor and converter transformer, respectively, are denoted as $P_{V S C ~ a c}$ and $Q_{V S C a c}$. The output of $P_{V S C ~ a c}$ and $Q_{V S C a c}$ at the Common Coupling Bus (CC Bus) are able to adjust by adjusting the alternating current passing into the phase reactor. The VSC converter's proper modulation can do this [25].
Figure 2. Converter and hybrid AC-DC system [25]
The AC line $Y_{a c, i m}$ linking the AC bus $i$ and $m$ will allow the power exiting the coming coupling bus to pass through. Eventually, after passing through the admittance $Y_{a c, i m}$. The $\mathrm{AC}$ bus I will be provided with both active power and reactive power, which are represented by $P_{a c, i}$ and $Q_{a c, i}$, respectively. When passing through the admittance of the $\mathrm{DC}$ line $Y_{D C, i m}$, the active power eventually reaches the DC bus $i$, which is identified by $P_{D C, i}$, in the DC network.
The following are the general power flow equations for the AC/DC hybrid system:
AC side equations:
Active power and reactive power that VSC injects into the AC network via the converter transformer are represented by the variables $P_{V S C ~ a c}$ and $Q_{V S C ~ a c}$, respectively, may be expressed as [26]:
$P_{V S C_{-} a c}=-V_{a c}^2 G_{t f}+V_{a c} V_f\left[G_{t f} \cos \left(\delta_{a c}-\delta_f\right)\right.\left.+B_{t f} \sin \left(\delta_{a c}-\delta_f\right)\right]$ (1)
$Q_{V S C_{-a c}}=V_{a c}^2 B_{t f}+V_{a c} V_f\left[G_{t f} \sin \left(\delta_{a c}-\delta_f\right)\right.\left.-B_{t f} \cos \left(\delta_{a c}-\delta_f\right)\right]$ (2)
In the expression $Y_{t f}=G_{t f}+j B_{t f}$, where $G_{t f}$ and $B_{t f}$ stand for the converter transformer's conductance and susceptance, respectively, the index $j$ indicates the fictitious value of the complex variable, in this case the admittance $Y_{t f}$. $\delta_f$ is represented the voltage phase angle of the filtering bus.
Converter side equations:
The converter side power flow equation is known with respect to the complex voltages of the converter's $\mathrm{AC}$ terminal $V_c$ and filter bus $V_f$ [27]:
$P_c=V_c^2 G_c-V_f V_c\left[G_c \cos \left(\delta_f-\delta_c\right)\right.\left.-B_c \sin \left(\delta_f-\delta_c\right)\right]$ (3)
$Q_c=-V_c^2 B_c+V_f V_c\left[G_c \sin \left(\delta_f-\delta_c\right)\right.\left.+B_{t f} \cos \left(\delta_f-\delta_c\right)\right]$ (4)
where, $Y_c=G_c+j B_c$ and $\delta_c$ and $\delta_f$ represent the voltage phase angles of ac terminal side of converter and filter bus respectively. $G_c$ and $B_c$ are the conductance and susceptance of the phase reactor, respectively.
DC side equations:
A resistive network can be used to model DC systems with including DC the injection of voltages and currents at the other node of the converter [28]. The following equation can be used to express the injection current and the active power flow of the DC network [29]:
$I_{D C, i}=Y_{D C, i m}\left(V_{D C, i}-V_{D C, m}\right)$ (5)
$P_{D C, i}=V_{D C, i} Y_{D C, i m}\left(V_{D C, i}-V_{D C, m}\right)$ (6)
where, $Y_{D C, i j}=\frac{1}{R_{D C, i j}}, R_{D C, i j}$ is represented the resistance of DC line $i-m ; V_{D C, i}$ and $V_{D C, m}$ are the voltage of the DC bus $i$ and $m$ respectively.
Given the voltage of the CC Bus, which is the same as the AC bus's initial voltage $V_{a c}$, and the converter's AC terminal side power $S_c=P_c+j Q_c$, thus, the converter's current $I_c$ can be expressed as follows:
$I_c=\frac{S_c}{V_{a c}}$ (7)
And converter power loss $P_{\text {Loss }}$ is
$P_{\text {Loss }}=a+b * a b s\left(I_c\right)+c * a b s\left(I_c\right)^2$ (8)
AC network equations:
The power flow of all buses in the AC network can be expressed using the following equations:
$P_{a c, i}=V_{a c, i} \sum_{m=1}^n V_{a c, m}\left[G_{a c, i m} \cos \left(\delta_{a c, i}-\delta_{a c, m}\right)\right.\left.+B_{a c, i m} \sin \left(\delta_{a c, i}-\delta_{a c, m}\right)\right]$ (9)
$Q_{a c, i}=V_{a c, i} \sum_{m=1}^n V_{a c, m}\left[G_{a c, i m} \sin \left(\delta_{a c, i}-\delta_{a c, m}\right)\right.\left.+B_{a c, i m} \cos \left(\delta_{a c, i}-\delta_{a c, m}\right)\right]$ (10)
The nonlinear equation of AC power flow, which is expressed as follows, is solved using the Newton-Raphson method:
$\Delta M_{a c}=-J_{a c} \Delta X_{a c}$ (11)
where, $\Delta X_{a c}$ is represented the $\mathrm{AC}$ voltage's incremental vector and its phase angle, $J_{a c}$ the Jacobian matrix of AC network and $\Delta M_{a c}$ is the formula for power mismatch at the CC Bus which is described as:
$\begin{gathered}\Delta M_{a c}=0 \\ P_{G D i}-P_{a c, i}-P_{c, i}=0\end{gathered}$ (12)
$Q_{G D i}-Q_{a c, i}-Q_{c, i}=0$ (13)
where, $P_{G D i}$ and $Q_{G D i}$ are represented the active and reactive power generated at bus $i, P_{a c, i}$ and $Q_{a c, i}$ are obtainable from Eqs. (9) and (10) respectively, and $P_{c, i}$ and $Q_{c, i}$ are the active and reactive power generated at converter $i$, and it can obtined from Eqs. (3) and (4). Since the converter power loss is already known according to Eq. (8), the power that is injected to the $\mathrm{DC}$ grid is as follows:
$P_{D C, i}=P_{c, i}-P_{\text {Loss }, i}$ (14)
The DC side equation, which is defined as follows, can be solved using the Newton Raphson method.
$\Delta M_{D C}=-J_{D C} \Delta X_{D C}$ (15)
where, $\Delta X_{a c}$ is represented the $\mathrm{DC}$ voltage's incremental vector and its phase angle, $J_{a c}$ the Jacobian matrix of DC network and $\Delta M_{a c}$ is the formula for power mismatch at the PCC bus which is described as:
$\Delta M_{D C}=P_{D C, i}-P_{c, i}-P_{\text {Loss }, i}=0$ (16)
The effectiveness of HVDC in terms of voltage profile improvement, network loss reduction, and capacity of power transfer under load-increasing scenarios is demonstrated through simulations. The best locations will be selected in order to achieve best performance during the study state and the AC grid's contingency conditions. This will improve grid operation by determining the optimal location for the installation of HVDC lines. The optimal location for installing HVDC transmission is determined using a genetic algorithm (GA) to improve system voltage and minimize total network power losses (as the objective function). GA drives the planned evolution of solutions to optimization problems defined by the objective function $f(x)$ by initiating the process of natural selection [30]. Where, $x=x_1, x_2, \ldots x_N$ is the $\mathrm{N}$-dimensional vector of optimization parameters. The basic elements of the GA's rules are genes and chromosomes. GA encodes the optimization parameters as either a real number (integer) array called real encoding or as a binary string called binary encoding. A chromosome is a chain of genes that has the following form,
Cromosome $=\left[a_1^1 a_2^1 \ldots a_{L 1}^{, 1}, a_1^2 a_2^2 \ldots a_{L 2}^{, 2}, a_1^N a_2^N \ldots a_{L N}^N\right]=\left[x_1, x_2, \ldots . x_N\right]$
where, $\left[x_1, x_2, \ldots x_N\right]$ is the $\mathrm{N}$-dimensional vector of optimization parameter, $a$ is a gene and $L_i$ is the code string's length for the $i$ parameter. A genetic algorithm has three essential parts, which are followed by crossover rate and mutation processes which are carried out until the best population has been identified [31].
In this study, real encoding has been used. A population is a set of candidate solutions given in pertinent optimization problems. Each candidate solution is retained in a chromosome after being quantitatively validated in a fitness function. The initial population is created by random generation. By using the Roulette Wheel technique, chromosomes are selected based on the initial population's rules. The number of generations, iterations, crossover probability, mutation probability, and population size are among the optimization controlling data that are presented. The genetic algorithm is used to determine the best position for HVDC link that may be inserted in the IEEE-57 bus system using MATLAB program, and then the modeling and simulation for the test system and HVDC terminals are based on PSS/E. Parameters are used in genetic algorithm coding shown in Table 1.
Table 1. Code parameters for a genetic algorithm
|
Parameter |
Value |
|
population size |
40 |
|
Crossover |
0.8 |
|
Fitness limit |
10-12 |
|
choice function |
Stochastic uniform |
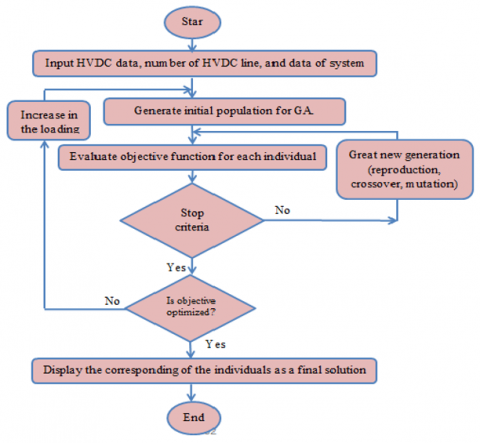
Figure 3. GA optimization flowchart for HVDC position
The GA procedures can be summed as follow:
Step 1: Input data of HVDC, number of HVDC line, bus and line data of the test system.
Step 2: generating the initial genetic algorithm population.
Step 3: Run the Newton Raphson load flow program.
Step 4: For each individual, objective values are calculated.
Step 5: Choose a new population from the old population using the calculation algorithm based on the objective values.
Step 6: GA carries out selection crossover, and mutation to the chosen population in order to generate new solutions.
Step 7: Objective values are calculated based on the new chromosome, and the use of these functions in the population.
Step 8: if the termination criterion has been satisfied, the GA process can be stopped and print the best individual, while if not go to step 5.
A proposed GA arithmetic flow chart is shown in Figure 3.
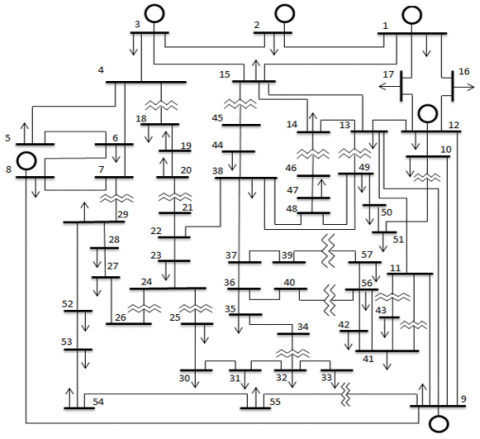
As a case study, the IEEE-57 bus system shown in Figure 4 has been modified by inserting HVDC components into point to point and multi-terminal HVDC transmission system topologies. The IEEE bus-57 system standards' values and data are given in the study [32].
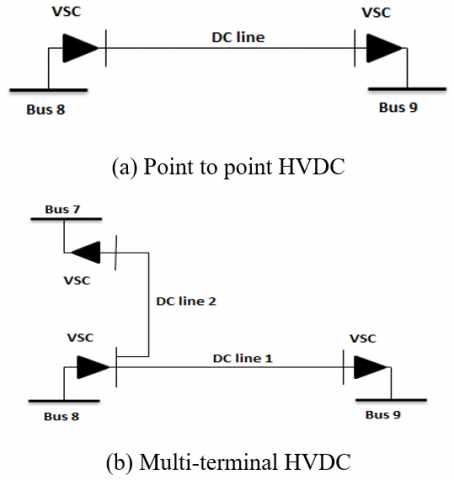
According to results from genetic algorithm, the best location for the DC link is between buses (8 & 9) for point to point HVDC topology, while the multi-terminal HVDC topology is placed between buses (8 & 7) and (8 & 9) by removing the ac interconnection between buses and replacing it with the DC link, giving the minimum possible total network losses for each type of topology as shown in Figure 5 (a) and Figure 5 (b) respectively.
Figure 4. The IEEE-57 bus test system
Figure 5. Point to point and Multi-terminal HVDC
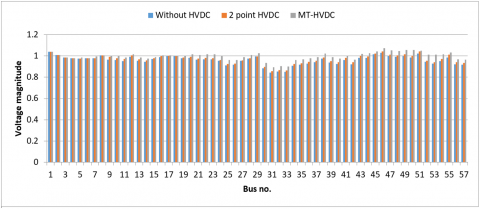
Figure 6. Comparative of voltage profile without and with HVDC
Three cases are considered here which are as follows:
Case 1: load (active and reactive) increased by 5% from the normal load.
Case 2: load (active and reactive) increased by 10% from the normal load.
Case 3: load (active and reactive) increased by 20% from the normal load.
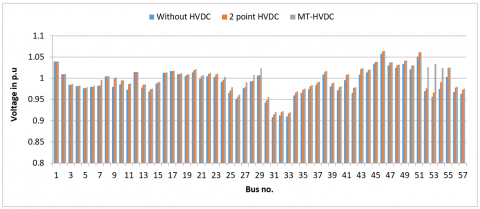
Power System Simulator for Engineering (PSS/E version 32 Package Program) was used to carry out a load flow analysis of the three cases using the Newton-Raphson method. When compared to an AC network, the voltage profile of busses has improved with the installation of an HVDC transmission system. Figure 6 shows the difference in each bus' voltage magnitude before and after the two topologies of HVDC transmission system were installed and the normal load case.
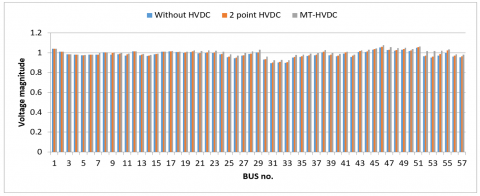
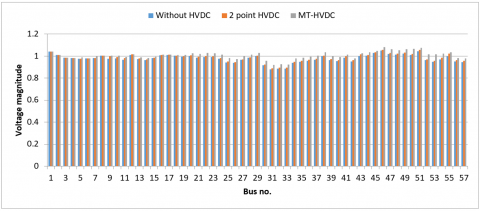
After inserting an HVDC transmission system under varying load, the majority of bus voltages in the system that are adjacent to or connecting to converter station buses have improved. The analysis for the percentage improvement of voltage profile at all the buses for case 1, case 2 and case 3 can be evaluated by ($V_{\text {impro. }}=\frac{V_{w / H V D C},-V_{w o / H V D C}}{V_{w o / H V D C}} * 100 \%$), where, $V_{w o / H V D C}$ and $V_{w / H V D C}$ are the voltage magnitude without and with adding HVDC respectively. For example the voltage magnitude of bus 29 is improved from 1.0065 p.u to 1.0239 p.u with improvement in voltage magnitude by (1.73%) at normal load case because it connected to bus 7 which is the converter station connected to it, at case 3 (load increased by 20%) the voltage magnitude of bus 29 is also improved from 0.9946 p.u to 0.9969 p.u after inserting point to point HVDC topology, and improved to 1.0261 p.u with improvement in voltage magnitude by (2.93%) after inserting multi-terminal HVDC topology. Even though the load grew by 20%, the voltage decreased from 1.0065 p.u. to 0.9969 p.u., but after inserting multi-terminal HVDC topology, the voltage improved to 1.0261 p.u. with an improvement of 2.93%. The improvement of Voltage profile at all the buses for case 1, case 2 and case 3 shown in Figure 7, Figure 8 and Figure 9 respectively.
Figure 7. Voltage profile without and with HVDC transmission for load increased by 5%
Figure 8. Voltage profile without and with HVDC transmission for load increased by 10%
Figure 9. Voltage profile without and with HVDC transmission for load increased by 20%
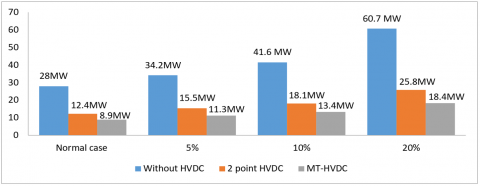
Figure 10. Comparative of active power losses without and with HVDC transmission for all cases
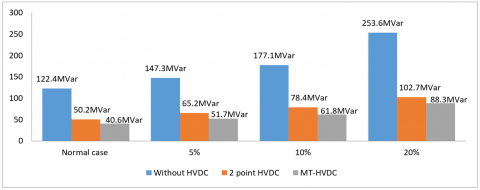
Figure 11. Comparative of reactive power losses without and with HVDC transmission for all cases
The comparative of the real and reactive network power losses before and after inserting the two topologies of HVDC transmission system are shown in Figure 10 and Figure 11 respectively.
Figure 10 and Figure 11 show how each case results in consistently reduced total network power losses, including active power and reactive power. The analysis for the percentage reduction in active and reactive power losses for each case of load increment can be evaluated by (Loss $_{\text {Red. }}=\frac{\text { Loss }_{w o / H V D C} \text { Loss }_{w / H V D C}}{\text { Loss }_{w o / H V D C}} * 100 \%$), where, $\operatorname{Loss}_{w o / H V D o}$ and $\operatorname{Loss}_{w / H V D C}$ are the total losses without and with adding HVDC respectively. It shows that active power losses for the normal load case (as an example) are reduced from 28MW to 12.4MW with percentage reduction of 55.714% for point to point HVDC topology and for multi-terminal HVDC topology reduced to 8.9MW with percentage reduction of 68.214%. When the total network losses decrease, the loadability of the transmission network will increase and then the power transfer capacity of transmission network can be increased. Table 2 and Table 3 show the comparative percentage reduction in active and reactive power losses between point to point and multi-terminal HVDC transmission system for all cases of load increment.
Table 2. Comparative percentage reduction in active power losses for all cases
|
Load Increment |
Point to Point |
MT-HVDC |
Reduction % |
|
|
|
MW |
MW |
Point to Point |
MT-HVDC |
|
Normal case |
12.4 |
8.9 |
55.714% |
68.214% |
|
5% |
15.5 |
11.3 |
54.678% |
66.959% |
|
10% |
18.1 |
13.4 |
56.490% |
67.788% |
|
20% |
25.8 |
18.4 |
57.495% |
69.686% |
Table 3. Comparative percentage reduction in reactive power losses for all cases
|
Load Increment |
Point to Point |
MT-HVDC |
Reduction % |
|
|
|
MVar |
MVar |
Point to Point |
MT-HVDC |
|
Normal case |
50.2 |
40.6 |
55.714% |
66.830% |
|
5% |
65.2 |
51.7 |
54.678% |
64.901% |
|
10% |
78.4 |
61.8 |
56.490% |
65.104% |
|
20% |
102.7 |
88.3 |
57.495% |
65.181% |
In this paper, utilizing the IEEE-57 Bus as a testing system, the impact of tow topologies of HVDC transmission system on enhancing power system performance is studied. Point to point and multi-terminal HVDC transmission are represented using the PSS/E. The simulation is run using the increasing load procedure (case 1, 2, and 3) to put the system under stress. The results show that inserting an HVDC transmission system improves the voltage profile under increased load for the two topologies. Additionally, a significant reduction in total active and reactive network loss is noticed. From the result, the active power and reactive power losses are reduced by 55.714% and 58.987% respectively after implementation of the point to point HVDC transmission system while for the multi-terminal HVDC transmission system, the active and reactive power losses are reduced by 68.214% and 66.830% respectively under normal load case. In a power system, there is a limit to the number of HVDC lines that can be installed, because of the cost of the devices and the influences on the reactive power at the system. The reduction of total network losses will lead to an improvement in the loadability of the transmission network, which will allow it to transmit greater amounts of power.
|
PSS/E |
Power System Simulator for Engineering |
|
HVDC |
High Voltage Direct Current |
|
MT - HVDC |
Multi-Terminal High Voltage Direct Current |
|
VSC |
Voltage Source Convertor |
|
CC |
Common Coupling |
|
$Y_C$ |
admittance of phase reactor |
|
$Y_{t f}$ |
admittance converter transformer's |
|
$V_f$ |
voltage magnitude of the filtering bus |
|
$B_f$ |
susceptance of the filtering bus |
|
$I_{D C, i}$ |
the current flow on the DC side |
|
$P_{a c, i}$ |
active power of converter 's ac side |
|
$Q_{a c, i}$ |
reactive power of converter 's ac side |
|
$P_{D C, i}$ |
active power of dc side |
|
MW |
Mega Watt |
|
MVar |
Mega Var |
|
Greek symbols |
|
|
$\delta_c$ |
voltage phase angles of ac terminal side of converter |
|
$\delta_f$ |
voltage phase angles of ac terminal side filter bus |
[1] Wei, Y., He, Q., Sun, Y., Sun, Y., Ji, C. (2013). Improved power flow algorithm for VSC-HVDC system based on high-order Newton-type method. Mathematical Problems in Engineering, 2013. https://doi.org/10.1155/2013/235316
[2] Cao, J., Du, W., Wang, H.F., Bu, S.Q. (2013). Minimization of transmission loss in meshed AC/DC grids with VSC-MTDC networks. IEEE Transactions on Power Systems, 28(3): 3047-3055. https://doi.org/ 10.1109/TPWRS.2013.2241086
[3] Ebrahim, M.A., Ahmed, M.N., Ramadan, H.S., Becherif, M., Zhao, J. (2021). Optimal metaheuristic-based sliding mode control of VSC-HVDC transmission systems. Mathematics and Computers in Simulation, 179: 178-193. https://doi.org/10.1016/j.matcom.2020.08.009
[4] Renedo, J., Ibrahim, A.A., Kazemtabrizi, B., Garcia-Cerrada, A., Rouco, L., Zhao, Q., Garcia-Gonzalez, J. (2019). A simplified algorithm to solve optimal power flows in hybrid VSC-based AC/DC systems. International Journal of Electrical Power & Energy Systems, 110: 781-794. https://doi.org/10.1016/j.ijepes.2019.03.044
[5] Amroune, M., Bouktir, T., Musirin, I. (2019). Power system voltage instability risk mitigation via emergency demand response-based whale optimization algorithm. Protection and Control of Modern Power Systems, 4(1): 1-14. https://doi.org/10.1186/s41601-019-0142-4
[6] Alfira, W.W.S., Nappu, M.B., Arief, A. (2019). Under voltage load shedding simulation for southern Sulawesi power system with integration of wind power plants. In Journal of Physics: Conference Series. IOP Publishing, 1175(1): 012128. https://doi.org/10.1088/1742-6596/1175/1/012128
[7] Wei, Y., Zheng, Z., Sun, Y., Wei, Z., Sun, G. (2013). Voltage stability bifurcation analysis for AC/DC systems with VSC-HVDC. In Abstract and Applied Analysis. Hindawi, Vol. 2013. https://doi.org/10.1155/2013/387167
[8] Hu, Y., Lei, X., Huang, T., Zhang, Y. (2022). Frequency coordinated control for the asynchronous interconnected power system with multiple HVDC links. IEEE Access, 10: 108216-108225. https://doi.org/10.1109/ACCESS.2022.3213359
[9] Saadeh, O., Abu Sba, B., Dalala, Z. (2023). Power system analysis of moving from HVAC to HVDC in the presence of renewable energy resources. Journal of Electrical and Computer Engineering, 2023. https://doi.org/10.1155/2023/8527308
[10] Xiao, H., Sun, K., Pan, J., Li, Y., Liu, Y. (2021). Review of hybrid HVDC systems combining line communicated converter and voltage source converter. International Journal of Electrical Power & Energy Systems, 129: 106713. https://doi.org/ 10.1016/j.ijepes.2020.106713
[11] Wiget, R., Andersson, G. (2012). Optimal power flow for combined AC and multi-terminal HVDC grids based on VSC converters. In 2012 IEEE Power and Energy Society General Meeting, IEEE, pp. 1-8. https://doi.org/10.1109/PESGM.2012.6345448
[12] Li, Z., Zhan, R., Li, Y., He, Y., Hou, J., Zhao, X., Zhang, X.P. (2018). Recent developments in HVDC transmission systems to support renewable energy integration. Global Energy Interconnection, 1(5): 595-607. https://doi.org/10.14171/j.2096-5117.gei.2018.05.009
[13] Thepparat, P., Retzmann, D., Ogée, E., Wiesinger, M. (2013). Smart transmission system by HVDC and FACTS. In 2013 IEEE Grenoble Conference, pp. 1-6. https://doi.org/10.1109/PTC.2013.6652137
[14] Kasangala, F.M., Atkinson-Hope, G. (2013). Electrical energy losses and costs evaluation of HVDC and UHVDC transmission lines. In 2013 Proceedings of the 10th Industrial and Commercial Use of Energy Conference, pp. 1-7.
[15] Jafarishiadeh, S., Dargahi, V., Khoshkbar Sadigh, A., Farasat, M. (2018). Novel multi‐terminal MMC‐based dc/dc converter for MVDC grid interconnection. IET Power Electronics, 11(7): 1266-1276. https://doi.org/ 10.1049/iet-pel.2017.0164
[16] Salih, T.K.M., Hussain, Z.S., Ahmed, F.S. (2022). Voltage profile enhancing using HVDC for 132KV power system: Kurdistan case study. Journal of Engineering, 28(1): 52-64. https://doi.org/ 10.31026/j.eng.2022.01.04
[17] Telang, A.S., Bedekar, P.P. (2018). Application of PSAT to load flow analysis with STATCOM under load increase scenario and line contingencies. Journal of the Institution of Engineers (India): Series B, 99: 17-23. https://doi.org/ 10.1007/s40031-017-0292-6
[18] Abbas, Z.N., Tuaimah, F.M. (2021). Optimal location of high voltage direct current (HVDC) transmission line using genetic algorithm. In IOP Conference Series: Materials Science and Engineering. IOP Publishing, 1076(1): 012008. https://doi.org/10.1088/1757-899X/1076/1/012008
[19] Yazdi, S.S.H., Fathi, S.H., Monfared, J.M., Amiri, E.M. (2014). Optimal operation of multi terminal HVDC links connected to offshore wind farms. In 2014 11th International Conference on Electrical Engineering/Electronics, Computer, Telecommunications and Information Technology (ECTI-CON), IEEE, pp. 1-6. https://doi.org/10.1109/ECTICon.2014.6839885
[20] Jasim, A.M., Jasim, B.H., Neagu, B.C., Attila, S. (2023). Electric vehicle battery-connected parallel distribution generators for intelligent demand management in smart microgrids. Energies, 16(6): 2570. https://doi.org/ 10.3390/en16062570
[21] Kumar, P., Swarnkar, N.K., Mahela, O.P. (2023). Loss reduction and voltage profile improvement in utility grid using optimal restructuring of transmission network. In 2023 Third International Conference on Advances in Electrical, Computing, Communication and Sustainable Technologies (ICAECT), IEEE, pp. 1-6. https://doi.org/10.1109/ICAECT57570.2023.10118287
[22] Khan, M.O., Zaman, Jamali, S., Noh, C.H., Gwon, G.H., Kim, C.H. (2018). A load flow analysis for AC/DC hybrid distribution network incorporated with distributed energy resources for different grid scenarios. Energies, 11(2): 367. https://doi.org/ 10.3390/en11020367
[23] Fikri, M., Cheddadi, B., Sabri, O., Haidi, T., Abdelaziz, B., Majdoub, M. (2018). Power flow analysis by numerical techniques and artificial neural networks. In 2018 Renewable Energies, Power Systems & Green Inclusive Economy (REPS-GIE), IEEE, pp. 1-5. https://doi.org/10.1109/REPSGIE.2018.8488870
[24] Hu, X., Hu, H., Verma, S., Zhang, Z.L. (2012). Physics-guided deep neural networks for power flow analysis. IEEE Transactions on Power Systems, 36(3): 2082-2092. https://doi.org/ 10.1109/TPWRS.2020.3029557
[25] Feng, W., Yuan, C., Shi, Q., Dai, R., Liu, G., Wang, Z., Li, F. (2019). Using virtual buses and optimal multipliers to converge the sequential AC/DC power flow under high load cases. Electric Power Systems Research, 177: 106015. https://doi.org/10.1016/j.epsr.2019.106015
[26] Karami, E., Gharehpetian, G.B., Mohammadpour, H., Khalilinia, A., Bali, A. (2020). Generalised representation of multi‐terminal VSC‐HVDC systems for AC-DC power flow studies. IET Energy Systems Integration, 2(1): 50-8. https://doi.org/10.1049/iet-esi.2019.0051
[27] Beerten, J., Cole, S., Belmans, R. (2010). Implementation aspects of a sequential AC/DC power flow computation algorithm for multi-terminal VSC HVDC systems. In Proceedings 9th IET International Conference on AC and DC Transmission (ACDC2010), 21-21. https://doi.org/10.1049/cp.2010.1013
[28] Kouadri, R, Slimani, L, Bouktir, T, Musirin, I. (2018). Optimal power flow solution for wind integrated power in presence of VSC-HVDC using ant lion optimization. Indonesian Journal of Electrical Engineering and Computer Science, 12(2): 625-633. https://doi.org/10.11591/ijeecs.v12.i2.pp625-633
[29] Gao, Y, Li, S, Dong, W, Lu, B. (2018). Decoupled AC/DC power flow strategy for multiterminal HVDC systems. International Journal of Emerging Electric Power Systems, 19(1): 20170171. https://doi.org/10.1515/ijeeps-2017-0171
[30] Shukla, T., Singh, S., Naik, K. (2010). Allocation of optimal distributed generation using GA for minimum system losses in radial distribution networks. International Journal of Engineering, Science and Technology, 2(3): 94-106. https://doi.org/10.4314/ijest.v2i3.59178
[31] Hassan S.K., Tuaimah F.M. (2020). Optimal location of unified power flow controller genetic algorithm based. International Journal of Power Electronics and Drive Systems, 11(2): 886-894. https://doi.org/10.11591/ijpeds.v11.i2.pp886-894
[32] Sharma P., Batish N. (2015). Computational analysis of IEEE 57 bus system using NR method. International Journal of Advanced Research in Electrical, Electronics and Instrumentation Engineering, 4(11). https://doi.org/10.15662/IJAREEIE.2015.0411050