Maher Yahya Salloom*![]() | Mohammad Yahya Almuhanna
| Mohammad Yahya Almuhanna![]()
© 2024 The authors. This article is published by IIETA and is licensed under the CC BY 4.0 license (http://creativecommons.org/licenses/by/4.0/).
OPEN ACCESS
A proportional valve is one of the important parts used by the hydraulic control system to make precise operations. Flow control and direction are functions of proportional directional control valves. Despite this being important there are some problems, such as in flow control. This operation may cause the deficient performance of the actuator and the system. This paper presents the improvement of the performance hydraulic proportional directional control valve. The work suggests that the proportional valve would only be able to control flow in one direction, either metering in or out. Accordingly, the proposed work arrangement suggests many types of setups, by adding two-way directional control valves. Firstly, to know how the performance is deficient, some case is studied analytically. To demonstrate that, the prepared proposal has been made. The setup of the proposed arrangement is achieved. The arrangement is subject to simulation and tested practically to study the performance. The work included the electronic setup. As a result, the work leads to the improvement of the operation of proportional valves to control flow in one direction. The result of this investigation is to think about a new sort of valve that might be created to function better. As well as can also be made more flexible operations, depending on the type of load effect and flow control needed. In conclusion, the valve operation can be used as meter-in or meter-out flow controlling.
proportional directional valve, cartridge valve, meter-in and meter-out, positive load, negative pressure
Hydraulic proportional directional control valves are an essential part of the design of precision hydraulic systems. Where it gives a high possibility of controlling the speed and position of the movement of hydraulic cylinders, in its many applications. It also can control the direction and flow at the same time. This is done through electronic control. Due to the importance of this type of valve, as well as its many applications, which have been widely adopted in technological development. Where it merged with electronic and computer control in the completion of accurate and important tasks. Where the researchers were interested in studying, developing, and, improving the work of these valves to ensure good performance and high accuracy while reducing problems in their work.
To investigate the pilot-operated flow control valve performance using digital switching. Theoretical, simulation, and experimental were studied. The flow can be regulated proportionally with pulse width modulation [1]. The design of the directional control valve was studied when replacing hydraulic with water. The behavior of water under certain pressure and flow was investigated. The performance that was studied, was good [2]. To improve the operation of the pilot-operated directional control valve, a novel design was present. The dynamic characteristic performance of the valve was studied with dead zone influence and damping. As well as improve the control accuracy [3]. By using CFD simulation can obtain the influence flow force. A new valve core design improved the structure. A good dynamic effect was obtained [4]. The valve core shapes of nuclear power plants have been studied to obtain the characteristics. The water level was regulated. The numerical method was established. The relationships between the outlet flux and different core shapes of the valve were carried out [5]. The suitable 2/3 proportional hydraulic control valve has been proposed to work for large flow and high pressure. The proposed design overcomes the discontinuous flow and large pressure shock. The nonlinear and step response characteristics were predicted and analyzed [6]. The improvement of the performance of pilot-operated proportional hydraulic control valves has been studied. The study was done by using four spool structures with different shapes of grooves. The simulation analysis result and experimental comparison provide a reference for how can select the type of groove of spool and structure proportional valve [7]. To improve the dynamic performance of the proportional control valve, the digital pilot operation has been proposed. The proposed design uses two nozzle flapper valves. The principle of working and mathematical model was determined. An analysis of the influence of control and structure parameters has been done. As well simulation and theoretical work have been done and compare the results have been obtained. The performance valve has improved [8]. The improvement of the performance of pilot-operated proportional hydraulic control valve which has internal feedback has been studied. The closed-loop control has been used with a fuzzy PID controller to improve the performance of the valve. The result shows the reduction of hysteresis and linearity was improved. Also, the overshoot and settling time was reduced [9]. Optimization strategy, a simulation model, and the experimental validation of the solenoid valves have been studied. The FEM model of compere between 2D and 3D models has been done. The result showed the proposed design is feasible when compared between conventional and optimal actuators [10]. Two-way Cartridge Flow Control Valve causes a loss in energy when used with a high-pressure supply. The new proposed 3-way flow valve allows the flow to be slightly above the required pressure [11]. Mechatronics systems are integrated between hardware and software to become one system. Digital control is one of the most control integrations to chief the desired performance system. The performance of the proportional control valve can be improved using an optimizing controller as well design of the Hardwar of the valve. A cascaded evaluation is better than a real approach [12].
Through a survey of the researchers' work, it was noted that they did not focus on solving the problems of flow effects by using proportional valves. The motivation that made this work unique has not been addressed by researchers before and is also essential in practical applications. So this work had to be done. The problem is that there is a process of controlling the inflow and outflow to and from the hydraulic actuator. This problem causes a lot of poor performance of the system.
To overcome these problems in the operation of proportional valves and enhance the performance, this effort is proposed. The objective of this work is to improve the performance of the proportional hydraulic directional control valve.
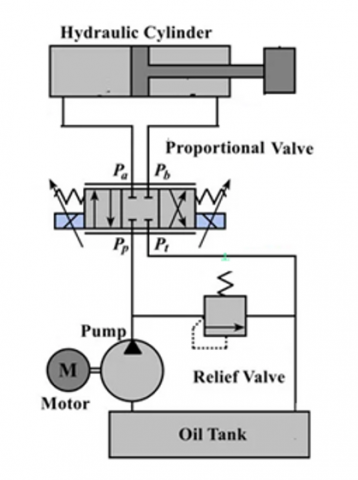
The proportional solenoid transforms the current into a mechanical force that the armature plunger uses to push against the spring by acting on a spool. When the magnetic and spring forces are equal, a spool position that follows the spring characteristic curve is produced. Proportional valve spools are working as a fluid meter-in and meter-out at the same time. This phenomenon affects performance. Especially when using a 1:1 valve ratio.
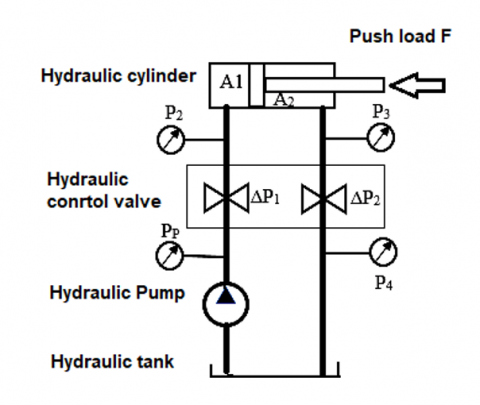
Figure 1 shows the fundamentals of a proportional directional valve circuit with a hydraulic cylinder (actuator).
Figure 1. Simple basic hydraulic circuit of directional proportional control valve with cylinder
In the case of the load always pulling the rod of the hydraulic cylinder, the hydraulic pump pressure affects the movement of the cylinder rod in the advanced position. In the retract case, if the load affects the opposite direction, i.e. The return of the cylinder rod, of course, here, if the pump pressure and, the return effect. This condition is called an overrunning load. Now, as a case study, when using a system 2:1 area ratio cylinder which is connected with a proportional directional control valve has a spool type 1:1 area ratio. The spool type 1:1 area ratio is reported as being constructed to provide 1/2 of the area on one side as opposed to the other. Let's look at this issue to see why a valve with a spool with a 1:1 area ratio should be utilized with a 2:1 area ratio cylinder.
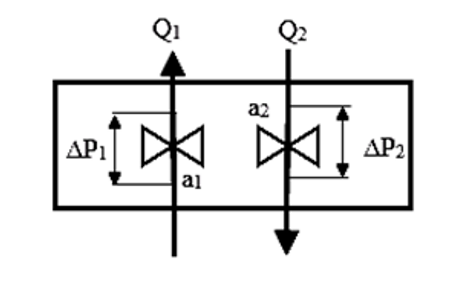
The meter-out and meter-in efface will appear on the operating of proportional valve spools at the same time. The equation for flow through an aperture is applicable because of this orifice function [13]:
$Q_v=C_v a_v \sqrt{\Delta P}$ (1)
where, Qv is the flow rate passed across the valve orifice, L/min, Cv is coefficient of discharge, av is orifice area, mm2, and ΔP is pressure drop between the sides of the valve orifice, bar.
The pressure drop across orifices ΔP1 and ΔP2 shown in Figure 2 may initially appear to need complex calculations. However, these computations become relatively simple when the system's load conditions are taken into account.
Figure 2. The valve orifice representation
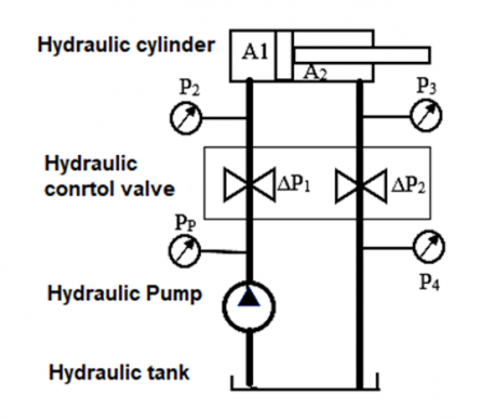
The orifice equation is the first requirement that can be met. This will be done for a 1:1 area ratio spool to demonstrate the detrimental effects they have when used with 2:1 area ratio cylinders. Figure 3 shows a 2:1 area ratio cylinder that is managed by a 1:1 area ratio spool.
Figure 3. A 2:1 area ratio cylinder that is managed by a 1:1 area ratio spool
However, valves with a 1:1 area ratio are used to regulate cylinders with a 2:1 area ratio.
$a_1=Q_1 / \sqrt{\Delta P_1}$ and $a_2=Q_2 / \sqrt{\Delta} P_2$ (2)
$Q_1 / 2 Q_2=\sqrt{\Delta P_2} / \sqrt{\Delta P_1}$ (3)
$4 \sqrt{\Delta} P_2=\sqrt{\Delta} P_1$ (4)
When a cylinder with a 2:1 area ratio and a spool with a 1:1 area ratio is used, P1 is four times more than P2; this might result in serious issues if the required backpressure on the cylinder rod end must be higher than 1/4 system pressure. Because the cylinder's cap end won't fill with oil, a vacuum can be produced.
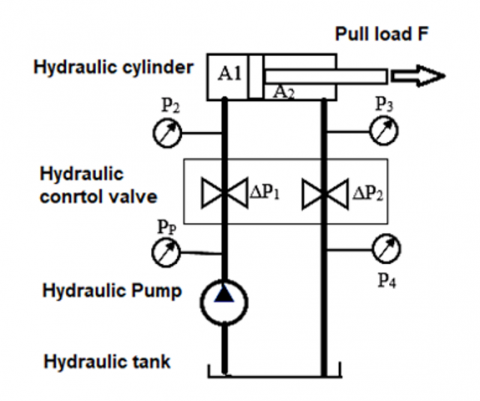
Let's examine a scenario with an overrunning load (pull load), a 2:1 area ratio cylinder, and a 1:1 area ratio spool. Figure 4 shows that, to examine this circumstance in greater depth. This has a direct bearing on how the pressure drop over the valve is calculated.
Figure 4. An elementary circuit for determining pressure decreases with pull load
By summing forces, we solve for P3:
$P_3=\left(P_2 A_1+F\right) / A_2$ (5)
Manipulate and solve for P2:
$\begin{gathered}P_2=\left[P_P\left(Q_2 / Q_1\right)^2-\left(F / A_2\right)\right] /\left[\left(A_1 / A_2\right)+\right. \left.\left(Q_2 / Q_1\right)^2\right]\end{gathered}$ (6)
By applying the parameters shown in Table 1, P2 = -6.45 bar.
Table 1. Parameters of systems
|
Parameters |
Value |
|
F (Active load) |
416 kgf |
|
Pp(Pump pressure) |
100 bar |
|
A1 (Piston side area) |
20.32 cm2 |
|
A2 (Rod side area) |
10.7 cm2 |
|
Q (Pump flow rate) |
20 L/min |
When pressure P2 becomes less than zero (-6.45 bar), that means a vacuum occurs. A smaller orifice is required to generate sufficient backpressure on the cylinder's rod end to prevent the load from exceeding its capacity and creating a vacuum.
Let's now investigate how 1:1 area ratio valves impact a resistive load (push load). Figure 5 shows that, to examine this circumstance in greater depth.
Equaling forces, and solving for pressure P2:
$P_2=\left(P_3 A_2+F\right) / A_1$ (7)
Manipulate and solve for P3:
$P_3=\left[P_P-\left(F / A_1\right)\right] /\left[\left(A_1 / A_2\right)+\left(Q_1 / Q_2\right)^2\right]$ (8)
The proportional directional control valve continues to function both as a meter-in and meter-out simultaneously. High pressures increase across the valve during this action. The best performance of a proportional valve will be when one of them (meter-in or meter-out) is used depending on the load condition.
Figure 5. An elementary circuit for determining pressure decreases with a resistive system
The beginning of any design for any hydraulic system must be studied and analyzed to determine its performance. Many special programs help in design and simulation before implementation. Therefore, the Automation Studio program was adopted to study this work.
The work included selecting the hydraulic actuator (hydraulic cylinder) as well as the appropriate valves and hydraulic pump. The inputs and specifications for each part are listed in Table 1. The selection of specifications must also be based on the available equipment in the laboratory, to ensure compatibility in the practical study with the analytical one. And also how to place the appropriate load.
The design and simulation program allows concluding terms of outputs, which give the extent of the system’s performance and its operation in a manner identical to the real work. The performance was studied, compared, and improved. They are listed in detail as results.
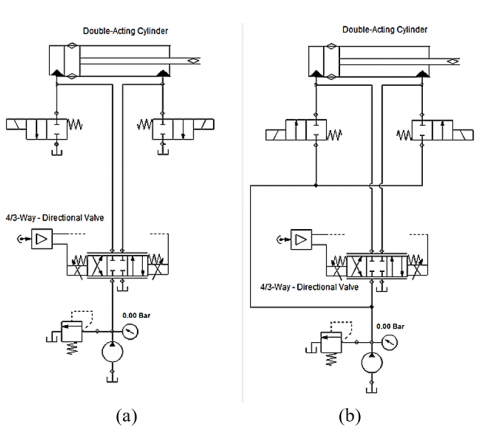
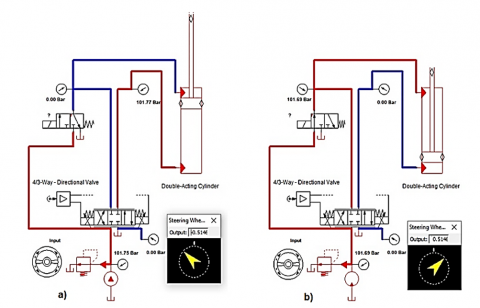
Depending on the application, either metering-in or metering-out is better. A proposed new arrangement would change a valve's proportional directional control performance so that it operates either meter-in or meter-out. The addition of two ways, two positions (2/2) solenoid-operated directional control valves constitutes the alteration. Figure 6 depicts the meter-in (Figure 6a) and meter-out (Figure 6b) configurations.
Figure 6. Schematic of the proposed arrangement, (a) as a meter-in, (b) as a meter-out
When utilized as a meter-in, the (2/2) solenoid-operated directional control valve lets the flow travel directly to the tank, while the proportional directional control valve regulates the pressure line that goes to the actuator. When utilized as a meter-in, the proportionate directional control valve allows the flow to travel straight to the actuator, while the 2/2 solenoid-operated directional valve controls the pressure line that is going to the tank.
To verify the proposed design before implementation, a design simulation process must be conducted according to the proposed distribution and according to a specific circumstance. One of the approved programs was used in the simulation. The proposed designs were drawn, and the specifications were also determined according to the available and approved (the same data mentioned above were approved) as shown in Figures 7 and 8. Figure 7 shows the pull load and Figure 8 shows the push load behavior.
After preparing the design, simulations are conducted and data resulting from the work are obtained and then analyzed. The analysis is studied; it is possible to infer the appropriate design. Several proposed designs were examined, studied, and analyzed. Here only eight simulated experiments will be presented, which are the most appropriate in terms of conclusions. The following Figures 9 and 10 show these experiments. Figure 9 shows the configuration in the simulation when using push load as meter-in (advanced). Figure 10 shows the configuration in the simulation when using pull load as meter-in (retract). Figure 11 shows the configuration in the simulation when using pull load as meter-out (advanced). Figure 12 shows the configuration in the simulation when using push load as meter-out (retract).
As a use one (3/2) solenoid-operated directional control valve. When the system carries the same load and the same mounted hydraulic cylinder. Figure 13 shows these experiments. This arrangement of configuration can be used in both setups, push load in advanced, meter-in as shown in Figure 13(a), or Pull load in retract, meter-out as shown in Figure 13(b).
The results of all simulation experiments will be clarified and discussed later, and a useful conclusion will be drawn.
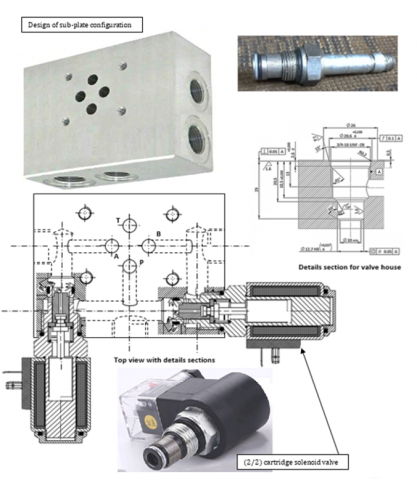
After the simulated tests were carried out, a mechanical design was adopted for an arrangement to be added to the valve as an interface base (sub-plate). This proposed configuration is installed with the proportional valve and also will be used for practical experiments later. Figure 14 shows the design of the sub-plate configuration proposal that can be used as a meter-in or meter-out, just make an upside down.
Figure 7. The pull load configuration in the simulation
Figure 8. The push load configuration in the simulation
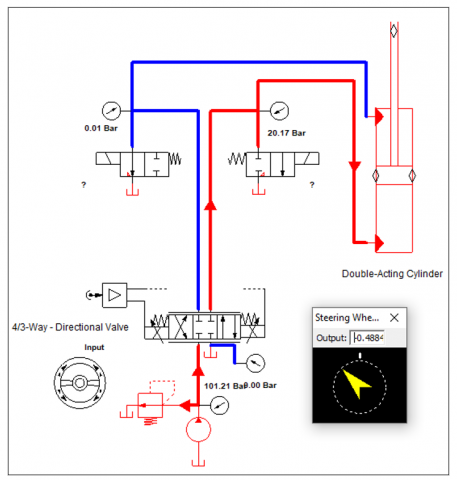
Figure 9. The push load configuration in the simulation when used as meter-in (advanced)
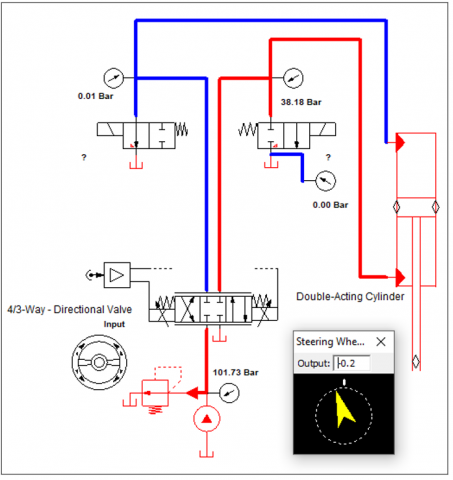
Figure 10. The pull load configuration in the simulation when used as meter-in (retract)
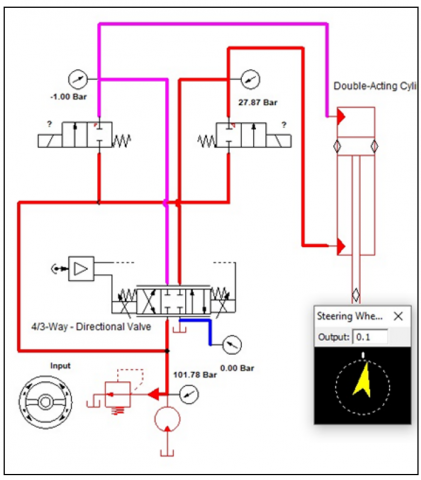
Figure 11. The pull load configuration in the simulation when used as meter-out (advanced)
When need to change the metering, the port (T) of the proposed sub-plate is in place of the port (P) of the proportional valve and vice versa. As seen in the details, it can see the ports and the orientation of two ways on the sub-plate, two positions (2/2) cartridge solenoid valve should be normally closed type. When utilized as a meter-in, the (2/2) cartridge solenoid valve normally closed directional control valve lets the flow travel directly to the tank, while the proportional directional control valve regulates the pressure line that goes to the actuator. When utilized as a meter-in, the proportionate directional control valve allows the flow to travel straight to the actuator, while the (2/2) cartridge solenoid valve normally closed directional valve controls the pressure line that is going to the tank.
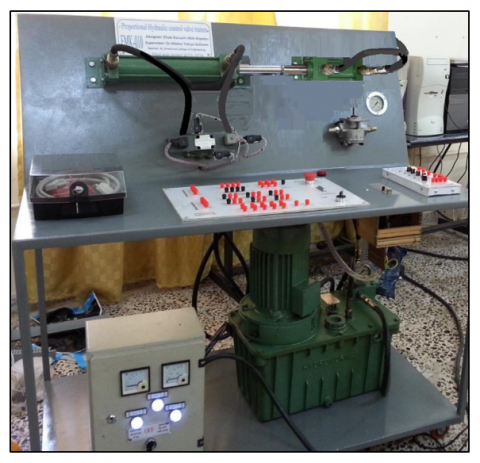
The practical experiments and platform (test rig which is available in the laboratory) have been proposed to evaluate the functioning of the proposed system. It uses the specifications of the components that match the specifications that were simulated. Measuring instruments were also equipped. To generate the projected load, an opposite hydraulic cylinder was placed that generates pulling or pushing loads. The electronic components are also connected through the control board and the proportional valve with the electronic card. Figure 15 shows the test rig with complete components.
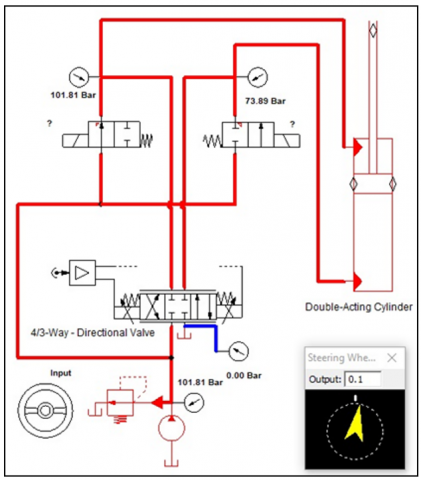
Figure 12. The push load configuration in the simulation when used as meter-out (retract)
Figure 13. Use one (3/2) solenoid-operated directional control valve, (a) push load in advanced, as meter-in, (b) pull load in retract, as meter-out
Figure 14. The design of the sub-plate configuration proposal
Figure 15. The test rig with complete components
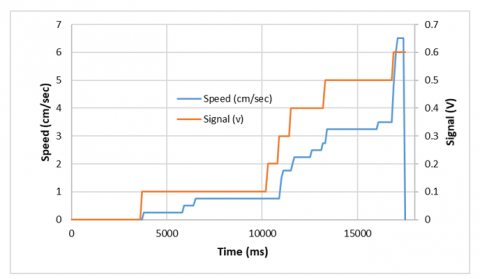
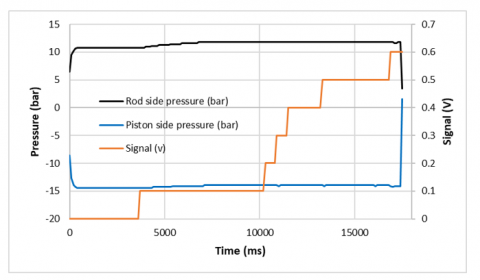
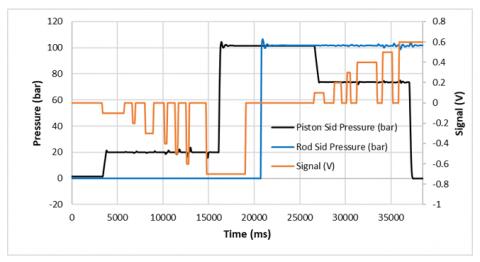
The simulation tests were conducted as a consequence of utilizing simulation software. By using the same parameter that applies in the analysis before. Refer to the configuration shown in Figure 7. The test was completed for an overrunning load of Figures 16 and 17. In Figure 16, we can see the varied signal effect on cylinder speed with time. They have the same train, the speed increases with increasing signal in (+ sign).
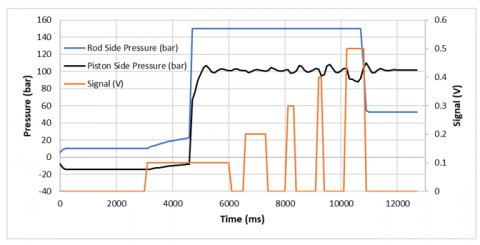
Figure 17 notes that the pressure on the side of the piston is always negative, meaning that the vacuum occurs, despite the presence of the opposite positive pressure on the side of the rod. This is unreasonable because the negative pressure will generate a force opposite to the load and may also cause a rise in the pressure difference in the valve. Which causes the system to collapse, or at least the pump.
Figure 16. The pull load results in the simulation (variable signal and speed)
Figure 17. The pull load results in the simulation (variable signal and pressures)
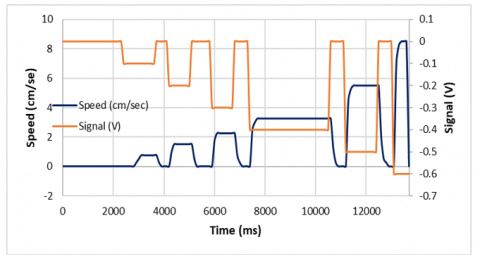
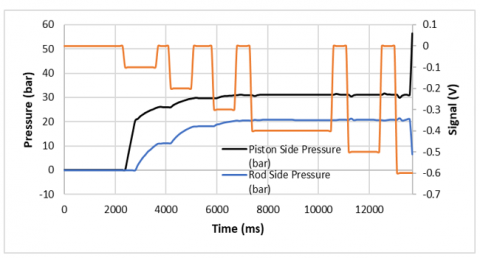
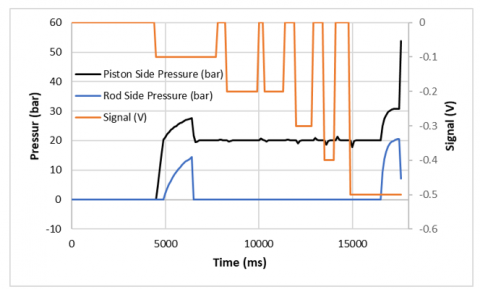
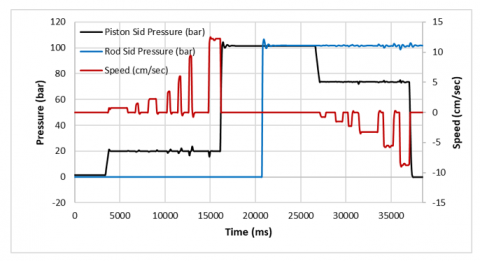
Refer to the configuration shown in Figure 8. The test was completed for resistive load in Figures 18 and 19. In Figure 18 see the varied signal effect on cylinder speed with time. They have the same train, the speed increases with increasing signal in (- sign). In Figure 18, it can be noticed that the two pressures on both sides, the piston, and the rod, have the same train and not a negative pressure.
The difference between the two pressure values is due to the area difference. This means that in this case there is always a rise in pressure in the two chambers of the hydraulic cylinder. This always causes high pressure and energy loss.
Figure 18. The push load results in the simulation (variable signal and speed)
Figure 19. The push load results in the simulation (variable signal and pressures)
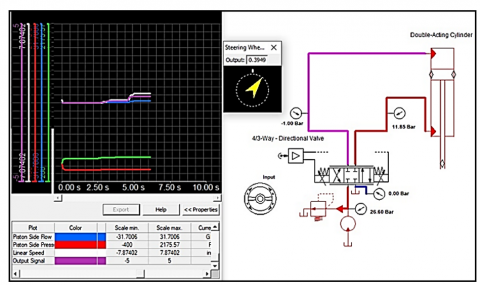
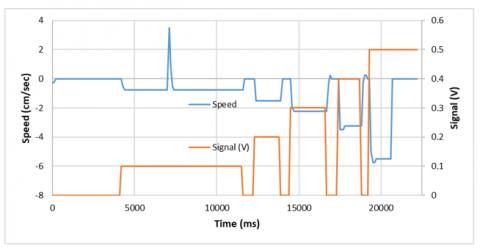
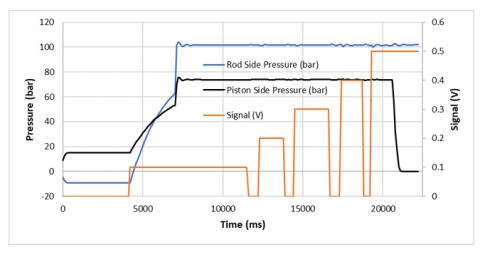
The more simulations one for an overrunning load and the other for a resistive load take place after modification. Refer to the configuration in Figure 9, the results of the simulation when using push load as meter-in (advanced). In Figure 20 see the varied signal effect on cylinder speed with time. They have the same train, the speed increases with increasing signal in (- sign). In Figure 21, it can be noticed that the two pressures on both sides, the piston, and the rod, have the same train and not negative pressure. Here, the rod side pressure is zero, while the piston side pressure is almost stable at the same value. Just at the start and end of the stroke overshooting appears, in a short time.
Figure 20. The push load as meter-in (advanced) results in the simulation (variable signal and speed)
Figure 21. The push load as meter-in (advanced) results in the simulation (variable signal and pressures)
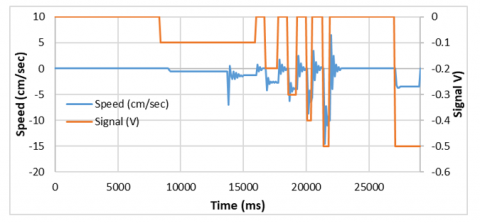
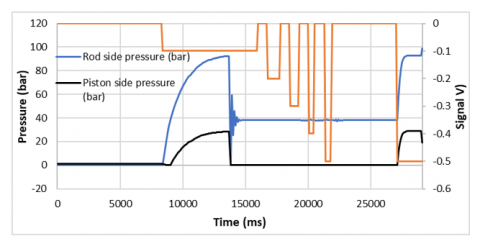
Refer to the configuration in Figure 10, the results of the simulation when using pull load as meter-in (retract). In Figure 22 see the varied signal effect on cylinder speed with time. They have the same train, the speed increases with increasing signal in (- sign). In Figure 23, it can be noticed that the two pressures on both sides, the piston, and the rod, have the same train and not negative pressure. Here, the piston side pressure is zero, while the rod side pressure is almost stable at the same value. Just at the start and end of the stroke overshooting appears, in a short time. As well as the change of signal for change the speeds.
Figure 22. The pull load as meter-in (retract) results in the simulation (variable signal and speed)
Figure 23. The pull load as meter-in (retract) results in the simulation (variable signal and pressures)
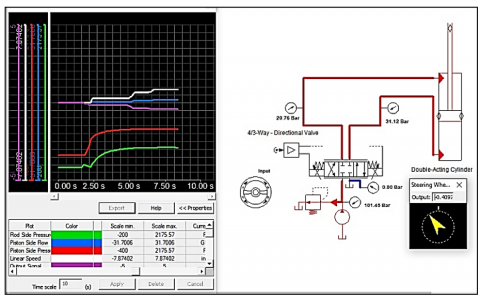
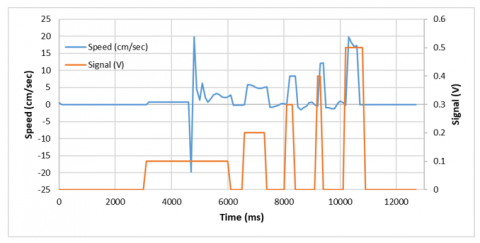
Refer to the configuration in Figure 11, the results of the simulation when using pull load as meter-out (advanced). In Figure 24 see the varied signal effect on cylinder speed with time. They have the same train, the speed increases with increasing signal in (+ sign).
Figure 24. The pull load as meter-out (advanced) results in the simulation (variable signal and speed)
In Figure 25, it can be noticed that the two pressures on both sides, the piston, and the rod, have the same train and not negative pressure.
Here, the rod side pressure is almost stable and higher than the piston side, while the piston side pressure is unstable at the same value. Just at the start and end of the stroke overshooting appears, in a short time. The valve could now prevent the system from pulling a vacuum and the load from exceeding its capacity.
Refer to the configuration in Figure 12, the results of the simulation when using push load as meter-out (retract). In Figure 26 see the varied signal effect on cylinder speed with time. They have the same train, and the speed increases with increasing signal in (+ sign). In Figure 27, it can be noticed that the two pressures on both sides, the piston, and the rod, have the same train and not negative pressure. Here, the rod side pressure is almost stable and higher than the piston side, and the piston side pressure is almost stable at the same value. Just at the start and end of the stroke overshooting appears, in a short time. The valve could now prevent the system from pulling a vacuum and the load from exceeding its capacity.
Figure 25. The pull load as meter-out (advanced) results in the simulation (variable signal and pressures)
Figure 26. The push load as meter-out (retract) results in the simulation (variable signal and speed)
Figure 27. The push load as meter-out (retract) results in the simulation (variable signal and pressures)
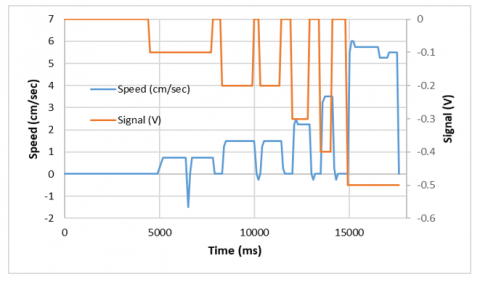
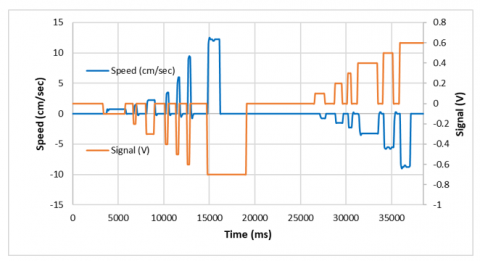
Refer to the configuration in Figure 13, when using one (3/2) solenoid-operated directional control valve. When the system carries the same load and the same mounted hydraulic cylinder. In Figure 28 see the varied signal effect on cylinder speed with time. They have the same train, the speed increases with increasing signal in both (- and + signs). The behavior of pressures in all conditions is almost the same as before the simulation test as shown in Figure 29. Figure 30 shows the relationship between Speed and Pressure. As the final result test, it can be seen the configuration in Figure 13 is better than others because it uses just one (3/2) directional valve. As well as can be used in both applications meter-in and meter-out in the same system.
Figure 28. The push and pull loads as meter-in and meter-out (advanced and retract) respectively, result in the simulation (variable signal and speed)
Figure 29. The push and pull loads as meter-in and meter-out (advanced and retract) respectively, result in the simulation (variable signal and pressures)
Figure 30. The push and pull loads as meter-in and meter-out (advanced and retract) respectively, result in the simulation (variable speed and pressures)
Because practice tests with a test rig and simulation software were used, a comparison of the simulation tests was carried out. Two of them were finished before the modifications were made: one for a resistive load and the other for an overrunning load. Following modifications, two further simulations are run, as well as.
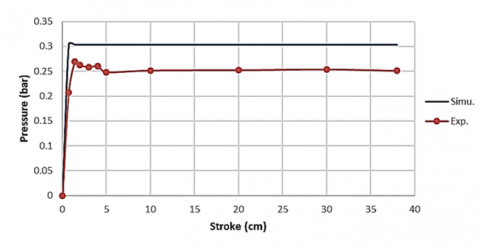
When the same Parameters shown in Table 1 are applied. Figures 31 and 32 depict the relationship between actuator pressure and stroke for overrunning loads. Figure 31 depicts a pressure of around 12.5 bar at the piston side, with an occasional vacuum. This pressure comes from the valve. 87.5 bar of pressure will be lost. Figure 32 shows a pressure of 25 bar at the rod side, which equals a total pressure drop of 112.5 bar through the valve.
Figure 31. Pressure with stroke before modification in case of overrunning load at the piston said
Figure 32. Pressure with stroke before modification in case of overrunning load at the rod said
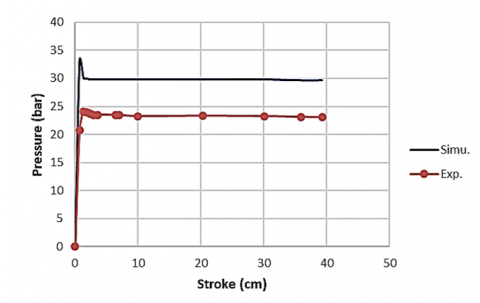
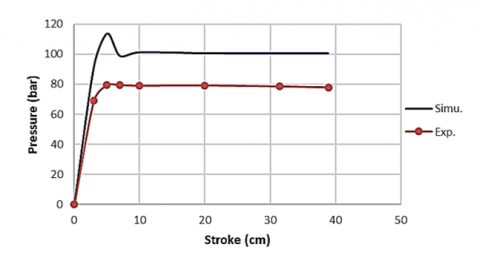
The relationship between pressure and actuator stroke for a resistive load is depicted in Figures 33 and 34. Figure 33 depicts the pressure of roughly 28 bar at the piston side. After the valve, this pressure exists. 72 bars of pressure will be lost. According to Figure 34, the pressure at the rod side is 20 bar, which means there will be a 92 bar total pressure drop across the valve.
Figure 33. Pressure with stroke before modification in case of resistive load at the piston said
Figure 34. Pressure with stroke before modification in case of resistive load at the rod said
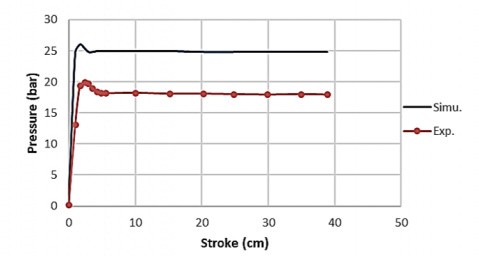
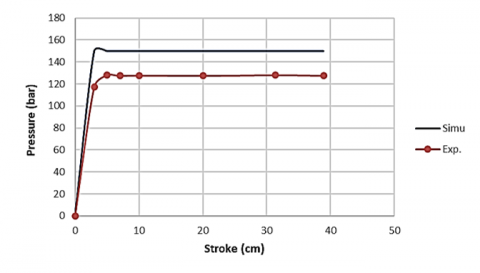
Figures 35 and 36 depict the relationship between pressure and actuator stroke while meter-out an application (overrunning load). Figure 35 depicts the pressure of roughly 98 bar at the piston side. After the valve, this pressure exists. This is the entire pressure drop over the valve, and it will be 2 bars.
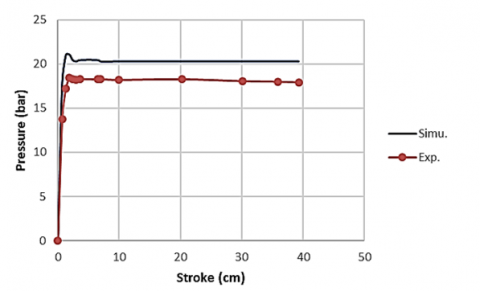
High pressure means there is never a vacuum. According to Figure 36, the rod side pressure is 140 bar, which suggests the load will be retained without overrunning and without the requirement for a reduced aperture. Figures 37 and 38 depict the application's relationship between pressure and actuator stroke under the meter-in (Resistive load). Figure 37 displays the pressure of roughly 22 bar on the piston side, indicating a 20 bar total pressure drop across the valve. Figure 38 depicts a 0.3 bar pressure at the rod side. In all practical tests, it is found the same train but has some differences in the values, because of the mechanical error system. It can be proven the modification and the proposed configuration is working right.
Figure 35. Pressure with stroke after modification in case of meter-out at the piston said
Figure 36. Pressure with stroke after modification in case of meter-out at the rod said
Figure 37. Pressure with stroke after modification in case of meter-in at the piston said
Figure 38. Pressure with stroke after modification in case of meter-in at the rod said
Through the results obtained in this work, the performance improvement can be observed, and this is what was obtained in the results as a comparison between the work of the system before and after improvement. The improvement was clear in pressure and response speed, and this will also help reduce and improve energy consumption. Energy consumption depends on improving work performance by reducing pressure, which is reflected in the input and output power, which fundamentally improves work efficiency. This was observed in simulation and also in practical comparison.
Finally, any effort has a result and from this result, it is possible to reach conclusions that may be useful. This work had several experimental attempts for several configurations using simulation programs. And from which the appropriate ones were chosen. The new arrangement is to improve the functioning of proportional valves, especially on the 1:1 type. Depending on the type of application. This is what has been observed in this work. The work is done by simulation and experimental. The performance is improved and will result in improved performance of the proportional directional control valve. The results of this work will encourage the completion of many applications and also the improvement of the designs of hydraulic systems that operate using proportional valves. In conclusion, it can be the decision the configuration in Figure 13 is better than others because it uses just one (3/2) directional valve. As well as can be used in both applications meter-in and meter-out in the same system. This configuration gives more flexibility to the applications. Through the results obtained from this work. It can be concluded that the performance has improved and the problems that appear during the operation of the proportional hydraulic system have been solved, after adding a cheap valve in exchange for gaining improved efficiency and reducing the input power. This means that the goal of this work has been achieved. This work provides a good suggestion for any hydraulic system that operates with proportional valves, by improving its operation and performance, reducing energy consumption, and also improving work efficiency. As a recommendation to any engineer who wishes to rethink the design of any hydraulic system that operates with a proportional hydraulic valve, whether it exists or will be equipped in the future. This work may lead to a rethinking of a new valve design. This is done by including the valve added to the main proportional valve.
Thanks to at Mechatronics Engineering Department, Al-Khwarizmiy College of Engineering, University of Baghdad for supporting this project. Where allowed to use the Hydraulic and Pneumatic lab.
|
A1 |
Piston Area of Hydraulic Cylinder, mm2 |
|
A2 |
Rod side area of Hydraulic Cylinder, mm2 |
|
av |
Orifice area, mm2 |
|
Cv |
Coefficient of discharge |
|
F |
Load on the Hydraulic Cylinder, Kg |
|
P1, P2, P3 |
Pressure pump, inlet Pressure, outlet Pressure, bar |
|
Q1, Q2 |
The inlet flow rate of the Cylinder, the outlet flow rate of the Cylinder, L/min |
|
Qv |
The flow rate passed across the valve orifice, L/min |
|
ΔP |
Pressure drop insides of the valve orifice, bar |
[1] Xiong, X., Huang, J. (2018). Performance of a flow control valve with pilot switching valve. Proceedings of the Institution of Mechanical Engineers, Part I: Journal of Systems and Control Engineering, 232(2): 178-194. https://doi.org/10.1177/0959651817743889
[2] Majdič, F., Pezdirnik, J., Kalin, M. (2011). Experimental validation of the lifetime performance of a proportional 4/3 hydraulic valve operating in water. Tribology International, 44(12): 2013-2021. https://doi.org/10.1016/j.triboint.2011.08.020
[3] Zhang, J., Lu, Z., Xu, B., Su, Q. (2019). Investigation on the dynamic characteristics and control accuracy of a novel proportional directional valve with independently controlled pilot stage. ISA Transactions, 93: 218-230. https://doi.org/10.1016/j.isatra.2019.03.023
[4] Liu, J., Li, R., Ding, X., Liu, Q. (2022). Flow force research and structure improvement of cartridge valve core based on CFD method. Heliyon, 8(11): e11700. https://doi.org/10.1016/j.heliyon.2022.e11700
[5] Qian, J.Y., Hou, C.W., Mu, J., Gao, Z.X., Jin, Z.J. (2020). Valve core shapes analysis on flux through control valves in nuclear power plants. Nuclear Engineering and Technology, 52(10): 2173-2182. https://doi.org/10.1016/j.net.2020.03.008
[6] Zhang, H., Liao, Y., Tao, Z., Lian, Z., Zhao, R. (2022). Modeling and dynamic characteristics of a novel high-pressure and large-flow water hydraulic proportional valve. Machines, 10(1): 37. https://doi.org/10.3390/machines10010037
[7] Li, S., Du, J., Shi, Z., Xu, K., Shi, W. (2022). Characteristics analysis of the pilot-operated proportional directional valve by experimental and numerical investigation. Energies, 15(24): 9418. https://doi.org/10.3390/en15249418
[8] Gao, Q., Zhu, Y., Wu, C., Jiang, Y. (2021). Development of a novel two-stage proportional valve with a pilot digital flow distribution. Frontiers of Mechanical Engineering, 16: 420-434. https://doi.org/10.1007/s11465-020-0622-2
[9] Wang, H., Wang, X., Huang, J., Quan, L. (2021). Performance improvement of a two-stage proportional valve with internal hydraulic position feedback. Journal of Dynamic Systems, Measurement, and Control, 143(7): 071005. https://doi.org/10.1115/1.4049793
[10] Wang, S., Weng, Z., Jin, B. (2020). A performance improvement strategy for solenoid electromagnetic actuator in servo proportional valve. Applied Sciences, 10(12): 4352. https://doi.org/10.3390/app10124352
[11] Lisowski, E., Filo, G., Pluskowski, P., Rajda, J. (2023). Flow analysis of a novel, three-way cartridge flow control valve. Applied Sciences, 13(6): 3719. https://doi.org/10.3390/app13063719
[12] Makarow, A., Braun, J., Rösmann, C., Schoppel, G., Glowatzky, I., Bertram, T. (2018). Cascaded evolutionary multi-objective system optimization for a proportional directional control valve. In 2018 IEEE/ASME International Conference on Advanced Intelligent Mechatronics (AIM), Auckland, New Zealand, pp. 1408-1413. https://doi.org/10.1109/AIM.2018.8452356
[13] Tonyan, M.J. (1980). Electronically Controlled Proportional Valves Selection and Application. Marcel Dekker, Inc.