Marwa M. Talib*![]() | Muayad S. Croock
| Muayad S. Croock![]()
© 2024 The authors. This article is published by IIETA and is licensed under the CC BY 4.0 license (http://creativecommons.org/licenses/by/4.0/).
OPEN ACCESS
Power management in several sectors poses the problem of conserving the consumed power while satisfying the imposed conditions It is considered as a proactive control and management of the organization's energy consumption to save use and reduce energy expenses. Therefore, there is an actual need to include smart energy management systems in buildings in order to reduce the consumed energy. In this work, a comparative analysis is presented to evaluate deep and machine-learning approaches in the context of intelligent models for conserving power in smart buildings. The deep learning model is structured by using Deep Neural Networks (DNN), while machine learning models are represented by Random Forest (RF), Support Vector Machine (SVM), K-Nearest Neighbor (K-NN), and Naive Bayes (NB). These models adopt three classes: full (power in full consumption), select (power in partial consumption), and shout down (no power consumption). Moreover, feature reduction methods of Boruta and Principal Component Analysis (PCA) are implemented to reduce the complexity of the models. The proposed models are trained and tested using a measured dataset for a building. Comparison results of the proposed models showed that the Random Forest attracts more attention regarding classification accuracy by 100% and a reasonable classification time of 1.23 seconds. The effectiveness of the comparative analysis which indicating the highest accuracy results for RF makes it as a suitable model to be implemented as an optimal one in real-time power management systems.
energy management, smart building, DNN, ML, feature reduction
In today's world, energy efficiency is a major problem for achieving environmental sustainability. The establishment of energy-efficient services and infrastructure is crucial to smart city viability. The building and construction sector accounts for more than 40% of worldwide energy consumption and one-third of yearly greenhouse gas emissions, making it a significant and growing contribution to global warming [1]. Building Energy Management System (BEMS) is an advanced means of monitoring and controlling the energy needs of a building. Aside from managing energy, the system may regulate and monitor a wide range of other components of the building, whether it is private, commercial, or industrial [2]. Thus, intelligent control and monitoring technologies, when used at scale, provide attractive energy savings and a return on investment for buildings that are newly constructed as well as when retrofitted.
Various strategies are currently being employed to manage energy use in buildings. The smart building concept includes the implementation of energy and technical technologies within buildings. The primary focus involves automation, resource management, comfort for users, and energy reduction using WSNs [3]. In WSN, sensors in smart buildings can gather information on the condition of various environmental variables and provide smarter action that can more efficiently use available resources while preserving intended behavior. One of the most important features of WSN is its ability to tolerate faults in demanding and dynamic conditions [4]. Several sensor nodes work together to gather and transmit data in a WSN. In case of node failures, disruption, or bad conditions, this redundancy enables the network to modify itself and self-heal. It is worth noting that the areas in which wireless sensor networks are used are very wide and diverse and are not limited to smart buildings, but can be observed in industry, agriculture, medicine, military, etc. [5-11].
It has been observed that the energy sector welcomes digital methods, which can be clearly seen through the coupling of energy-saving concepts and Artificial Intelligence (AI), which provides a vast array of prospects in the field of energy sector improvement. Intelligent consumption solutions powered by AI are also transforming how clients consume and conserve energy. The development of distributed electric grids enables energy to be managed using previously collected data [12]. AI manages and minimizes energy consumption during peak hours, finds and indicates problems, and discovers equipment faults before they occur. It has been able to organize and analyze enormous amounts of data, which can aid in monitoring and interpreting data generated by energy sectors in order to optimize the consumption of energy.
Powerful AI-based Machine Learning (ML) and Deep Learning (DL) algorithms can enable complex decisions concerning managing energy-efficient services. The purpose of such services is to enhance the energy system's reliability and dependability, improve the profit-loss operations of power generation elements, perform active data analysis to monitor building efficiency, share data among various power generation components to offer smart energy options, and provide accurate power and cabling information [13]. The number of ML publications on the subject of power systems has expanded dramatically in recent years, indicating its importance, widespread use, and great ability to assess energy-related challenges. In terms of DL, it is also obvious that the primary rise in the number of publications on this subject began in 2012, this can be linked to the continued advancement of DL and its extensive use in scientific concerns [14]. In line with what was mentioned above, we can define the aim of this study, which is to employ artificial intelligence techniques for managing energy consumption, based on the data obtained from the building, a model can be structured which is capable of controlling the building’s energy management mechanism in order to reduces power usage to the lowest possible rates.
In this paper, ML and DL techniques are applied in producing models that are aimed to improve power consumption in buildings. The proposed model is an eavaluation between ML and DL approaches which is conducted by applying a measured dataset of opened workspace floor area in a university building, five features are taken for the entire floor, which is occupancy, plug load, light, temperature and humidity. To enhance energy management, which leads to save consumed power, three modes of operating are implemented as three classes which are Full, Select and Shutdown. Those modes of operation depend on the occupancy status and the temperature in the building as the main feature selection. The Full mode is implemented when the occupancy status is at its peak and the temperature less than 18℃ or more than 25℃ unlike Selected mode when the occupancy status is not at its peak and the temperature less than 18℃ or more than 25℃. Whereas Shutdown is implemented when there is no occupancy at all. Data preprocessing are performed by scaling data, this process is followed by feature reduction by applying two methods Boruta and Principle Component Analysis (PCA) which are separately applied to four ML-based techniques and one deep learning model that are Random Forest (RF), Support Vector Machine (SVM), K-Nearest Neighbor (K-NN) algorithm, Naive Bayes (NB) and DNN. These Methods have been evaluated in regards to accuracy and executing time in order to choose the best one that meets the criteria of the suggested model. Precision, recall, and F1-score are determined as well to acquire an in-depth glance for the performance of each class. Besides that, an evaluation is performed without feature reduction methods to determine whether these techniques are important for improving the performance of this system.
After applying the aformentioned system, comparison results of the proposed models showed that RF classifier without feature reduction methods achieved the highest accuracy of 100%. and a reasonable classification time of 1.23 seconds.
The rest of the paper is organized as follows: Section 2 indicates literature-researched ML and DL based energy optimization solutions. Section 3 discusses the proposed power management system. Section 4 investigates the collected results, while Section 5 summarizes the findings and highlights future studies.
A review of publications on energy management demonstrates that ML and DL approaches have been extensively investigated in the literature, especially in recent years. Building Energy Management (BEM) is one of the most important areas where ML and DL methods can be used to improve energy use in buildings. Control, planning, and scheduling are a few examples of problems that can be tackled in power systems [15]. Another primary goal of creating such systems is to properly plan the consumption of electricity of devices and other loads in order to reduce the amount of the consumer's electricity bill [16]. These solutions can address the challenges that present large electric power systems face as additional interconnections are made to meet increased load demand.
Regarding ML approaches, the energy efficiency of buildings was evaluated by studying and comparing several ML classifiers. According to Kaligambe et al. [17], unmeasured variables originating from a grid of sensors were computed using the ML model. The authors used six months of data from Japanese smart buildings, which revealed that the interior measures required for optimal heating and cooling system regulation could be precisely approximated by using this model. In their work they focused on reducing the number of used sensors to reduce its potential cost without focusing directly on the potential energy consumption of the building. In the same regard, the authors in the study [18] stated that it was vital to have a comprehensive definition of the problem to be solved, as well as previous analysis for the utilized dataset for both training and testing must be assessed in order to achieve better outcomes, although they have discussed many ML methods, DL can be quite effective, especially if the number of features used is relatively large. A gradient-boosting ML technique was used in the study [19] to predict temperature, and the experiment's findings revealed that the model consistently predicts temperature with a mean RMSE level of 0.05 and a predicted temperature of 2.38℃, which is 6℃ lower than an another discussed theoretical model. Similar to the previous study, Eseye and Lehtonen [20] developed an innovative hybrid machine learning technique for forecasting building heat demand. SVM, Empirical Mode Decomposition (EMD), and Imperialistic Competitive Algorithm (ICA) are among the forecasting models proposed. The authors investigated the prediction for building heat requirements without focusing on minimizing energy consumption in real time.
At the other hand, deep learning algorithms are becoming increasingly popular for managing building power usage, which is based on correct forecasting of building energy usage, which is an essential component of building energy efficiency and emission reduction. Wang [21] presented assessment indexes of the results of the building energy consumption prediction model. They used Mean Absolute Percentage Error (MAPE) and Root Mean Square Error (RMSE) indexes to assess the accuracy of the model's prediction results, and using the prediction time and input parameter dimensions to evaluate the prediction model's time cost. In addition, Nabavi et al. [22] introduced a deep learning algorithm and an organizing framework to enable integrated modeling and control of power supply and demand for buildings. This method analyzed numerous elements that aid in the monitoring and control on renewable energy generation, the implementation of a savings strategy based on a user preference list, and energy storage, particularly during peak hours. Enabling users to intelligently control Heating, Ventilation, Air-conditioning, and Cooling (HVAC) systems reduced the power consumption cost of those systems though confirming user satisfaction. As a result, a novel HVAC control system for building systems was proposed based on a multi-step predictive deep reinforcement learning (MSP-DRL) algorithm [23]. The system showed that it was effective and could save over 12% cost compared to other approaches, where the user control was used. Generally, in the studies dealing with DL, researchers focused on user preferences and not on the number of people in the building, which could be empty, full, or partially occupied. Enhancing the use of energy in buildings has been extensively researched in the literature, particularly in managing HAVC systems by incorporating DL techniques, as clearly revised in the studies [24-29].
The proposed methodology is an evaluation between ML and DL approaches regarding the most optimal solution for managing the power in buildings. This section is divided into subsections for declaring the idea behind this research in clearer.
3.1 General structure
As it is shown in Figure 1, various steps were conducted successively to implement the proposed DL and ML models as a work flow. The proper dataset for this research topic is chosen first. Preprocessing methods such as data labeling and feature scaling are used, followed by data splitting and the application of two feature reduction methods, each of which is used separately with DL and ML classifiers to provide classification results. Then, criteria measurements in regards to accuracy and execution time are determined, and finally, a comparison is made to evaluate the suggested method.
Figure 1. Workflow for the proposed system
3.2 Dataset collection
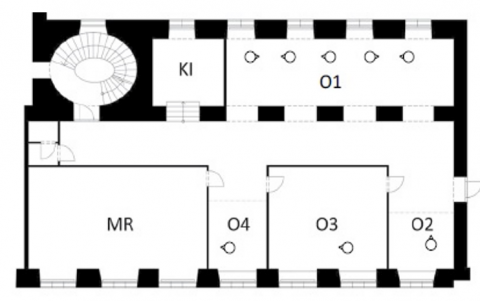
The dataset is adopted from a study that observed in an open area with one locked workplace in a college facility [30]. This dataset was collected over one year (from January 1, 2013 to December 31, 2013) in both indoor and outdoor environment conditions. The acquired data can be employed for a variety of purposes, including the development and validation of occupancy-related models. For this research, indoor factors such as occupant presence, plug load, humidity, and light conditions are taken into account when developing the model. As previously stated, the suggested system seeks to improve building energy management by running the building in three modes: shutdown, full, and selected. Those categories are determined by the occupancy status as well as temperature, as a result, a new feature called Mode was added to the dataset to categorize it according to the three mentioned modes. Figure 2 shows the office floor for the aforementioned dataset, where K1 stands for kitchen, O1, O2, O3 and O4 indicates for room1, 2, 3 and 4 respectively and MR refers to meeting room. Area O1 is separated into five areas so that the occupancy status and plug load for the five areas as well as the other rooms in the office space can be measured.
Figure 2. Floor office area [30]
3.3 Dataset preprocessing
The data preparation phase is the next step in the design of this classification model. Raw data is often incoherently arranged, includes human errors, which makes it infrequently incomplete. Data preparation eliminates these flaws and makes datasets more accurate and acceptable for data analysis, yielding more reliable results. Preprocessing steps are described below:
(1) As shown in Figure 2, there are several rooms on the floor, and each room has several variables. In the beginning, readings are taken from all the rooms and collected together, and thus five features are taken for the entire floor, that has occupancy, plug load, light, temperature and humidity.
(2) Secondly, labeling data by categorizing them into tags which help the model to identify the classes. As previously stated, there are three classes of Full, Select, and Shutdown, which are labeled as 0, 1, and 2 accordingly.
(3) After data labeling, features are scaled to even out the impact of all factors on calculating distance and can help enhance algorithm performance. Feature scaling is important because when ML algorithms estimate distances between data points, the scale of these features can surpass their values. This issue can be fixed by scaling the features into a certain range [31].
3.4 Feature reduction methods
A machine learning based feature reduction approach is used to increase accuracy. It also improves the algorithms to predict outcomes by focusing on the most significant factors and deleting the redundant and useless ones. Two approaches have been used in this study, which are Boruta and Principle Compact Analysis (PCA). Each approach is used with proposed power management intelligent models of DL and ML, individually to compare accuracy and execution time.
3.4.1 Boruta
Boruta is a machine learning feature selection technique used to discover the most significant features or variables for a prediction model. It works by making a shadow dataset which is the duplicating of the original dataset [32]. This shadow dataset has the same rows and columns, but the feature columns have been randomly permuted. This duplication is required for evaluating the significance of real features against those that are generated randomly. After this step, the importance score for each real feature is compared to the shadow ones. The intent is to see if the real feature is more significant than its shadow ones. Relevant features are those that are much more essential than their shadow equivalents. In this research the number of relevant features is five.
3.4.2 PCA
PCA is a technique for reducing dimensionality in machine learning and data analysis, this is accomplished by converting the original features into an additional set of orthogonal features known as principle components. Targeted variance ratio could be adjusted to retain the variance of data after dimensionality reduction. In this work, instead of specifying the number of principle components, variance ratio is adjusted into 0.95 to retain 95% of the variance.
3.5 Proposed machine learning models
As explained before, four machine learning approaches (RF, SVM, K-NN and NB) are used in this study to produce power management models in buildings, where their performance with the adopted dataset is assessed as shown in Figure 3. Training data is fed to each of the four methods then evaluate them to assess the performance of them.
Figure 3. Structure of ML methods
3.6 Proposed deep learning model
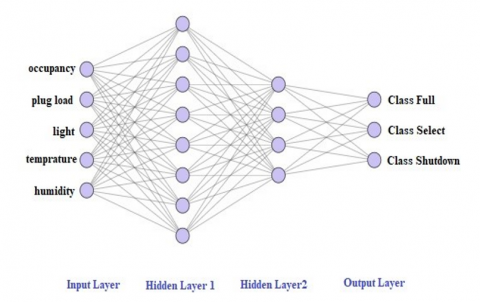
To classify power management modes in more efficient method, DL-DNN is implemented. The basic structure for DNN could be seen in Figure 4, where the input vector needs one neuron for each feature. The neural network's inputs include occupancy status, plug loads, temperature, humidity, and light. Thus, there are five input features for the implemented DNN.
Figure 4. Structure of DNN
The neural network's hidden layer consists of two layers, while the output layer consists of three neurons indicating the three modes of operations: Full, Select, and Shutdown. The hidden layer's activation function is a ReLU function. It stands for Rectified linear unit, which is the most commonly used activation function, primarily implemented in the neural network's hidden layers.
3.7 Model testing
Confusion matrix is a convenient and simple approach to assess how effectively the model has performed in terms of performance on particular classes. To evaluate the system, accuracy; which is a commonly used approach to measure the performance of an object identification system, was utilized to examine the effectiveness of the classification algorithm, in addition to accuracy, precision, recall, and F-score are determined as well [33]. Figure 5 depicts a simple confusion matrix graph. It offers a table of predicted labels and true labels that is filled out by four values following the testing process: true positives (TP), false positives (FP), false negatives (FN), and true negatives (TN), accuracy can be simply calculated using this table. Eqs. (1)-(4) show how accuracy, precision, recall, and F-score are calculated.
$Accuracy=\frac{T P+T N}{T P+T N+F P+F N}$ (1)
$Precision=\frac{T P}{T P+F P}$ (2)
$Recall =\frac{T P}{T P+F N}$ (3)
$F\text{-}score = \frac{2 * \textit{Precision} * \textit{Recall}}{\textit{Precision} * \textit{Recall}}$ (4)
Figure 5. Confusion matrix
In addition to the above specified criteria, execution time is taken into account to determine how long each approach takes when applied to each feature reduction individually.
In order to test and evaluate the performance of the proposed classification models of DL and ML approaches, different case studies are considered. This is to cover the possible faced problems and related solutions after training the proposed intelligent models using the adopted dataset. Accuracy and execution time are crucial characteristics to be considered while selecting the optimal model to be used in this study. Precision, recall and F1-score are also can give indications for in-depth class analysis. The major goal of this method is to attain maximum accuracy with reasonable classification time.
4.1 First case study
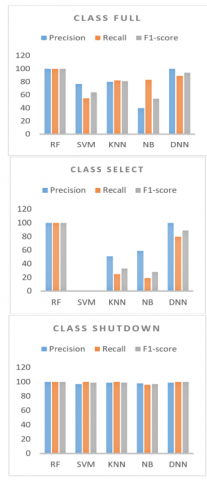
Table 1 displays the accuracy and consumed classification time comparison of the presented ML and DL models without feature reduction methods. It is clear that RF has the highest accuracy of 100% followed by DNN, KNN and SVM with 99.6%, 97.88% and 96.94% respectively. Moreover, NB classifier has a classification time of 0.27 second, which is very close to SVM with 0.28 seconds. Table 2 displays the proposed model's confusion matrix that depicts the estimated value of the three classes, with the diagonal values for each classifier representing the actual positive values that are successfully predicted. It can be seen that the RF produces better results than the others and this is clearly shown in Figure 6, which displays the classification metrics of precision, recall, and F1-score from the testing dataset scores for each class.
Figure 6. Classification metrics for each class in first case study
Table 1. The accuracy and time performance of first case study
|
ML/DL Methods |
Accuracy |
Time |
|
RF |
100% |
1.23 |
|
SVM |
96.94% |
0.28 |
|
KNN |
97.88% |
0.34 |
|
NB |
94.26% |
0.27 |
|
DNN |
99.6 |
1.62 |
Table 2. Confusion matrix for first case study
|
Classifier |
RF |
||
|
Mode |
Full |
Select |
Shutdown |
|
Full |
842 |
0 |
0 |
|
Select |
0 |
440 |
0 |
|
Shutdown |
0 |
0 |
26750 |
|
Classifier |
SVM |
||
|
Mode |
Full |
Select |
Shutdown |
|
Full |
465 |
0 |
377 |
|
Select |
100 |
0 |
340 |
|
Shutdown |
39 |
0 |
26711 |
|
Classifier |
K-NN |
||
|
Mode |
Full |
Select |
Shutdown |
|
Full |
687 |
62 |
93 |
|
Select |
108 |
109 |
223 |
|
Shutdown |
65 |
43 |
26642 |
|
Classifier |
Naive Bayes |
||
|
Mode |
Full |
Select |
Shutdown |
|
Full |
968 |
0 |
144 |
|
Select |
3 |
82 |
355 |
|
Shutdown |
1051 |
56 |
25643 |
|
Classifier |
DNN |
||
|
Mode |
Full |
Select |
Shutdown |
|
Full |
799 |
36 |
1 |
|
Select |
0 |
435 |
6 |
|
Shutdown |
36 |
33 |
26686 |
4.2 Econd case study
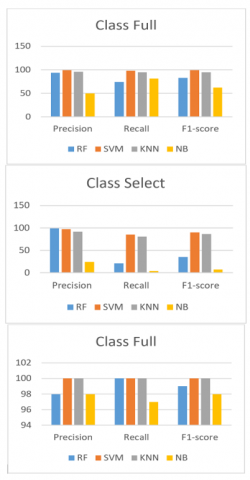
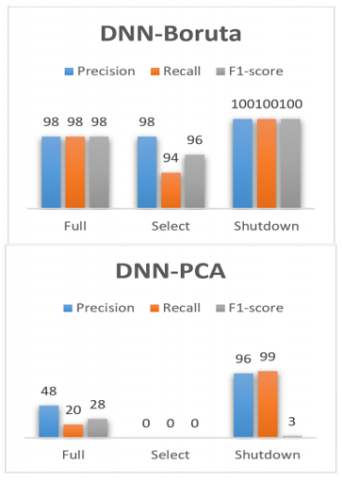
In this case study Boruta and PCA are applied to the ML and DL models. Table 3 displays the accuracy and classification consumed time comparison, where accuracy results are shown to be the same for ML methods when applying Boruta or PCA, although it is not the same for DNN. The accuracy results for applying Boruta-DNN is 99.8 while PCA-DNN recorded 95.53%. From the table it is clear that DNN has the highest accuracy of 99.8% followed by SVM and KNN with 99.64% and 99.4%, respectively. Considering the execution time on the testing dataset, KNN-PCA has an execution time of 0.23 second, which is lower than all other classifiers followed by SVM-PCA of 0.24s. Table 4 displays the proposed model's confusion matrix, while Figure 7 displays the classification result of the ML methods. Moreover, Figure 8 shows the classification results for DNN-Boruta and DNN-PCA, respectively. Both figures consider the precision, recall, and F1-score factors.
Table 3. Accuracy and time performance of second case study
|
ML/DL Methods |
Accuracy |
Time/Boruta |
Time/PCA |
|
RF |
97.92% |
1.55 |
1.92 |
|
SVM |
99.64 |
9.50 |
0.24 |
|
KNN |
99.40 |
0.89 |
0.23 |
|
NB |
95.42 |
0.30 |
1.44 |
|
DNN |
99.8% Boruta 95.53% PCA |
1.19 |
1.19 |
Figure 7. Classification result of the ML methods of second case study
Table 4. Confusion matrix of second case study
|
Classifier |
RF |
||
|
Mode |
Full |
Select |
Shutdown |
|
Full |
622 |
1 |
219 |
|
Select |
26 |
93 |
321 |
|
Shutdown |
15 |
0 |
26735 |
|
Classifier |
SVM |
||
|
Mode |
Full |
Select |
Shutdown |
|
Full |
823 |
3 |
16 |
|
Select |
2 |
373 |
65 |
|
Shutdown |
4 |
9 |
26737 |
|
Classifier |
K-NN |
||
|
Mode |
Full |
Select |
Shutdown |
|
Full |
798 |
10 |
34 |
|
Select |
12 |
357 |
71 |
|
Shutdown |
20 |
21 |
26709 |
|
Classifier |
Naive Bayes |
||
|
Mode |
Full |
Select |
Shutdown |
|
Full |
685 |
3 |
154 |
|
Select |
46 |
18 |
376 |
|
Shutdown |
651 |
53 |
26046 |
|
Classifier |
DNN/Boruta |
||
|
Mode |
Full |
Full |
Full |
|
Full |
820 |
820 |
820 |
|
Select |
14 |
14 |
14 |
|
Shutdown |
2 |
2 |
2 |
|
Classifier |
DNN/PCA |
||
|
Mode |
Full |
Full |
Full |
|
Full |
165 |
165 |
165 |
|
Select |
38 |
38 |
38 |
|
Shutdown |
140 |
140 |
140 |
Figure 8. Classification result of DNN-Boruta and DNN-PCA of second case study
4.3 Comparative analysis of case studies
The accuracy results, which are clarified in Figure 9, show that RF classifier without feature reduction methods achieved the highest accuracy of 100%. As for the time spent for implementation, from Figure 10, it is shown that K-NN and SVM combined with PCA achieved the lowest classification consumed time of 0.23 and 0.24 seconds, respectively, while and the accuracy is 99.40 for K-NN and 99.64 for SVM. Although the classification time is important in real-time application and as the results showed that SVM and K-NN combined with PCA achieved low time and high accuracy. However, after examining the classification results of the confusion matrix in Figure 8, it is found that in class Select, the recall metrics report 85% for SVM and 81% for K-NN. More precisely, and as it is shown in Table 4, there are a total of 440 instance in this class that are detected correctly in 373 for SVM. The same for KNN the correct detection instances are only 357.
Comparing those results with RF without feature reduction methods in Table 2 for the same class, it is clear that there is a difference in terms of accuracy of the results when all the 440 instances are predicted accurately as Select class. This gives a privilege to RF to be adopted as the best method in this system because of its accuracy in classification in all the implemented metrics.
Figure 9. Accuracy results
Figure 10. Classification time
It is worth mentioning that feature reduction methods have an impact on rising the accuracy of SVM, K-NN and NB classifires. On the other hand, implementation time increased significantly except for SVM amd K-NN which have a low excution time, but when examining Table 4 its clear that there were mis-classification in the classes which again makes RF classifire without feature reduction method has a priveledge to be implemented as the optimal method to be adopted in this system.
As for DL-DNN, the results showed that DNN-Boruta achieved high results in terms of accuracy. But as stated earlier there is a misclassification in the class Select, where some of them are predicted mistakenly. Moreover, the classification time for the two cases are 1.19 and 1.62 seconds which makes the balance swing again to choose the RF as the best method that can be adopted in this system. In general, DL methods can give better results if the features are more than the considered ones. In this research, the number of selected features is only five, therefore ML methods outperforms DL in terms of performance, effectiveness and the less of complexity.
Intelligent models for managing used power in a building were suggested by utilizing ML and DL classification models using RF, SVM, K-NN, NB, and DNN approaches. Furthermore, these classifiers were developed by integrating them with PCA and Boruta feature reduction approaches to reduce the number of features, while maintaining good accuracy performance. In the proposed models, three classes were implemented; Full, Select, and Shutdown. The models have been trained and tested using dataset collected from a building over a period of a year. The results demonstrated that the RF classifier performed better than other models in terms of classification accuracy to be 100%, with classification time of 1.23 seconds. In terms of classification time, K-NN and SVM combined with PCA achieved the lowest results of 0.23 and 0.24 seconds respectively and the accuracy for each one of them is 99.40 for K-NN and 99.64 for SVM. Although they achieved acceptable consumed time of classification, there was a degradation in classifying the class Select. This leaded to select the RF as a suitable model to be implemented as an optimal one in real-time.
In addition to what was mentioned above, it is necessary to point out some limitations. For example, the number of features used was only five. It is possible to increase their number to include, for example, temperature and humidity outside the building. It is also possible to increase the number of classes to include other cases so that the efficiency of this system can be increased. For future work, the selected model can be fed with real-time data and its performance can be evaluated in terms of predicting the appropriate class for energy conservation. The proposed system could have a valuable impact on reducing the consumed energy to the minimum especially in buildings that are not completely occupied at all times, such as universities and various institutions which makes it a qualitative addition to energy management systems in buildings.
[1] Ceballos-Fuentealba, I., Álvarez-Miranda, E., Torres-Fuchslocher, C., del Campo-Hitschfeld, M.L., Díaz-Guerrero, J. (2019). A simulation and optimisation methodology for choosing energy efficiency measures in non-residential buildings. Applied Energy, 256: 113953. https://doi.org/10.1016/j.apenergy.2019.113953
[2] Swathika, O.G., Karthikeyan, K., Padmanaban, S. (Eds.). (2022). Smart Buildings Digitalization, Two Volume Set. CRC Press.
[3] Sembroiz, D., Careglio, D., Ricciardi, S., Fiore, U. (2019). Planning and operational energy optimization solutions for smart buildings. Information Sciences, 476: 439-452. https://doi.org/10.1016/j.ins.2018.06.003
[4] Croock, M.S., Khuder, S.D., Hassan, Z.A. (2020). Self-checking method for fault tolerance solution in wireless sensor network. International Journal of Electrical and Computer Engineering, 10(4): 4416. https://doi.org/10.11591/ijece.v10i4.pp4416-4425
[5] Croock, M.S., Abdullah, M.N., Mousa, A.K. (2015). Optimal power consumption strategy for smart irrigation system using Lagrange multiplier. Sensor Letters, 13(12): 1044-1049. https://doi.org/10.1166/sl.2015.3587
[6] Abdulaziz, W.B., Croock, M.S. (2022). Optimized power and water allocation in smart irrigation systems. Periodicals of Engineering and Natural Sciences, 10(3): 60-69. http://doi.org/10.21533/pen.v10i3.2998
[7] Singh, C., Bhavani, G.L., Maginmani, U.H., Singh, R., Kumar, A.S., Rebelli, S. (2023). A WSN-based, intelligent medical IoT systems integrating computer vision platform. In 2023 3rd International Conference on Advance Computing and Innovative Technologies in Engineering (ICACITE), IEEE, pp. 1234-1239. https://doi.org/10.1109/ICACITE57410.2023.10182784
[8] Verma, Y., Rastogi, R. (2022). An investigation of the distributed health monitoring system using wireless sensor networks. In 2022 International Interdisciplinary Humanitarian Conference for Sustainability (IIHC), IEEE, pp. 493-497. https://doi.org/10.1109/IIHC55949.2022.10060535
[9] Mariappan, R., Manjunath, L., Ramachandran, G., Porkodi, M., Sheela, T. (2022). Super artificial intelligence medical care systems with IoT wireless sensor. In 2022 IEEE International Conference on Distributed Computing and Electrical Circuits and Electronics (ICDCECE), pp. 1-4. https://doi.org/10.1109/ICDCECE53908.2022.9792895
[10] Jain, R. (2023). Investigating the performance of bluetooth technology by sensor monitoring in industrial WSN. In 2023 World Conference on Communication & Computing (WCONF), IEEE, pp. 1-6. https://doi.org/10.1109/WCONF58270.2023.10235061
[11] Veerakumaran, V., Rajini, A. (2021). An energy-efficient adaptive mayfly optimization algorithm based optimal routing in wireless sensor network for military application. In 2021 International Conference on Advancements in Electrical, Electronics, Communication, Computing and Automation (ICAECA), IEEE, pp. 1-6. https://doi.org/10.1109/ICAECA52838.2021.9675489
[12] Artificial intelligence in Energy: Use cases, solutions, best practices-N-iX. https://www.n-ix.com/artificial-intelligence-in-energy, accessed on Aug. 28, 2023.
[13] Marinakis, V. (2020). Big data for energy management and energy-efficient buildings. Energies, 13(7): 1555. https://doi.org/10.3390/en13071555
[14] Forootan, M.M., Larki, I., Zahedi, R., Ahmadi, A. (2022). Machine learning and deep learning in energy systems: A review. Sustainability, 14(8): 4832. https://doi.org/10.3390/su14084832
[15] Kamp, M., Koprinska, I., Bibal, A., Bouadi, T., Frénay, B., Galárraga, L., et al. (Eds.). (2022). Machine learning and principles and practice of knowledge discovery in databases. In International Workshops of ECML PKDD 2021, Virtual Event.
[16] Nezhad, A.E., Rahimnejad, A., Gadsden, S.A. (2021). Home energy management system for smart buildings with inverter-based air conditioning system. International Journal of Electrical Power & Energy Systems, 133: 107230. https://doi.org/10.1016/j.ijepes.2021.107230
[17] Kaligambe, A., Fujita, G., Keisuke, T. (2022). Estimation of unmeasured room temperature, relative humidity, and CO2 concentrations for a smart building using machine learning and exploratory data analysis. Energies, 15(12): 4213. https://doi.org/10.3390/en15124213
[18] Benavente-Peces, C., Ibadah, N. (2020). Buildings energy efficiency analysis and classification using various machine learning technique classifiers. Energies, 13(13): 3497. https://doi.org/10.3390/en13133497
[19] Ilager, S., Ramamohanarao, K., Buyya, R. (2020). Thermal prediction for efficient energy management of clouds using machine learning. IEEE Transactions on Parallel and Distributed Systems, 32(5): 1044-1056. https://doi.org/10.1109/TPDS.2020.3040800
[20] Eseye, A.T., Lehtonen, M. (2020). Short-term forecasting of heat demand of buildings for efficient and optimal energy management based on integrated machine learning models. IEEE Transactions on Industrial Informatics, 16(12): 7743-7755. https://doi.org/10.1109/TII.2020.2970165
[21] Wang, Y. (2022). Application of deep learning model in building energy consumption prediction. Computational Intelligence and Neuroscience, 2022. https://doi.org/10.1155/2022/4835259
[22] Nabavi, S.A., Motlagh, N.H., Zaidan, M.A., Aslani, A., Zakeri, B. (2021). Deep learning in energy modeling: Application in smart buildings with distributed energy generation. IEEE Access, 9: 125439-125461. https://doi.org/10.1109/ACCESS.2021.3110960
[23] Liu, X., Ren, M., Yang, Z., Yan, G., Guo, Y., Cheng, L., Wu, C. (2022). A multi-step predictive deep reinforcement learning algorithm for HVAC control systems in smart buildings. Energy, 259: 124857. https://doi.org/10.1016/j.energy.2022.124857
[24] Shen, C., Zhang, H., Meng, S., Li, C. (2023). Augmented data driven self-attention deep learning method for imbalanced fault diagnosis of the HVAC chiller. Engineering Applications of Artificial Intelligence, 117: 105540. https://doi.org/10.1016/j.engappai.2022.105540
[25] Zhang, F., Saeed, N., Sadeghian, P. (2023). Deep learning in fault detection and diagnosis of building HVAC systems: A systematic review with meta analysis. Energy and AI, 100235. https://doi.org/10.1016/j.egyai.2023.100235
[26] Du, Z., Liang, X., Chen, S., Zhu, X., Chen, K., Jin, X. (2023). Knowledge-infused deep learning diagnosis model with self-assessment for smart management in HVAC systems. Energy, 263: 125969. https://doi.org/10.1016/j.energy.2022.125969
[27] Gao, Y., Miyata, S., Akashi, Y. (2023). How to improve the application potential of deep learning model in HVAC fault diagnosis: Based on pruning and interpretable deep learning method. Applied Energy, 348: 121591. https://doi.org/10.1016/j.apenergy.2023.121591
[28] Du, Z., Liang, X., Chen, S., Li, P., Zhu, X., Chen, K., Jin, X. (2023). Domain adaptation deep learning and its TS diagnosis networks for the cross-control and cross-condition scenarios in data center HVAC systems. Energy, 128084. https://doi.org/10.1016/j.energy.2023.128084
[29] Du, Z., Chen, K., Chen, S., He, J., Zhu, X., Jin, X. (2023). Deep learning GAN-based data generation and fault diagnosis in the data center HVAC system. Energy and Buildings, 289: 113072. https://doi.org/10.1016/j.enbuild.2023.113072
[30] Mahdavi, A., Berger, C., Tahmasebi, F., Schuss, M. (2019). Monitored data on occupants’ presence and actions in an office building. Scientific Data, 6(1): 290. https://doi.org/10.1038/s41597-019-0271-7
[31] Ozdemir, S., Susarla, D. (2018). Feature Engineering Made Easy: Identify Unique Features from Your Dataset in Order to Build Powerful Machine Learning Systems. Packt Publishing Ltd.
[32] Banachewicz, K., Massaron, L., Goldbloom, A. (2022). The Kaggle book: Data analysis and machine learning for competitive data science. Packt Publishing Ltd.
[33] Sarah, G. (2022). Introduction to machine learning with Python.