Wial Hanon*![]() | Mahdi Abed Salman
| Mahdi Abed Salman![]()
© 2024 The authors. This article is published by IIETA and is licensed under the CC BY 4.0 license (http://creativecommons.org/licenses/by/4.0/).
OPEN ACCESS
Massive amounts of heterogeneous data are produced by Internet of Things (IoT) devices utilized in daily life and numerous fields, and these data streams need to be stored, processed, analyzed, and transmitted to the cloud. It usually suffers from missing values and anomalies; system services also suffer from congestion due to slow processors, resulting in low throughput, a high response time, slow decision-making, and data loss, resulting in low quality of service and the deterioration of the system's performance. In this study, propose to integrate the smart controller (SC) with the Message Queuing Telemetry Transport (MQTT) broker and services in the fog node to make decisions automatically to prevent congestion in the system's services and speed up the processing. The IoT stream is inspected in the services for anomalies using one-class support vector machines (OCSVM). Then, using the integrating technique of principal component analysis (PCA) and the k-nearest neighbors (KNN) algorithm in the SC, obtain the best prediction of the efficient number of services that must be deployed in the system. The operating model proposed showed significantly stable system performance in terms of throughput, latency, response time, the amount of data loss, and preventing congestion.
Message Queuing Telemetry Transport (MQTT), smart controller, spawn, latency, throughput, screen table, data loss, PCA, k-nearest neighbors regression (KNNR)
This era witnesses growth in number of IoT devices with multiple uses in daily life, such in smart homes, health care, and wearable devices, production quality, and other fields of life [1]. Data from a smart city or health care are two examples of the many sources and formats of the vast volumes of data [2]. Data sizes have become widely distributed and need effective techniques for resource management in storage, processing, and analysis [3], such as cloud computing [4, 5]. However, collecting and sending raw data to the remote cloud suffers from high latency because of network congestion, and low processing throughput.
The researchers suggested using the publication of topics and geographical location at the edge of the cloud (cloud computing gateway) to increase the deployment of IoT devices with quality of service and throughput. The use of the edge with IoT applications suffers from challenges represented by heterogeneous data sources, a lack of resources for large processors, and low bandwidth [6]. Among the obstacles of production and processing in the cloud and overcoming all edge/cloud computing challenges is the fog computing technology which has emerged as a compromise solution to alleviate these problems [7, 8]. Moreover, investment in the fog computing environment provides the resources required for the applications of IoT and reduces latency [3], and improves service quality [9].
The broker works in a dynamic publishing and subscription model inside a fog node that may support useful and flexible features such as anonymity, multiple publishers and subscribers, synchronization, and finally, no system failure if one of the subscribers is not connected to the Internet [10-12]. It provides a fast response time, enhances the performance of fog computing, and reduces lost messages [13].
Problems that occur in services due to congestion, data loss, slow processing, and decreased system performance, are a motivation for using the proposed model that integrates the broker and SC with a group of services. In addition, a dynamic solution must be found that can evaluate the performance of the system’s services at any time without the need for human intervention.
This paper proposes integrating a smart controller module that makes dynamic decisions for add (spawn) or remove (kill) the services automatically with an MQTT broker in a fog node. In the same context, the SC is a service that assists improving the performance of the system by monitoring and collecting information on all measurement services. The latency, throughput, and data loss due to overload and the high processing time of data are measures used in the SC to evaluation measures by applying the PCA and KNN algorithms. For reliability, machine learning algorithms (One-Class-SVM) [14] are used in these services for preprocessing data streams to detect anomalies.
The integrating algorithms of the PCA and KNN regression (KNNR) allow effective features selection, handling of multicollinearity, improved generalization, and computational efficiency. By leveraging the strengths of both techniques, the performance and efficiency of the regression model can be enhanced. Unsupervised machine learning algorithms like PCA try to minimize the dimensionality (number of features) of a dataset while keeping as much information as they can. To do this, a new set of features termed components that are composites of the original features and are uncorrelated with one another are discovered. Additionally, they are restricted so that the first component explains the maximum amount of data variability, the second component explains the next highest amount, and so on [15, 16].
K-nearest neighbors regression is a supervised learning algorithm that can be used for regression tasks. It predicts the target value of a new sample by considering the values of its k-nearest neighbors in the training dataset. The KNN algorithm is used in the SC to predict the best measures that lead to making decisions automatically in real time [17, 18].
The major contributions of this paper include:
(1) Propose SC integrated with a broker and services in the fog environment. SC collected information about services in the screen table.
(2) Building the SC model to make decisions to add (spawn) or remove (kill) the services according to the current information received from the services.
(3) Building model to find best measurements using KNN with best features selection from PCA and best K.
(4) Improving system performance included low latency, reduced data loss, high throughput, and reduced overload by running a group of services automatically.
The remainder of the paper is organized as follows: Section 2 presents related works. Section 3 describes the methodology of the research. The results and discussion are presented in Section 4. The comparison with previous works in Section 5, and finally, the Section 6 represents the conclusion.
In this section, we review previous studies that dealt with the process of sending data to the cloud over the edge gateway or the fog gateway for improving service quality and productivity in terms of the transition time between IOT devices (data sources) and services or applications. It is noted that most researchers used the fog computing environment and its distinctive services without thinking about using the broker. In addition, there is no clear guide on how to use or control multiple instances of highly required services.
The researchers [19] suggested a solution to improve the quality of service in terms of service availability against failures and cost efficiency by choosing the optimal location for the cloud data center and providing service in cases of failure in the data center networks by formulating a linear program to achieve the optimal design of the joint. It integrates a preconfigure protection cycle to provide failover protection in just one link. For failure redirection, data center network replication is used. It did not take into account the processing of the increasing amounts of data from the Internet of Things, but rather the cost and protection.
The researchers [20] suggested scheduling jobs to improve the quality of service, as it was found that the jobs that were scheduled were not related to the quantities of jobs needed by the Internet of Things, so they could not be taken into consideration. Because the study relies on DCN networks, which suffer from poor processing of the increasing number of requests by IoT consumers in real time.
The researchers [21] used the IoT Gateway as an edge between cloud computing and IoT devices. The data can undergo some preprocessing close to the edge, which is the source of its output. It is feasible to take part in data allocation and transfer, but only as a cloud computing representative. As a result, when the data flow increases, it has poor performance, limited processing throughput, and security issues.
In the smart home [22], the gateway collects data from home sensors and transfers it to the sleep care service for the IoTs where the sensor is compatible with the smart home gateway to improve the quality of service. Thus, the collected results from the service are sent to the cloud for storage and analysis.
Ijaz et al. [23] used the gateway that works as a fog node to collect data from different sensors in the field of health care and redirect it to the working mediator node for further processing. Thus, the gateway sends the data to the intermediary (not the service or the end-user) which will redirect it to the centers for disease control (CDC). This means that there is an unnecessary delay or jump represented by the collection gateway that leads to low transfer throughput.
Related work has focused on addressing the problem of congestion or delay in transferring data and processors by approximating the locations of processors without considering employing more than one tool at the gates or edge of the network, while in this study we combined a group of tools and brought them closer to the data source using a fog node and employed a broker within it. The broker provides speed, security, and accuracy in transferring and distributing data. In addition to using SC, which controls the number of services that process data and adapts it to system states in efficient time.
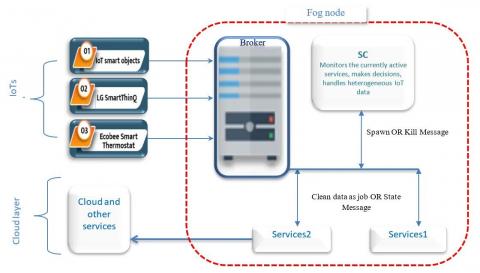
The proposed methodology, referred to in Figure 1, aims to enhance system performance and reduces overload by making decisions to spawn or kill services automatically. All services have been subscribed to the broker based on a specific topic. These services collect and preprocess data before sending it to the cloud as clean data. The SC is controlling the processing speed-up by predicting the number of services that avoid data congestion on the service. Create an efficient model by integrating the algorithms PCA and KNN, which has the ability to select the best principle components for can be to predict efficiency to numbers of service.
Figure 1. Architecture of the proposed system
3.1 IoT devices
An IoT device is a collection of physical devices that are referred to as objects in IoT. They are unique in terms of identity, connected to the Internet, and allow remote sensing and monitoring capabilities. Internet of Things devices generate big data from various geographic locations. IoT devices can sense temperature, humidity, blood pressure, body temperature, sleep care, etc. Data messages are published to the IB according to the topic specified in the IoT devices. IoT devices can be discovered dynamically in the network by another device or the network itself. It can also describe itself and its characteristics to other devices or user applications.
3.2 Intelligent broker (IB)
On a fog node, an MQTT broker based on the publish/subscribe model is used to provide appropriate interaction among connected services and IoT devices. An intelligent broker notifies the services of the existence of data on a specific topic when it becomes available for delivery, and thus the services can receive the data for which they have subscribed to the intelligent broker. The services receive the data stream for preprocessing, such as collecting the data, verifying it for any problems, and sending it for cleaning and correction. One of the important capabilities of this intelligent broker is its ability to distribute data streams to more than one subscribed service while ensuring that the data is not duplicated in other subscribers' services. Also, it is ensuring that the system does not fail or stop in the event of a service failure, as is the case with edge or fog servers.
3.3 Collector service
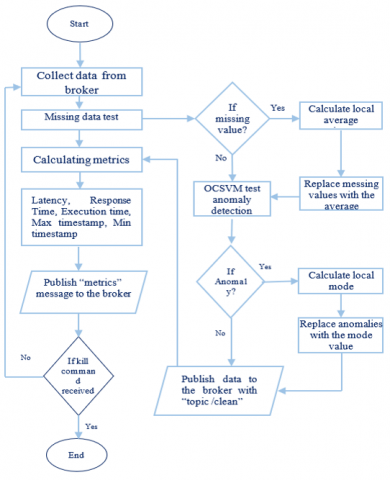
A group of running services that use ML algorithms to preprocess data and have subscribed to IB according to the interesting topics. They receive, collect, and preprocess data in blocks and republish clean data back to the IB for the benefit of consumer services, cloud, or applications. Any service can be added to the system by the administrator. Figure 2 shows the architecture for a service, called collector service developed with IB and consumer services. The collector service task is to collect data in the blocks and verify the messing value and anomaly in each block. Finally, the correction of the data in the block and republish clean data.
Figure 2. Architecture for a collector service
3.4 Smart controller model (SC)
The SC is a service within the fog node. Its purpose is to monitor and collect information in the screen table for a given service of a particular type and make a decision whether to remove one service or add a new one according to the information collected about the performance of that service. The screen table consists of the information sent from services and is used to evaluate the system's performance containing a timestamp to represent the time of receiving information from the service. The # counter of running services is given the job of latency. When the latency increases for a particular service, the SC adds a service and increments the counter for that service type. The SC publishes control messages in the IB to the service.
3.4.1 Implementing the SC
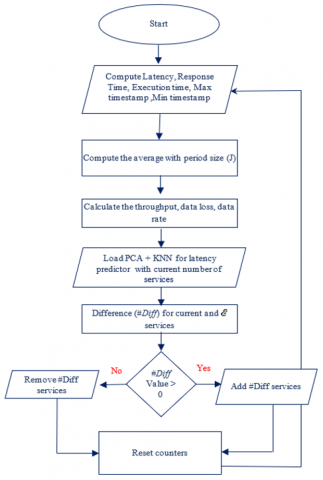
The SC collects information periodically from the currently running services (collector service), including the response time, latency, and execution time. The SC monitors these measures and may decide to spawn or kill a service automatically. The measures are saved in the screen table with details of transmission such as topic name, topic ID, and timestamp. In addition, it is collected in the jobs during specific periods (∆T). In the ∆T, calculate the average latency, average response time, and throughput for each job based on the topic name. In its initial state, the system has one service working for each topic name. For example, in our experiment, the topic name is temperature (Temp). The decision to spawn or kill is made by comparing the current number of services with the predicted number of services (ℰ) by integrating PCA and KNN and create new model for predicted.
3.4.2 Smart controller behavior
Figure 3. SC architecture
The SC's overall behaviour starts where the preprocessors left off with services. The SC receives the measures published by the IB. In the experiment, the value of ∆T=20 was chosen, where four values (5, 10, 20, and 30) were tested, and the stability of latency, response time, and throughput was observed at this value more than at the previous values. Calculates latency, throughput, data loss, and data rate. The difference (diff) represents the result of subtracting each of the current number of services from ℰ. The spawn services in the system if the value of the diff is positive, and if it is negative, it will kill services after the end of the pre-processing operations in it. Finally, it replaces the screen table values with the current ones. As see in Figure 3.
3.4.3 Dimensionality reduction
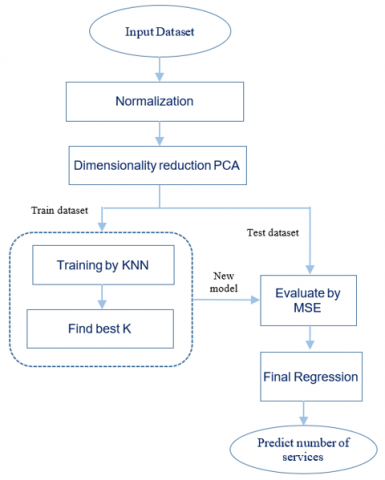
By leveraging the strengths of both techniques, you can enhance the performance and efficiency of the regression model. ML uses dimensionality reduction style for various purposes, one of them being important feature selection from feature space. It is used to reduce overfitting and increase the complexity, enhance the ML model performance, rapid the training for massive data, and create more meaningful features. To select the best feature, integrate PCA with KNNR, and use a certain threshold to create a new model based on the important features that can be used it in KNNR. In this work, input a set of features and replace them with a smaller set of principal components (pc). By setting a threshold on the cumulative variance, the best features can be retained (not too high or low). The pc is used in the KNNR to predict the best number of services. The following steps after loading the dataset can be seen in Figure 4:
Figure 4. Overview for PCA and KNN
(1) Start by normalizing the data until we unify the data within a specific range.
(2) Constructing the covariance matrix involves determining the relationship between pairs of variables and the amount of variance.
(3) Computing the eigenvectors and eigenvalues.
(4) Sorting the eigenvalues in descending order and selecting the top k eigenvectors corresponding to the highest eigenvalues.
(5) Transforming the feature matrix using the selected principal components by multiplying the original feature matrix by the selected eigenvectors to obtain a reduced-dimensional feature matrix.
(6) Splitting the dataset into training and testing sets by dividing the transformed feature matrix and the target variable into a training set and a testing set of 80% of the data and the remaining for testing.
(7) Train the KNNR model. Fit the KNNR model using the training data. Specifying the number of nearest neighbours (k) and any other relevant parameters, such as distance metrics.
(8) Evaluate the model: Use the trained model to predict the testing data. Calculate the appropriate regression evaluation measure, such as mean squared error (MSE).
(9) Selecting the best-performing k and finalizing the model: Choose the value of k that yields the best regression performance based on the evaluation metrics. Train the final KNNR model using this optimal model and best k.
For the sake of feasibility and to measure the quality of the proposed model, experiments are conducted, it is worked on a real dataset that contains a set of IoT sensor readings from (https://www.kaggle.com/datasets) named Intel Berkeley Research Lab Sensor Data (IBRL). It consists of data amount 2.3 million readings collected from 54 devices with eight different sensors. The module published the data to the broker. For the experiment, a sensor's data is published separately by a dedicated Python module. A service that has been subscribed to by the IB will receive and collect data and perform preprocessing such as anomaly detection using OCSVM algorithm and data correction. Then, the service will publish certain information to the SC (status messages) for making decisions in cases of overloading and performance degradation.
In the SC, a compilation of status messages that are published from a certain type of service running currently that has subscribed to the IB and the same topic interests among them. The information is aggregated into a screen table which can store all the values of the measures in it and will be used as a reference database. It is used in the future to determine the appropriate number of services that must be implemented according to a pre-selected measure or set of standards. From the information in Table 1, we note that the best results were obtained using three services for our setting based on latency and throughput. The best latency is 3.43s, throughput is 5.83job/s and response time is 3.63s.
Table 1. The results obtained from implemented the SC
|
Services |
Latency (s) |
Throughput Job/s |
Response Time (s) |
Data Lost |
|
1 service |
6.76 |
2.96 |
6.96 |
0.88 |
|
2 services |
3.46 |
5.78 |
3.71 |
0.57 |
|
3 services |
3.43 |
5.83 |
3.63 |
0.46 |
|
4 services |
3.58 |
5.59 |
3.87 |
0.14 |
|
5 services |
4.64 |
4.31 |
4.89 |
0.14 |
Data loss is reduced to the greatest extent possible. A reduction of 0.136 percent in data loss on the base value (base value with one service and other values obtained from increased numbers of services) is achieved. The data loss starts decreasing with the increase in the number of currently running services. As presented in Table 1, the best case for data loss reduction is when four and five services are running, because of the starvation state in the service. In other words, there is a long waiting time in the service to receive and process data, this increase is evident in the latency and response time.
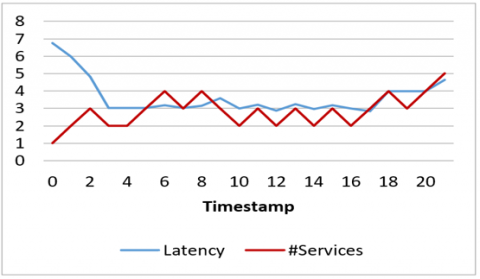
One of the most important aims of the study is to reduce latency, congestion, and processing speed-up. In addition, there is an improved relationship between the latency and the number of services currently executing within the period in which the jobs are collected in the SC. as seen in Figure 5. The x-axis represent the timestamp, y-axis represent the value of latency and the number of services over the time.
Latency: The period time required to collect one data job, starting from the time of the first message sent from the publisher to the last message received. It depends on the number of hops, the performance of the broker or server, and the transport protocols. As near to zero latency as feasible is preferable.
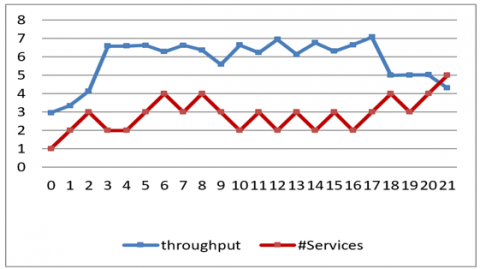
Throughput is the amount of data a system can process in a given time, which expressed in job per second (job/s). The speed at which a particular workload can be finished and response time-the interval of time between a single interactive user request and the delivery of the response-are included in all relevant measures of system throughput. Improving throughput with the best number of services, we achieved throughput from 2.96 with one service to 6.64 jobs per second for three services, which are added to the system automatically using the SC model as in Figure 6. The x-axis represent the timestamp, y-axis represent the value of throughput and the number of services over the time.
Figure 5. Latency and number of services
Figure 6. The throughput with #services
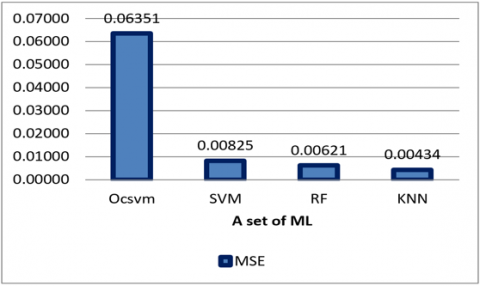
Figure 7. Minimum the MSE by KNN
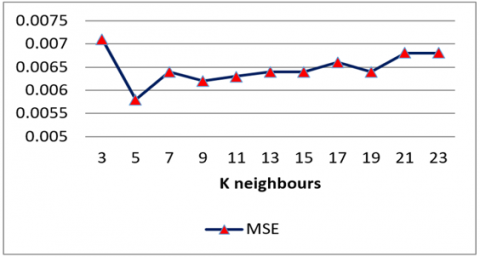
Figure 8. Best K selection
The KNN algorithm is better in the experiment, especially after reducing the variance between features in the feature space using the PCA algorithm. Repeating the experiments, it is always the best. Therefore, the MSE of the proposed model by using PCA and KNN appears the best prediction compared to other algorithms. as seen in Figure 7. The x-axis represent a set of ML, y-axis represent value of MSE.
In terms of MSE, it appeared that applying the PCA algorithm to the features for the purpose of selecting the best model could be used in the algorithms for prediction, and obtaining the lowest value for MSE is efficient. After some repeated executions on the best model, the best K is got by choosing the least MSE and then applying it in the KNNR algorithm. The best K obtain from applying best model as see in Figure 8. The x-axis represent the number of K, y-axis represent value of MSE.
In the end, the experimental results of the proposed model show stability in the performance of the system when running three services. The stability of improvement is relative to measures of latency from 6.76 to 3.43 and throughput from 2.96 to 5.83 that are compared in the SC model and decision-making to spawn or kill the currently executing service, which is compiled in a screen table within the SC.
The stability of improvement is relative to measures of latency from 6.76 to 3.43 and throughput from 2.96 to 5.83 that are compared in the SC model and decision-making to spawn or kill the currently executing service, which is compiled in a screen table within the SC.
The best model used to predict numbers of services is the integration of the PCA and KNN with an MSE of 0.00434 compared with other MLs such as Support Vector Machines and Random Forest etc. [24]. It can be considered the properties of the computer affected the results when the implementation of the model was obtained. But in general, there is an improvement in latency and throughput with the increase in the number of services to a certain extent, after which the metrics begin to increase again.
To calculate the value of improvement in performance measures (response time, latency, and data loss), subtract the highest value (HV) from the best values (BV) divided by the highest value (HV), then the final result is multiplied by 100. As see in the equation bellow:
Enhance measuer $=\left(\frac{H {V}-B {V}}{H V}\right) \times 100$ (1)
In the experimental scenario, the OCSVM accuracy in anomaly detection is (99.44%) as compared to the result from other works. The researchers used the Monotone Split and Conquer (MSC) scheme and splitting data generally into sub-directions approximated and used accuracy and false positive rates as the performance indicators of the evaluation algorithm [25], the researchers used three different network models and used DA (detection accuracy), TPR (true positive rate), and PRE (precision) as the performance indicators of the evaluation algorithm [26]. The accuracy is (93% and 99.05%) respectively using the same data set (IBRL).
The average enhancement of latency is 91.65%, response time is 97.34%, throughput is 49.2%, and reducing data loss is 84.49%. ML techniques used in the SC let decision-making be rapid and suitable for. In addition, they are used in services to enhance the reliability of a system. The best performance is observed for well-pre-processed data in the services, underscoring the significance of appropriate data-preprocessing methods.
Other works that propose fog computing do not take into account the various aspects of the model. Several previous works [27-31] do not take advantage of resources near the edge of the network. Rather, data is sent to cloud centers for the purpose of processing, analysis, and decision-making. These models provide much higher latency as all the computation takes place on the cloud and therefore have higher data transfer times [32].
In addition, the results, as seen in Table 2, are obtained from the implementation of the SC model. The results are compared with previous studies in terms of response time and latency.
Notice: The unit for results is the second for each block that contained 2,500 messages, which are presented in Table 1. After converting to milliseconds for latency and response time, the results become as those in Table 2. For integrated IB and SC, the average latency becomes 1.37ms, and response time becomes 1.54ms.
Table 2. Compared results from this work with related works
|
Ref. |
Latency (ms) |
Response Time (ms) |
Accuracy |
|
[3] |
48.56 |
- |
- |
|
[22] |
8.83 |
- |
- |
|
[32] |
20.45 |
- |
- |
|
[33] |
- |
109 |
- |
|
[34] |
- |
39.5 |
- |
|
[26] |
- |
- |
99.05% |
|
[25] |
- |
- |
93% |
|
This work (IB+SC) |
1.37 |
1.54 |
99.44% |
Some systems' services, such as health care, weather, and smart homes, suffer from congestion and data heterogeneity, leading to a degradation in the overall system's performance. Thus, it leads to inaccurate results or system failure at the end. An SC monitors the overload of system services and makes decisions dynamically. SC shows high stability in system performance by controlling the number of active services relative to the data arrival rate. An improvement in the system's performance is measured by latency, throughput, data rate, response time, and the amount of data loss. According to the results of the study, it is observed that monitoring and avoiding congestion has a noticeable impact on the performance of the system's services. Based on the results obtained, OCSVM shows superior performance as the most effective in terms of anomaly detection in the data stream published from IoT devices to the services. The accuracy of anomaly detection is 99.44%.
The fog node hosts system components due to the advantages of fog computing. The quality of service is enhanced due to enhanced system measurements and rapid making decisions automatically.
[1] Pham, V.N., Nguyen, V., Nguyen, T.D., Huh, E.N. (2019). Efficient edge-cloud publish/subscribe broker overlay networks to support latency-sensitive wide-scale IoT applications. Symmetry, 12(1): 3. https://doi.org/10.3390/sym12010003
[2] Baucas, M.J., Spachos, P. (2020). Fog and IoT-based remote patient monitoring architecture using speech recognition. In 2020 IEEE Symposium on Computers and Communications (ISCC), Rennes, France, pp. 1-6. https://doi.org/10.1109/ISCC50000.2020.9219649
[3] Pham, V.N., Lee, G.W., Nguyen, V., Huh, E.N. (2021). Efficient solution for large-scale IoT applications with proactive edge-cloud publish/subscribe brokers clustering. Sensors, 21(24): 8232. https://doi.org/10.3390/s21248232
[4] Al-Joboury, I.M., Al-Hemiary, E.H. (2018). Performance analysis of internet of things protocols based fog/cloud over high traffic. Journal of Fundamental and Applied Sciences, 10(6S): 176-181. http://doi.org/10.4314/jfas.v10i6s.113
[5] Dutta, V., Choras, M., Pawlicki, M., Kozik, R. (2020). Detection of cyberattacks traces in IoT data. Journal of Universal Computer Science, 26(11): 1422-1434. https://doi.org/10.3897/jucs.2020.075
[6] Dhelim, S., Ning, H., Aung, N. (2020). ComPath: User interest mining in heterogeneous signed social networks for Internet of people. IEEE Internet of Things Journal, 8(8): 7024-7035. https://doi.org/10.1109/JIOT.2020.3037109
[7] Fei, J., Xiaoping, M. (2019). Fog computing perception mechanism based on throughput rate constraint in intelligent Internet of Things. Personal and Ubiquitous Computing, 23: 563-571. https://doi.org/10.1007/s00779-019-01200-9
[8] Bonomi, F., Milito, R., Zhu, J., Addepalli, S. (2012). Fog computing and its role in the internet of things. In Proceedings of the First Edition of the MCC Workshop on Mobile Cloud Computing, Helsinki Finland, pp. 13-16. https://doi.org/10.1145/2342509.2342513
[9] Sarkar, S., Misra, S. (2016). Theoretical modelling of fog computing: A green computing paradigm to support IoT applications. Iet Networks, 5(2): 23-29. https://doi.org/10.1049/iet-net.2015.0034
[10] Eugster, P.T., Felber, P.A., Guerraoui, R., Kermarrec, A.M. (2003). The many faces of publish/subscribe. ACM Computing Surveys (CSUR), 35(2): 114-131. https://doi.org/10.1145/857076.857078
[11] Hanon, W., Salman, M.A. (2022). Review the deployment and role of broker in IoT platforms. In 2022 5th International Conference on Engineering Technology and its Applications (IICETA), Al-Najaf, Iraq, pp. 308-315. https://doi.org/10.1109/IICETA54559.2022.9888675
[12] Lampkin, V., Leong, W.T., Olivera, L., Rawat, S., Subrahmanyam, N., Xiang, R (2012). Building smarter planet solutions with MQTT and IBM websphere MQ telemetry. IBM Redbooks.
[13] Standard, O.A.S.I.S. (2014). MQTT version 3.1.1. OASIS Standard. https://docs.oasis-open.org/mqtt/mqtt/v3.1.1/.
[14] Kumar, B., Sinha, A., Chakrabarti, S., Vyas, O.P. (2021). A fast learning algorithm for one-class slab support vector machines. Knowledge-Based Systems, 228: 107267. https://doi.org/10.1016/j.knosys.2021.107267
[15] Zhai, H. (2022). Improving KNN Algorithm efficiency based on PCA and KD-tree. In 2022 International Conference on Machine Learning and Knowledge Engineering (MLKE), pp. 83-87. https://doi.org/10.1109/MLKE55170.2022.00021
[16] Topolski, M. (2020). The modified principal component analysis feature extraction method for the task of diagnosing chronic lymphocytic leukemia type B-CLL. Journal of Universal Computer Science, 26(6): 734-746. https://doi.org/10.3897/jucs.2020.039
[17] Aziz, R.M., Baluch, M.F., Patel, S., Kumar, P. (2022). A machine learning based approach to detect the Ethereum fraud transactions with limited attributes. Karbala International Journal of Modern Science, 8(2): 139-151. https://doi.org/10.33640/2405-609X.3229
[18] Obayes, H.K., Al-Shareefi, F. (2023). Secure heart disease classification system based on three pass protocol and machine learning. Iraqi Journal for Computer Science and Mathematics, 4(2): 72-82. https://doi.org/10.52866/ijcsm.2023.02.02.003
[19] Xiao, J., Wen, H., Wu, B., Jiang, X., Ho, P.H., Zhang, L. (2013). Joint design on DCN placement and survivable cloud service provision over all-optical mesh networks. IEEE Transactions on Communications, 62(1): 235-245. https://doi.org/10.1109/TCOMM.2013.121313.130240
[20] Chandio, A.A., Bilal, K., Tziritas, N., Yu, Z., Jiang, Q., Khan, S.U., Xu, C.Z. (2014). A comparative study on resource allocation and energy efficient job scheduling strategies in large-scale parallel computing systems. Cluster Computing, 17: 1349-1367. https://doi.org/10.1007/s10586-014-0384-x
[21] de Souza, F.R., de Assunçao, M.D., Caron, E. (2019). A throughput model for data stream processing on fog computing. In 2019 International Conference on High Performance Computing & Simulation (HPCS), Dublin, Ireland, pp. 969-975. https://doi.org/10.1109/HPCS48598.2019.9188146
[22] Ahn, J., Lee, B.M. (2020). Smart edge broker for location-based transfer between services and distributed data in IoT smart services. Mobile Information Systems, 2020. https://doi.org/10.1155/2020/8896252
[23] Ijaz, M., Li, G., Lin, L., Cheikhrouhou, O., Hamam, H., Noor, A. (2021). Integration and applications of fog computing and cloud computing based on the internet of things for provision of healthcare services at home. Electronics, 10(9): 1077. https://doi.org/10.3390/electronics10091077
[24] Kumar, R.R., Lakshmi, M.S., Ashwak, B.S., Rajeshwari, K., Zaid, S.M. (2023). Thyroid disease classification using machine learning algorithms. In E3S Web of Conferences. EDP Sciences, 391: 01141. https://doi.org/10.1051/e3sconf/202339101141
[25] Dang, T.B., Le, D.T., Nguyen, T.D., Kim, M., Choo, H. (2021). Monotone split and conquer for anomaly detection in IoT sensory data. IEEE Internet of Things Journal, 8(20): 15468-15485. https://doi.org/10.1109/JIOT.2021.3073705
[26] Shen, X., Zhu, C., Zang, Y., Niu, S. (2022). A method for detecting abnormal data of network nodes based on convolutional neural network. Journal of Computers, 33(3): 49-58. https://doi.org/10.53106/199115992022063303004
[27] Rajasekaran, M., Yassine, A., Hossain, M.S., Alhamid, M.F., Guizani, M. (2019). Autonomous monitoring in healthcare environment: Reward-based energy charging mechanism for IoMT wireless sensing nodes. Future Generation Computer Systems, 98: 565-576. https://doi.org/10.1016/j.future.2019.01.021
[28] Barik, R.K., Priyadarshini, R., Dubey, H., Kumar, V., Mankodiya, K. (2018). FogLearn: Leveraging fog-based machine learning for smart system big data analytics. Geospatial Intelligence: Concepts, Methodologies, Tools, and Applications, IGI Global, 3: 1225-1241. https://doi.org/10.4018/978-1-5225-8054-6.ch052
[29] Rajkomar, A., Oren, E., Chen, K., Dai, A. M., Hajaj, N., Hardt, M., Liu, P.J., Liu, X., Marcus, J., et al. (2018). Scalable and accurate deep learning with electronic health records. NPJ Digital Medicine, 1(1): 18. https://doi.org/10.1038/s41746-018-0029-1
[30] Pham, M., Mengistu, Y., Do, H., Sheng, W. (2018). Delivering home healthcare through a cloud-based smart home environment (CoSHE). Future Generation Computer Systems, 81: 129-140. https://doi.org/10.1016/j.future.2017.10.040
[31] Sahoo, P.K., Mohapatra, S.K., Wu, S.L. (2018). SLA based healthcare big data analysis and computing in cloud network. Journal of Parallel and Distributed Computing, 119: 121-135. https://doi.org/10.1016/j.jpdc.2018.04.006
[32] Tuli, S., Basumatary, N., Gill, S.S., Kahani, M., Arya, R.C., Wander, G.S., Buyya, R. (2020). HealthFog: An ensemble deep learning based smart healthcare system for automatic diagnosis of heart diseases in integrated IoT and fog computing environments. Future Generation Computer Systems, 104: 187-200. https://doi.org/10.1016/j.future.2019.10.043
[33] Badidi, E., Ragmani, A. (2020). An architecture for QoS-aware fog service provisioning. Procedia Computer Science, 170: 411-418. https://doi.org/10.1016/j.procs.2020.03.083
[34] Cheng, B., Solmaz, G., Cirillo, F., Kovacs, E., Terasawa, K., Kitazawa, A. (2017). FogFlow: Easy programming of IoT services over cloud and edges for smart cities. IEEE Internet of Things Journal, 5(2): 696-707. https://doi.org/10.1109/JIOT.2017.2747214