Suratno* | Bonivasius Prasetya Ichtiarto
© 2021 IIETA. This article is published by IIETA and is licensed under the CC BY 4.0 license (http://creativecommons.org/licenses/by/4.0/).
OPEN ACCESS
The global competition encourages Indonesia to advance the economy, especially in manufacturing by implementing sustainable manufacturing. Companies must consider transportation costs and concern for the environment due to the large increase in greenhouse gas emissions and the increase in NOx, Particulate, and various other harmful pollutants. Emissions from transportation activities cause global climate change and damage air quality and human health in regional and urban areas. At the same time, the movement of empty containers can result in air pollution due to CO2 emissions which have a negative impact on sustainable development. This study aims to reduce carbon emissions in the logistics transportation chain in the Automotive Manufacturing Industry. The method used is the Eight Step Approach. The method used is systematic and structured from defining the problem to standardizing improvements. Analysis of the causes of the problem and proposed improvements are determined by Focus Group Discussion (FGD) with expert judgment. The source of the data obtained comes from field observations, FGD, company reports from 2019 to 2021. This research has proven that reducing carbon emissions has an impact on company profits. The largest decrease was contributed by improvements in transportation routes. The ratio of reducing carbon emissions by 2020 is 2.6% or an increase in efficiency compared to the previous year.
automotive industry, carbon emissions, eight step approach, focus group discussion, local delivery
The global competition encourages Indonesia to advance the economy, especially in manufacturing by implementing sustainable manufacturing. Sustainable manufacturing starts with lean manufacturing, environmentally friendly production and Life Cycle Assessment with attention to the safety of employees, consumers and society. There are various obstacles to implementing sustainable manufacturing [1]. Sustainability indicators in Indonesia are based on three aspects, namely economic, social and environmental seen from three perspectives, namely the industrial, government and academic sides [2, 3]. Sustainable manufacturing has a positive impact on state revenues but also has a negative impact on environmental problems caused by industrial waste and excessive use of natural resources.
The automotive industry is one of the car manufacturers in Indonesia. In its production activities, there are many transportation activities, one of which is in the Logistics section. Transportation plays an important role in supply chain management. A supply chain strategy that is implemented successfully requires proper transportation management. Consideration of choice of transportation management decisions is not only based on considerations of cheap transportation costs, service quality and timeliness but also must consider energy and environmental aspects [4-6].
In the economic field, total transportation costs account for a large portion [7, 8]. This is a challenge for logistics activities to be able to make prices cheaper, faster and service better [9, 10]. However, relatively little attention has been paid to the planning of transportation systems on the environment. Companies must consider the emissions and handling of loading and unloading facilities while operating but also the environment due to a large increase in Greenhouse Gas (GHG) emissions, an increase in NOx, PM, and various other harmful pollutants [11, 12]. Emissions from transportation activities cause global climate change and damage air quality and human health in regional and urban areas. At the same time, the movement of empty containers can result in air pollution due to CO2 emissions which have a negative impact on sustainable development [13, 14]. The transportation sector plays an important role in economic development and community welfare. However, transportation activities can cause various negative environmental impacts [15].
The transportation sector has a contribution as the second-largest contributor to GHG emissions after the energy industry with a percentage of 26 percent [16]. The highest GHG emission element resulting from transportation is CO2 gas which is the result of burning the fuel used. In addition to CO2, other GHG emission-forming elements are CH4 (methane) and N2O (Nitrogen dioxide). The highest contribution of CO2 gas is 75.02 percent, followed by CH4 gas at 21.34 percent and N2O at 3.64 percent [17]. The high CO2 gas will increase the element of carbon emissions which results in negative impacts for the company and the environment. Some of the negative impacts that occur on the company include the large costs incurred for transportation, waste on the transportation floor, wasted energy, unstable production system and others. Carbon emissions can also cause negative impacts on the environment such as environmental pollution, uncertain climate change resulting in flooding, famine and economic instability. In addition, if allowed to continue, carbon emissions can also cause air temperatures to increase and cause global warming. To create an environmentally friendly transportation system, it is necessary to make improvements to reduce greenhouse gas emissions [18-20].
Based on initial observations in the automotive industry, the Key Performance Indicator (KPI) for reducing CO2 emissions did not reach the target. The KPI target is 1.88% per year. The realization of this year's achievement is 7% or 1.16% per year. This is a gap that must be corrected immediately to achieve the target. Based on the phenomenon of the problem can make improvements with an eight-step concept approach. Eight steps are terminology from Japan that is specifically used for improvement projects in the manufacturing industry [21]. Eight steps are one method for the improvement program and improvement of manufacturing performance. This method is the steps used for problem-solving and improvement programs in the manufacturing industry. Through these eight steps, it is hoped that problem-solving and improvement programs can be carried out in a systematic, measurable and structured manner. This method can also be known for certain improvements with good results that have been achieved [22].
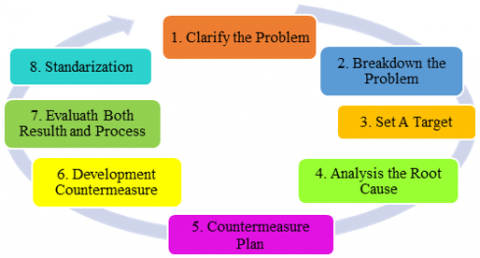
Based on previous research, the eight-step concept can increase the company's quality level and create customer satisfaction [23, 24]. The purpose of this study is to reduce carbon gas emissions in logistics transportation activities in the Automotive Industry. Garza-Reyes et al. [25] research carried out carbon emission efficiency by utilizing improvements to lean production systems. Improvements made by analyzing waste. The existence of this research when compared with previous research is to improve efficiency in carbon emissions in the logistics transportation system by utilizing travel routes and optimizing truck capacity. It is known in the problem phenomenon that the transportation system is the largest contributor to greenhouse gas elements, so improvements need to be made. The method used is an eight-step concept namely, Clarify the problem, Breakdown the problem, Set a Target, Root Cause Analysis, Countermeasure Plan, Develop Countermeasure, Evaluate Both Result and Process, and Standardization.
2.1 Framework
The purpose of this study is to reduce carbon emissions in logistics transportation activities in the Automotive Industry. The approach used is the eight-step concept. The 8-step approach was chosen because it can analyze problems in a complex, systematic, measurable and structured manner. The 8-step concept terminology can be seen in Figure 1.
Figure 1. The concept of the eight-step framework [22]
2.1.1 Clarify the problem
The first step is to define the problem by comparing the desired target with the actual conditions achieved at this time. In addition, this step defines the flow of the transportation process to make it easier to find problems that occur. Big problems are solved into smaller problems using the next step.
2.1.2 Breakdown the problem
Stages of problem-solving here by prioritizing the problem. Based on the number of problems, then we prioritize for improvement. The priority of the problem to be solved is determined based on three factors: the level of importance, the level of urgency, and the potential for expansion.
2.1.3 Set a target
Target setting focuses on solving problems. The targets set must be specific, measurable, challenging, and within a certain timeframe so that they can be controlled to be completed. The target value is not the same as the ideal conditions in reducing CO2 emissions but supports the realization of these conditions. A challenging target in this research is the target of reducing CO2 gas.
2.1.4 Analysis of the root cause
Perform analysis to find the root cause of the problem. Analysis of the causes of the problem is carried out by Focus Group Discussion (FGD) with the parties involved in the improvement project. The cause of the problem is searched based on the 4M+1E principle.
2.1.5 Countermeasure plan
Planning stages in tackling problems based on the causes that have been analyzed. Countermeasures are temporary, intended so that problems do not occur shortly. Countermeasure analysis is divided into 4 aspects, namely, quality, safety, cost and productivity. Countermeasures by analyzing the actions that provide the greatest added value.
2.1.6 Development countermeasure
This stage is the implementation of the previous stage. If the proposed improvement is good, it will be implemented immediately. Handling actions are carried out consistently according to schedule and the progress of actions is always checked periodically. If the actions are taken do not give the expected results then carry out other handling steps as additional improvements.
2.1.7 Evaluate both results and process
Evaluation measures are carried out to determine the improvements made to the level of achievement of the target. The results of the evaluation can be used as learning materials. The results of the evaluation will be shared with everyone in the company.
2.1.8 Standardization
The problem fixing successful process is then set as the new standard. Everyone can feel the same success. This standard will be published within the company so that other parts can set the same standard as the best practice of Green Supply Chain activities of transportation logistics activities.
2.2 Data collection
The analysis is carried out starting from the phenomenon of the problem, analyzing the causes of the problem and the improvements made. The subject of this research is the Transportation Logistics section. The data used are primary data and secondary data. The primary data used was obtained through direct observation in the field to find out the actual transportation flow. Primary data was also obtained through Focus Group Discussion (FGD) to analyze the factors causing problems and improvements. While secondary data was obtained from the company's annual report. The data is taken from the Logistic Delivery section from 2019 to 2021. Secondary data obtained include data on fuel consumption, mode of transportation, transportation routes and transportation distances. The way to get this data is through company improvement meetings that are held monthly.
3.1 Analysis with eight steps
This chapter will discuss the analysis of results with systematic stages using the eight-step concept method. The implications of the research will also be discussed at the end of the chapter to determine the contribution of this research to similar industries. The following is an analysis with an eight-step concept.
3.1.1 Clarify the problem
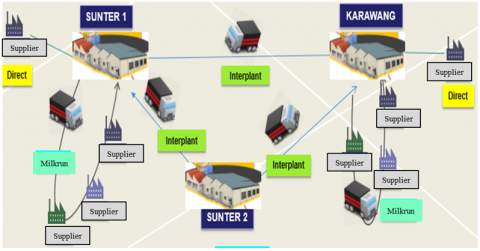
At this stage, the actual problem is defined. Interplant logistics consists of direct, interplant and milk-run. Direct supply is used when shipping a single supplier, it is intended for high volume times such as tire components that are not stacked in a truck with other parts. The type of delivery logistics with interplant, namely the delivery of in-house components is intended for certain shaped components that have a high delivery intensity. While the milk-run system is the delivery of components from suppliers, with the aim of volume and delivery efficiency. The mode used is mostly using logistics partners. The number of logistics partners that work together is 8 companies as shown in Figure 2.
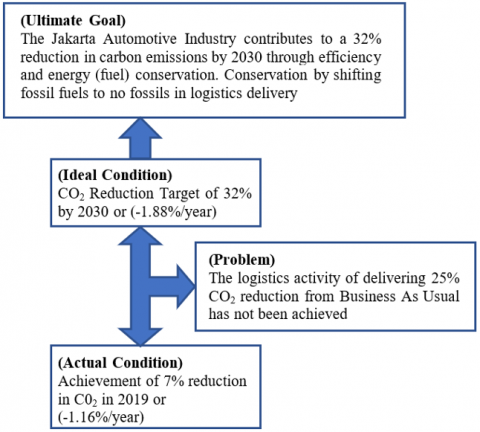
Key Performance Indicators for reducing CO2 emissions by 32% in 2030 based on the achievements in 2013 through the selection of the shortest trip, efficiency, transportation mode and eco-driving. The ideal situation is to achieve a CO2 reduction of 32% by 2030, which is equivalent to 1.88% per year. The actual achievement in 2019 was 7% or 1.16% per year. The comparison between the target and the current condition is stated as a problem, namely 25% CO2 from business as usual has not been achieved. The comparison between the target and the actual conditions is shown in Figure 3.
Figure 2. Flow logistics local part
Figure 3. Gaps from the problem of using CO2
3.1.2 Break down the problem
At this stage a case of solving the problem of not achieving carbon emission efficiency is carried out. The global target of reducing CO2 emissions by 32% by 2030 can be carried out with the packaging part efficiency program. Break down the problem will be investigated from 3 places where the problem occurs, including the logistics process for import, export and local delivery. The stages of break down the problem describe activities based on where the problem occurs, consisting of 1) Logistics of delivery import parts. 2) Logistics of delivery export parts. 3) Local part delivery logistics. Based on annual data, local part delivery logistics have significant problems to improve CO2 emissions. In 2019 and 2020 the fiscal year value did not reach the emission reduction target.
3.1.3 Set a target
At this stage, the target for improvement is determined based on the problem. Based on the initial observation data, the CO2 emission reduction program does not match the global target so that the logistics process for local part delivery is not optimal in supporting the CO2 emission reduction program. Based on the breakdown of the problem, this is a problem that must be resolved immediately. This problem needs to be followed up by identifying the stages of the process in the preparation of KPI targets. Based on initial observations, it is known that the problems that occur in local part delivery logistics have not implemented best practices in CO2 reduction, so the best target can be set to reduce CO2 gas emissions by 2.6%/ year.
3.1.4 Analysis of root cause
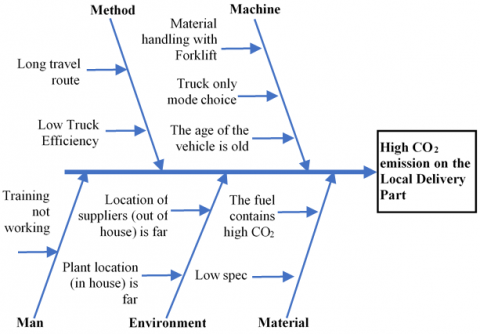
Figure 4. Fishbone diagram of high CO2 emissions on the local delivery part
At this stage, an analysis of the factors causing the problem of not achieving carbon emission efficiency. The problem of local part transportation that has not implemented the best practice must be corrected immediately by conducting a root cause analysis. The analysis stage is carried out using a fishbone diagram through a Focus Group Discussion. Factor analysis based on the cause of the problem with Man, Machine, Material, Method, and Environment (4M + 1E). The following are the results of the analysis described by the Fishbone Diagram in Figure 4. Furthermore, each root cause of the factors is described in Table 1.
3.1.5 Countermeasures plan
At this stage, an analysis of the improvement plan is carried out to increase the efficiency of carbon emissions. The improvement stage is to look for as many possible preventive actions as possible. Analyze the actions that provide the most added value. Evaluation is carried out to find the best course of action from all possible actions. This analysis is carried out by taking into account the components of safety (S), effectiveness (E), cost (C), and time (T). Based on the FGD with the parties involved, it was determined using a Likert scale, where the value of 1 = strongly disagree to 5 =strongly agree. The calculation results are as in Table 2.
3.1.6 See countermeasure through
At this stage, improvements are implemented based on the plans made in the previous stage. Improvements are made based on the largest calculation value that has the greatest impact. The FGD results show that improvements are aimed at alternative programs to increase truck efficiency. The efficiency of local part delivery logistics consists of truck efficiency and part packaging efficiency. Efficiency measures are expected to provide the greatest added value to the reduction of CO2 gas emissions. Efficiency program by increasing the quantity per pack as shown in Table 3.
Based on Table 3, the 2020 efficiency program can reduce the RE 22, RN16, DN01 and RN 15 travel routes that contribute to the reduction of CO2 emissions in detail. The reduction of the travel route can be seen in Table 4. CO2 calculation is carried out according to the following formula.
CO2 (tons) = Mileage (km) X Fuel CO2 emission index (tons/liter) X fuel efficiency (liters/km)
where, the emission factor is 0.00184301 and the truck fuel efficiency is 0.23 lt/km.
Table 1. Why-why analysis of high CO2 emissions on the local delivery part
|
Factor |
Why 1 |
Why 2 |
Why 3 |
Why 4 |
|
Machine |
Truck only mode choice |
Rail-based mode is not available yet |
The government does not provide rail-based transportation facilities |
There has been no negotiation from the company to the government |
|
Vehicle is old |
Old vehicles are still in use |
Not yet regulated in the logistics partner contract agreement |
Contact management not set up |
|
|
Material handling with a forklift |
Material handling has not used automatic mode |
|
|
|
|
Material |
The fuel contains high CO2 |
Truck fuel using biodiesel |
Not yet available |
Trial of CNG gas fuel is not yet economical |
|
Low specification |
Cost competitive |
|
|
|
|
Man |
Low truck combustion efficiency |
Knowledge driver is low |
Training has not been effective |
No training yet |
|
Methods |
Low truck efficiency |
Direct transportation |
Between payloads have not been merged |
|
|
Low part assembly density |
Efficiency evaluation is not optimal |
|
||
|
Route |
Long travel route |
Determination of the route is not optimal |
Route determination has not been carried out periodically. |
|
|
Environment |
Location of suppliers (out of house) is far |
The procurement part doesn’t consider distance |
|
|
|
Process transfer collaboration is still lacking |
|
|
||
|
Plant location (in house) is far |
The initial cost of moving the process is very large |
|
|
|
|
The limited place for automaker plant |
|
|
Table 2. Evaluate to find the best course of action
|
No |
Alternative program |
Safety |
Effectiveness |
Cost |
Time |
Score |
|
1 |
Increase truck efficiency |
5 |
3 |
5 |
5 |
375 |
|
2 |
Packaging efficiency |
5 |
3 |
5 |
5 |
375 |
|
3 |
Truck with CNG |
5 |
3 |
4 |
4 |
240 |
|
4 |
Use of biodiesel |
5 |
3 |
4 |
4 |
240 |
|
5 |
Vehicle age |
4 |
2 |
4 |
4 |
128 |
|
6 |
Loading-unloading mode with gravity. |
3 |
3 |
3 |
3 |
81 |
|
7 |
Return transportation is not used |
5 |
3 |
5 |
1 |
75 |
|
8 |
No negotiations with the government |
5 |
3 |
3 |
1 |
45 |
|
9 |
Moving production process |
5 |
5 |
1 |
1 |
25 |
Table 3. Improved loading and packaging efficiency by increasing capacity
|
No |
Efficiency activities |
UoM |
Before |
After |
Result |
|
1 |
Increases truck efficiency for carpet assembly floor load FR |
Pc |
6 |
12 |
Reduced Route RE22 from 7 to 6 trips |
|
2 |
Increase packaging efficiency on the Shield sub assembly fender splash FR RH |
Pc |
15 |
25 |
Reduced Route RN16 from 14 to 12 trips |
|
3 |
Increase truck efficiency on the Exhaust CTR pipe sub assembly pipe |
Pc |
12 |
15 |
Reduced route DN01 from 9 to 7 trips |
|
4 |
Increase truck efficiency on the Outer Dash Panel Insulator |
Pc |
40 |
80 |
Reduced Route RN15 from 7 to 6 trips |
Table 4. Route reduction program results
|
Description |
UoM |
Route RE22 |
Route RN15 |
||||
|
Before |
After |
Different |
Before |
After |
Different |
||
|
Distance |
Km |
113.5 |
113.5 |
- |
198 |
198 |
- |
|
Amount of trips/day |
Trip/day |
7 |
6 |
1.422 |
14 |
13 |
0.7 |
|
Truck fuel efficiency |
Lt/ km |
0.23 |
0.23 |
- |
0.23 |
0.23 |
- |
|
Fuel |
Lt/day |
182.7 |
145.6 |
37.1 |
637.6 |
605.7 |
31.9 |
|
CO2 emissions in 1 day |
Ton/day |
0.34 |
0.27 |
0.07 |
1.18 |
0.00 |
1.18 |
|
CO2 emissions in 1 month (21 Days) |
Ton/month |
6.9 |
5.5 |
1.40 |
24.1 |
0.0 |
24.1 |
|
CO2 emissions in 1 year (12 month) |
Ton/ year |
18.9 |
11 |
16.8 |
289.2 |
0 |
289.2 |
Table 4. Route reduction program results (continue)
|
Description |
UoM |
Route RN01 |
Route RN16 |
||||
|
Before |
After |
Different |
Before |
After |
Different |
||
|
Distance |
Km |
198 |
198 |
0 |
104 |
104 |
0 |
|
Amount of trips/day |
Trip/day |
9 |
8 |
0.935 |
7 |
6 |
0.909 |
|
Truck fuel efficiency |
Lt/ km |
0.23 |
0.23 |
0 |
0.23 |
-.23 |
0 |
|
Fuel |
Lt/day |
409.9 |
367.3 |
42.6 |
167.4 |
145.7 |
21.7 |
|
CO2 emissions in 1 day |
Ton/day |
0.76 |
0.68 |
0.08 |
0.31 |
0.27 |
0.04 |
|
CO2 emissions in 1 month (20.5 Days) |
Ton/month |
15.5 |
13.9 |
1.6 |
6.3 |
5.5 |
0.82 |
|
CO2 emissions in 1 year (12 month) |
Ton/ year |
186 |
166.8 |
19.2 |
75.6 |
0 |
75.6 |
The CO2 calculation method does not use measurements from direct fuel consumption in the field but uses the following calculations:
3.1.7 Evaluate both results and process
At this stage, an evaluation of the improvements that have been made based on implementation. The evaluation stage is carried out to determine the level of achievement of the actual conditions against the target. The results of the evaluation can be used as learning materials. The results of the evaluation are used as feedback and communicated to related parties. Evaluation of achieving CO2 emission reduction can be seen in Table 5.
After evaluating the results, several improvements were obtained. The results of this improvement are stated in a summary of the status of reducing greenhouse gases from local part delivery logistics activities which can be seen in Table 6.
3.1.8 Standardization
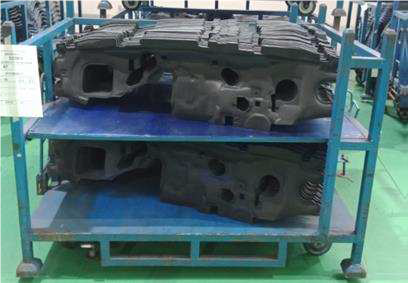
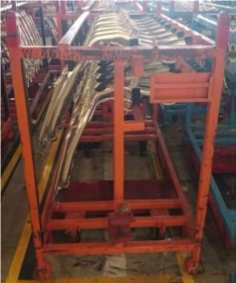
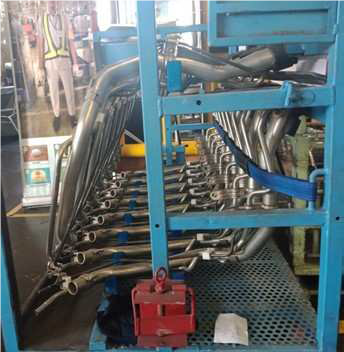
The last stage by applying standardization of improvements that have been running according to the target. This stage standardizes and publishes the improvements that have been made. The standardization carried out is by issuing new standards for transportation routes in logistics activities. The purpose of the publication is as material for standardization and continuous improvement parameters on elements of transportation activities. The publication is addressed to all team members so that problems will not recur. The standardization of successful improvements can be seen in Table 7.
3.2 Research contribution/ implication
This research provides benefits for companies related to carbon emission reduction. For similar companies, this research can be input for logistics practitioners in improving operational performance in reducing carbon emissions. By reducing carbon emissions together, it improves financial performance, especially by reducing fuel consumption. The improvements presented in this study can be a good example to be applied, developed especially in transportation logistics management in the automotive industry with multi-suppliers spread both in industrial and non-industrial areas. Ultimately, improvements can support the company's sustainable and environmentally friendly business.
The results show that carbon emissions have been successfully reduced from a reduction ratio of 44.2% or an increase in efficiency compared to the previous year. Although the results obtained have decreased, these results have not reached the target expected by the automotive industry. But the results of this study have brought the automotive industry towards CO2 efficiency. To get maximum results, the automotive industry needs to carry out a series of continuous improvements to achieve the expected target. This paper has shown that carbon emission efficiency has the potential to be implemented in all manufacturing industries, especially in the logistics transportation sector. This is done as an effective and efficient way to reduce CO2, be environmentally friendly and towards sustainable manufacturing.
Table 5. Evaluation of achieving CO2 emission reductions
|
No |
CO2 Reduction Activities |
Semester 1 (Apr 2019 - Mar 2020) |
Semester 2 (Apr 2020 - Mar 2021) |
Contribution to total reduction (%) |
||
|
Results (ton) |
Cost-saving (USD) |
Results (ton) |
Cost-savings (USD) |
|||
|
1 |
Eliminate the RE22 route by increasing truck efficiency on the FR carpet assembly floor |
5.06 |
27,803 |
5 |
27,803 |
2% |
|
2 |
Eliminate RN16 Route by increasing packing efficiency on Shield sub assembly fender splash FR RH (from 15 to 25 pc) |
16.90 |
15,569 |
17 |
15,569 |
6% |
|
3 |
Eliminate DN01 Route by increasing packaging efficiency on Exhaust CTR sub assembly pipe (from 12 to 15 pc) |
14.99 |
20,407 |
15 |
20,407 |
6% |
|
4 |
Eliminates Route RN 15 by increasing packing efficiency on Outer Dash Panel Insulators (from 40 to 80 pc) |
5.79 |
5,985 |
10 |
10,260 |
2% |
Table 6. Summary reduction of CO2
|
Fuel Type |
Energy Consumption |
UoM |
2018 |
2019 |
2020 |
|
Fuel Consumption |
Transportation |
LT |
2,689,421 |
2,360,313 |
1,664,346 |
|
Material handling |
LT |
3,250 |
3,250 |
3,250 |
|
|
Total Biodiesel Usage |
LT |
2,692,671 |
2,363,563 |
1,667,596 |
|
|
Production Quantity (n) |
Unit |
221,726 |
176,576 |
124,582 |
|
|
Total CO2 produced (a) |
Ton |
4,963 |
4,356 |
3,073 |
|
|
Hasil Absolut penurunan CO2 (c) |
Ton |
145 |
267 |
271 |
|
|
Intensity of CO2 (a/n) |
Ton/Unit |
0.0224 |
0.00151 |
0.00218 |
|
|
Reduction Ratio of CO2 (R = c / a) |
% |
2.9% |
6.1% |
8.8% |
|
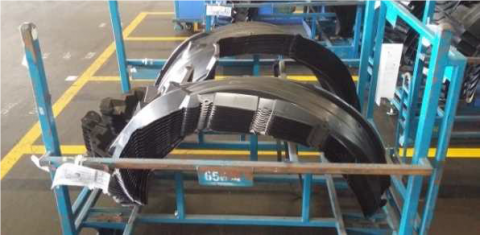
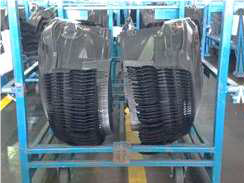
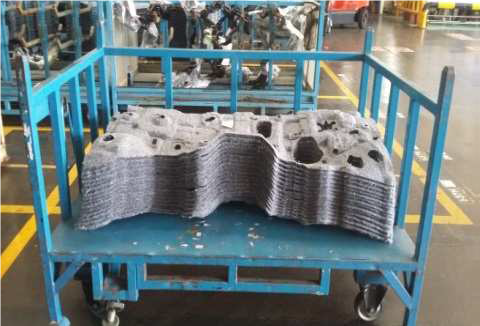
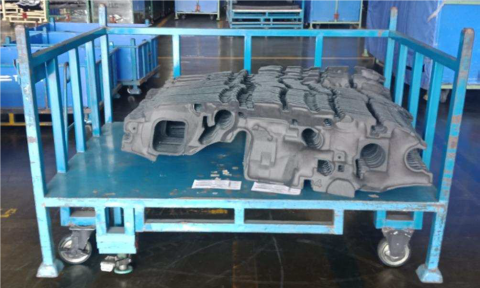
Table 7. Standardization of improvement
|
Improvement |
Standardization |
||
|
Parameter |
Before |
After |
|
|
Preparation of shield sub assembly fender splash front right (Route RN16) |
Figure |
||
|
Dimension |
1500 x 1100 x 1050 |
1500 x 1100 x 1050 |
|
|
Quantity/pallet |
15 units |
25 units |
|
|
Efficiency |
75% |
95% |
|
|
KPI m3/units |
0.057 |
0.034 |
|
|
Dash Panel Insulator Setup (Route RN15) |
Figure |
||
|
Dimension |
1700 x 1100 x 1100 |
1700 x 1100 x 1100 |
|
|
Quantity/pallet |
16 unit |
22 unit |
|
|
Efficiency |
85% |
100% |
|
|
KPI m3/units |
0.126 |
0.094 |
|
|
Preparation of Sheet FOR Floor Silencer (Route RN15) |
Figure |
||
|
Dimension |
1600 x 1000 x 1175 |
1600 x 1000 x 1175 |
|
|
Quantity/pallet |
40 units |
80 units |
|
|
Efficiency |
50% |
100% |
|
|
KPI m3/units |
0.47 |
0.0235 |
|
|
Preparation of pipe sub assembly exhaust set CTR (Route DN05) |
Figure |
||
|
Dimension |
445 x 705 x 1175 |
1445 x 705 x 1175 |
|
|
Quantity/pallet |
16 pcs |
24 pcs |
|
|
Layers |
2 |
3 |
|
|
Efficiency |
75 |
90 |
|
|
KPI m3/units |
0.075 |
0.049 |
|
In future research, an analysis of carbon emission reduction in overall logistics transportation can be carried out so that complex results can be obtained.
[1] Namukasa, J., Namagembe, S., Nakayima, F. (2020). Fuel efficiency vehicle adoption and carbon emissions in a country context. International Journal of Global Sustainability, 4(1): 1-21. https://doi.org/10.5296/ijgs.v4i1.16227
[2] Trinks, A., Mulder, M., Scholtens, B. (2020). An efficiency perspective on carbon emissions and financial performance. Ecological Economics, 175: 106632. https://doi.org/10.1016/j.ecolecon.2020.106632
[3] Lu, Y., Li, M. (2020). Industrial carbon emission efficiency in the YANGTZE river economic belt and its influencing factors. International Journal of Design & Nature and Ecodynamics, 15(1): 25-32. https://doi.org/10.18280/ijdne.150104
[4] Akinyemi, T.O., Ramonu, O.J. (2019). Mitigation of CO2 emissions in transportation and industrial processes using renewable energy technologies. European Journal of Engineering and Technology Research, 4(5): 58-66. https://doi.org/10.24018/ejers.2019.4.5.1118
[5] Tatar, V., Özer, M.B. (2018). The impacts of CO2 emissions from maritime transport on the environment and climate change. International Journal of Environmental Trends (IJENT), 2(1): 5-24.
[6] Aldaihani, N., Alenezi, R. (2017). Estimation of CO2 emissions of the vehicles transport sector in the State of Kuwait. Acta Chemica Malaysia, 1(1): 8-12. https://doi.org/10.26480/acmy.01.2017.08.12
[7] Gillingham, K., Stock, J.H. (2018). The cost of reducing greenhouse gas emissions. Journal of Economic Perspectives, 32(4): 53-72. https://doi.org/10.1257/jep.32.4.53
[8] Yang, F., Shi, B., Xu, M., Feng, C. (2019). Can reducing carbon emissions improve economic performance? Evidence from China. Economics, 13(47): 1-39. http://dx.doi.org/10.5018/economics-ejournal.ja.2019-47
[9] Salam, M.A., Khan, S.A. (2016). Simulation based decision support system for optimization: A case of Thai logistics service provider. Industrial Management & Data Systems, 116(2): 236-254. https://doi.org/10.1108/IMDS-05-2015-0192
[10] Wei, D. (2020). Modeling and simulation of a multi-agent green supply chain management system for retailers. Journal Européen des Systèmes Automatisés, 53(4): 549-557. https://doi.org/10.18280/jesa.520213
[11] Xu, Y., Wang, Z., Chiu, Y.H., Ren, F. (2020). Research on energy-saving and emissions reduction efficiency in Chinese thermal power companies. Energy & Environment, 31(5): 903-919. https://doi.org/10.1177/0958305X19882375
[12] Skowron, A., Lee, D.S., De León, R.R., Lim, L.L., Owen, B. (2021). Greater fuel efficiency is potentially preferable to reducing NOx emissions for aviation’s climate impacts. Nature Communications, 12(1): 564. https://doi.org/10.1038/s41467-020-20771-3
[13] Dong, G., Wang, Z., Mao, X. (2018). Production efficiency and GHG emissions reduction potential evaluation in the crop production system based on emergy synthesis and nonseparable undesirable output DEA: A case study in Zhejiang Province, China. PloS One, 13(11): e0206680. https://doi.org/10.1371/journal.pone.0206680
[14] Zhao, Y., Xue, Q., Zhang, X. (2018). Stochastic empty container repositioning problem with CO2 emission considerations for an intermodal transportation system. Sustainability, 10(11): 4211. https://doi.org/10.3390/su10114211
[15] Thalmann, P., Vielle, M. (2019). Lowering CO2 emissions in the Swiss transport sector. Swiss Journal of Economics and Statistics, 155(1): 10. https://doi.org/10.1186/s41937-019-0037-3
[16] Gabrielle, Toly, A.A. (2019). The effect of greenhouse gas emissions disclosure and environmental performance on firm value: Indonesia evidence. Jurnal Ilmiah Akuntansi dan Bisnis, 14(1): 106-119. https://doi.org/10.24843/JIAB.2019.v14.i01.p10
[17] Hodžić, N., Metović, S., Kazagic, A. (2018). Effects on NOX and SO2 emissions during co-firing of coal with woody biomass in air staging and reburning. International Journal of Renewable Energy Development, 7(1): 1-6. https://doi.org/10.14710/ijred.7.1.1-6
[18] Chen, Y., Han, Y., Zhu, Q. (2017). Energy and environmental efficiency evaluation based on a novel data envelopment analysis: An application in petrochemical industries. Applied Thermal Engineering, 119: 156-164. https://doi.org/10.1016/j.applthermaleng.2017.03.051
[19] Hertwich, E.G., Ali, S., Ciacci, L., Fishman, T., Heeren, N., Masanet, E., Asghari, F.N., Olivetti, E., Pauliuk, S., Tu, Q., Wolfram, P. (2019). Material efficiency strategies to reducing greenhouse gas emissions associated with buildings, vehicles, and electronics-a review. Environmental Research Letters, 14(4): 043004. https://doi.org/10.1088/1748-9326/ab0fe3
[20] Le, S., Jeffrey, S., An, H. (2020). Greenhouse gas emissions and technical efficiency in Alberta dairy production: what are the trade-offs? Journal of Agricultural and Applied Economics, 52(2): 177-193. https://doi.org/10.1017/aae.2019.41
[21] Liker, J.K., Meier, D. (2006). The Toyota Way Fieldbook: A Practical Guide for Implementing Toyota’s 4Ps. Bok-McGraw-Hill Professional.
[22] Marksberry, P., Bustle, J., Clevinger, J. (2011). Problem solving for managers: A mathematical investigation of Toyota's 8‐step process. Journal of Manufacturing Technology Management, 22(7): 837-852. https://doi.org/10.1108/17410381111160924
[23] Utama, A.Y., Supriyatna, H., Kusuma, R.D.P. (2020). Quality control analysis of candy wrapping process using the QCC (quality control circle) method in the candy industry Indonesian. International Journal of Innovative Science and Research Technology, 5(1): 297-309.
[24] Darmawan, H., Hasibuan, S., Purba, H.H. (2018). Application of Kaizen concept with 8 Steps PDCA to reduce in line defect at pasting process: A case study in automotive battery. Int. J. Adv. Sci. Res. Eng, 4(8): 97-107. https://doi.org/10.31695/IJASRE.2018.32800
[25] Garza-Reyes, J.A., Villarreal, B., Kumar, V., Molina Ruiz, P. (2016). Lean and green in the transport and logistics sector–a case study of simultaneous deployment. Production Planning & Control, 27(15): 1221-1232. https://doi.org/10.1080/09537287.2016.119743