Xiang Huang | Pengxiang Huang* | Tianxiang Huang
© 2020 IIETA. This article is published by IIETA and is licensed under the CC BY 4.0 license (http://creativecommons.org/licenses/by/4.0/).
OPEN ACCESS
Smart cities mark the shift from the traditional model of urban construction to the planned construction of a composite system between smartness and energy. Considering the defects of renewable energies, e.g., intermittency, randomness, and low dispatchability, it is imperative to explore the digital and unified management of urban renewable energies. Therefore, this paper presents a multi-objective optimization algorithm for digital management, which can quantify the multiple energy models of smart cities. Firstly, the dimensions of renewable energy construction in smart cities were detailed, and the functions, hierarchy, and data flows of the digital management system for renewable energies were plotted in turn. After that, the output probability models of typical renewable energy power generation systems were established, plus the objective functions of digital management for renewable energies. Finally, particle swarm optimization (PSO) was combined with genetic algorithm (GA) for multi-objective optimization of the digital management for renewable energies in smart cities. The proposed models and algorithm were proved effective through experiments.
smart city, renewable energy, digital management, multi-objective optimization
Urbanization is picking up speed in China, posing multiple challenges to urban environment, energy, and transportation. In 2019, the cities accounted for more than 75% of energy consumed across China. This proportion is expected to surpass 80% in 2029 [1-6]. To balance urban development with environment protection and energy consumption, it is necessary to complete the shift from the traditional model of urban construction to the planned construction of a composite system between smartness and energy, along with the rise of smart cities. This helps to reduce environmental pollution and energy consumption, and realize the harmonious and sustainable development of man and nature. There are four defining features of smart cities: comprehensive and thorough perception, ubiquitous broadband interconnection, intelligently fused applications, and people-oriented sustainable innovation [7-11].
The traditional thermal power generation goes against China’s pursuit of energy conservation and emission reduction. As a pollution-free and sustainable strategy of power generation, renewable energy power generation has gradually won the recognition by the public [12-16]. However, renewable energies face such defects as intermittency, randomness, and low dispatchability. Therefore, the reasonable management of urban renewable energies has become a research focus. Further research is needed to solve the digitization and unified management of various information on energy consumption.
Many scholars have conducted fruitful research into energy management of smart cities [17-20]. Hussain et al. [21] reviewed the status quo of the digital transform of China’s oil and gas industry, summarized the problems in the development of the traditional energy industry, i.e., limited capability of research and development (R&D), uneven levels of informatization, information redundancy and resource waste, and emphasis on development over operation and maintenance, and suggested promoting the digital transform of modern energy industry chain through Internet of Things (IoT) Platform Plus and Energy Business Type Plus. Conrads [22] highlighted the importance of modern digital information processing technology in the construction of smart cities, and hailed the technology as the primary means to monitor, analyze, and integrate the data on the supply and consumption of public resources, and to make intelligent response across the entire city. To realize the real-time transmission and interconnection of various types of energy data, Palasciano et al. [23] proposed to plan and construct the infrastructure and service system of smart cities in five aspects: economy, environment, transportation, residents, and government.
In addition, Tehrani et al. [24] pointed out that the digital energy management system can analyze the energy supply and consumption of industrial automation equipment, and optimize the plan for energy distribution and dispatch, thereby reducing the energy consumption and emissions in discrete and process manufacturing. Rizoug et al. [25] explained the concept of the energy Internet, and stressed that the smart grid can promote the deep integration between energy and information through horizontal and vertical adjustments, namely, multi-source complementation and source-network-load-storage coordination. Gholami et al. [26] applied narrowband-IoT (NB-IoT) to urban smart energy management, and integrated the levels of smart energy applications under the cloud-management-terminal architecture; the integration strategy breaks through the conventional metering and service model of various energy industries, such as water, electricity, gas, and heating, and realizes real-time monitoring of consumption and timely processing of state and control information. Zemlick et al. [27] introduced the goal of integrated cost management, i.e., minimizing the comprehensive cost of renewable energy enterprises, based on the overall design of construction cost, production and operation cost, and environmental and social cost, and detailed the cost control measures centering on digitalization, intelligence, and networking in the construction phase.
The multiple objectives, variables, and constraints complicate the nonlinear optimization of the renewable energy management. The relevant literature on smart cities mostly concentrates on the implementation of low-carbon, clean, and energy-saving measures. There is little report on the economic dispatch models and optimization algorithms of energies in smart cities. The lack of relevant research tarnishes the smartness of smart cities. To solve the problem, this paper puts forward a multi-objective optimization algorithm for digital management, which can quantify the multiple energy models in smart cities.
The rest of this paper is arranged as follows: Section 2 introduces the dimensions of renewable energy construction in smart cities, analyzes the functions of the proposed digital management system for renewable energies, and plots the hierarchy, and data flows of the system; Section 3 constructs the output probability models of two typical renewable energy power generation systems, including photovoltaic (PV) power generation and wind power generation, and sets up the objective functions for the digital management of renewable energies; Section 4 combines particle swarm optimization (PSO)c with genetic algorithm (GA) for multi-objective optimization of the digital management for renewable energies in smart cities; Section 5 verifies the effectiveness of the proposed models, objective functions, and algorithm through experiments; Section 6 puts forward the conclusions.
In smart cities, the renewable energy construction covers the development and utilization, production and consumption, as well as recovery of renewable energies. To ease the pressure on energy supply and environmental pollution, the fundamental strategy is to make rational use of renewable clean energies, and construct a novel digital management system for renewable energies, which supports sustainable development of environment, society, and economy. These efforts could elevate energy efficiency, rationalize consumption structure, and promote the harmonious development of smart cities. The renewable energy construction of smart cities mainly covers four aspects, namely, the utilization of renewable energies, the management of energy demand, the promotion of electric vehicles, and the on-demand transform of heating supply. Among them, the key aspects are the utilization of renewable energies, and the management of energy demand.
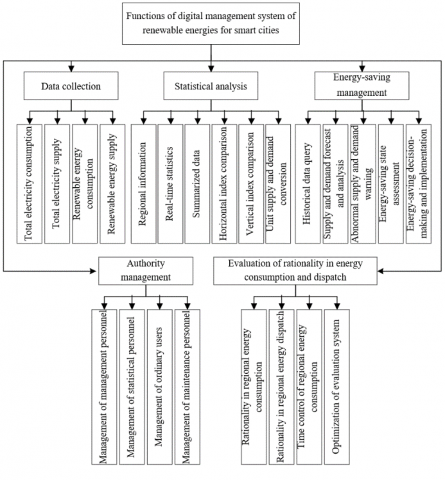
Figure 1. The functions of the digital management system of renewable energies for smart cities
PV power generation and wind power generation are the main sources of renewable energies for smart cities. The distributed power generation of renewable energies breaks through the various limitations on traditional ground-based power stations, and makes full use of the geographical advantages in the collection of solar power and wind power. In smart cities, the households that install renewable energy power generation systems are self-sufficient in household power. The surplus electricity could be sold to the State Grid to increase household income. To balance the energy supply and demand in smart cities, it is necessary to innovate and apply digital and information technologies, improve the quality of demand-side business and service, and support the unified management of supply-demand balance for electrical and thermal energies, on the basis of a sound demand response and management system for such energies.
This paper proposes a digital management system of renewable energies for smart cities. In the system, the data on energy consumption and supply are collected by smart meters and sensor networks. The collected data are transmitted and stored by network switches, GPRS (General Packet Radio Service) access points, and network servers. Based on the management system software, the user terminal realizes the query of energy consumption and supply, as well as the control, operation, and monitoring of related devices.
As shown in Figure 1, the proposed system has five main functions, namely, authority management, data collection, statistical analysis, energy-saving management, and evaluation of rationality in energy consumption and dispatch. Specifically, authority management involves the management of the authorities of management personnel, statistical personnel, ordinary users, and maintenance personnel. Data collection and statistical analysis aim to gather and analyze the regional consumption and supply of energies, including renewable energies, in real time. Energy-saving management covers such aspects as supply and demand forecast and analysis, abnormal supply and demand warning, energy-saving state assessment, and energy-saving decision-making and implementation. Evaluation of rationality in energy consumption and dispatch evaluates the rationality of regional energy consumption and dispatch based on a scientific evaluation index system in a comprehensive manner.
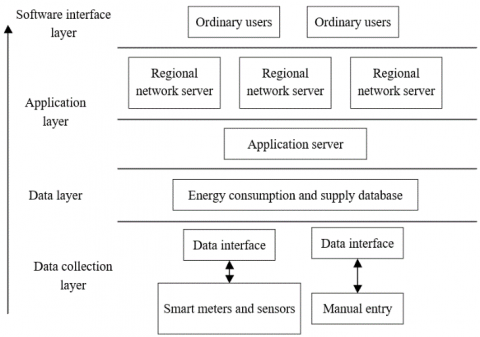
Figure 2. The hierarchy of the digital management system of renewable energies for smart cities
As shown in Figure 2, the proposed system consists of four layers: data collection layer, data layer, application layer, and software interface layer. The data flows in the system are illustrated in Figure 3.
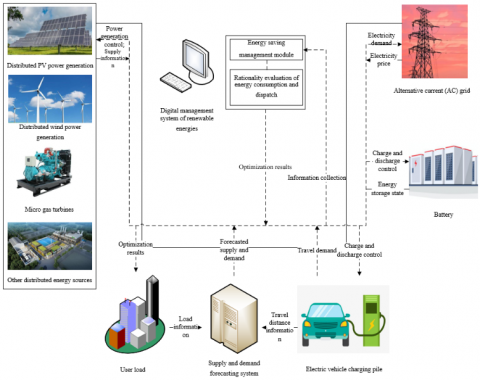
Figure 3. The data flows of the digital management system of renewable energies for smart cities
3.1 Probabilistic models of renewable energy output
The stochasticity of energy demand should be modeled to reveal how the randomness of the energy demand side of smart cities affects the digital management of renewable energy supply systems. Based on the probability distribution of environmental conditions, this paper constructs the probabilistic output models of the power generation by two typical renewable energies: PV and wind power.
The output of PV power generation changes randomly with sunlight intensity. Let I*(t) be the maximum sunlight intensity in period t. Drawing on the law of massive statistics, the sunlight intensity It in period t can be approximated as the beta probability distribution:
$B(I(t))=\frac{\Phi(a+b)}{\Phi(a) \Phi(b)}\left(\frac{I(t)}{I^{*}(t)}\right)^{a-1}\left(1-\frac{I(t)}{I^{*}(t)}\right)^{b-1}$ (1)
where, a and b characterize the shape of beta probability distribution. The values of a and b can be calculated as the mean and variance of It, respectively:
$\left\{ \begin{matrix} a=\bar{I}(t)\left( \frac{\bar{I}(t)\left( 1-\bar{I}(t) \right)}{\delta _{I}^{2}}-1 \right) \\ b=\left( 1-\bar{I}(t) \right)\left( \frac{\bar{I}(t)\left( 1-\bar{I}(t) \right)}{\delta _{I}^{2}}-1 \right) \\\end{matrix} \right.$ (2)
The output PP(t) of PV power generation equals the product of photoelectric conversion efficiency and PV array area. The probability density can be derived from the distribution of sunlight intensity:
$B({{P}_{P}}(t))=\frac{\Phi (a+b)}{\Phi (a)\Phi (b)}{{\left( \frac{{{P}_{P}}(t)}{P_{P}^{*}(t)} \right)}^{a-1}}{{\left( 1-\frac{{{P}_{P}}(t)}{P_{P}^{*}(t)} \right)}^{b-1}}$ (3)
The expectation and variance of the output of PV power generation can be respectively calculated by:
$E({{P}_{P}}(t))=\frac{a}{a+b}P_{P}^{*}(t)$ (4)
$D(P_{P}^{2}(t))=\frac{a(a+1)}{(a+b)(a+b+1)}{{\left( P_{P}^{*}(t) \right)}^{2}}$ (5)
The output power of wind power generation changes randomly with wind speed. Suppose the wind speed s at time t satisfies the Rayleigh distribution:
$\left\{ \begin{matrix} R(s)=\frac{s}{\delta _{W}^{2}}{{e}^{-\frac{{{s}^{2}}}{2\delta _{W}^{2}}}} \\ \delta _{W}^{2}={{(\frac{\pi }{2})}^{-\frac{1}{2}}}s \\\end{matrix} \right.$ (6)
The output PW(t) of wind power generation can be approximated by a first-order model. Its probability density can be calculated from the distribution of wind speed. Let sci, sco, and sr be the cut-in wind speed, cut-out wind speed, and rated wind speed of the turbine, respectively; Pwr be the rated power of the turbine. Then, the expectation of the output of wind power generation can be calculated by:
$E\left(P_{W}(t)\right)=\frac{P_{W r}}{S_{r}-S_{c i}}\left[\begin{array}{c}
\sqrt{2 \pi} \delta_{W}\left(\Gamma\left(\frac{s_{r}}{\delta_{W}}\right)-\Gamma\left(\frac{s_{c i}}{\delta_{W}}\right)\right) \\
+s_{c i} e^{-\frac{s_{c i}^{2}}{2 \delta_{i}^{2}}}-s_{r} e^{-\frac{s_{r}^{2}}{2 \delta_{\pi}^{2}}}
\end{array}\right]$ $-\frac{P_{W r} \cdot S_{c i}}{s_{r}-s_{c i}}\left[e^{-\frac{s_{r}^{2}}{2 \delta_{W}^{2}}}-e^{-\frac{s_{c i}^{2}}{2 \delta_{W}^{2}}}\right]$ $-P_{W r}\left[e^{-\frac{s_{c o}^{2}}{2 \delta_{W}^{2}}}-e^{-\frac{s_{r}^{2}}{2 \delta_{W}^{2}}}\right]$ (7)
where, Γ(*) is the Gaussian distribution function. The values of parameters in (7) can be obtained empirically based on massive statistics.
Figure 4. The optimization system for the hybrid energy network in smart cities
3.2 Objective functions of the digital management of renewable energies
During the digital management of renewable energies for smart cities, there might be exchanges between renewable and non-renewable energies. Figure 4 illustrates the optimization system for the hybrid energy network in smart cities. Specifically, PV power generation and wind power generation both consume renewable clean energies; the battery that stabilizes and stores the electricity outputted by the renewable energies does not consume any energy. Hence, the above three units do not incur fuel cost, depreciation cost, maintenance cost, or environmental cost during energy dispatch and management. On the contrary, gas turbines and fuel cells consume a certain amount of fuel, and produce waste gas that pollutes the environment, during the generation of electricity and heat. As a result, the energy dispatch and management of these two units involve fuel cost, depreciation cost, maintenance cost, and environmental cost. Considering the environment of smart cities, economic benefits, and the operating cost of the hybrid energy network, the digital management objectives of renewable energies for smart cities can be established as follows.
(1) Minimizing the operating cost of the hybrid energy network
The minimum cost can be calculated by:
$\min Q_{G}=\sum_{t=1}^{N c}\left(Q_{F}(t)+Q_{M}(t)+Q_{D}(t)+Q_{c}(t)+\lambda Q_{I}(t)-Q_{H}(t)\right)$ (8)
where, QG is the operating cost of the hybrid energy network; NC is the number of cycles of energy dispatch; λ is the operating cost coefficient generated when the network uses renewable energies. If the renewable energy power generation unit supplies power to the AC grid (i.e., in the grid-connected state), λ=1; if the unit is self-sufficient (i.e., in the isolated state), λ=0. In the t-th dispatch cycle, the fuel cost of the hybrid energy network can be calculated by:
${{Q}_{F}}(t)=\frac{\sum\limits_{i=1}^{{{N}_{U}}}{{{c}_{F}}}}{NV}\cdot \sum\limits_{i=1}^{{{N}_{u}}}{\frac{{{P}_{i}}(t)}{{{\tau }_{i}}(t)}}$ (9)
where, i and NU are the serial number and total number of the units being managed; cF(t) is the unit price of fuel; NV is the net calorific value of the fuel; Pi(t) and τi(t) are the output power and fuel utilization of the i-th unit in the t-th dispatch cycle, respectively. The operation and maintenance cost QM(t) of the network can be calculated by:
${{Q}_{M}}(t)=\sum\limits_{i=1}^{{{N}_{U}}}{{{\rho }_{i}}}{{P}_{i}}(t)$ (10)
where, ρi is the operation and maintenance coefficient, when the i-th unit is working normally. In the t-th dispatch cycle, the depreciation cost QD(t) of the i-th unit can be calculated by:
${{Q}_{D}}(t)=\sum\limits_{i=1}^{{{N}_{U}}}{\frac{{{c}_{I}}\frac{\gamma {{(1+\gamma )}^{y}}}{{{(1+\gamma )}^{y}}-1}y}{8760{{P}_{ri}}{{\zeta }_{i}}}{{P}_{i}}(t)}$ (11)
where, Pri, ζi, and cI are the rated power, capacity factor, and installation cost of the i-th unit, respectively; y is the number of years of network operation; γ is the interest rate of the depreciation cost. In the t-th dispatch cycle, the compensation cost QC(t) generated by the load shedding of the hybrid energy network can be calculated by:
${{Q}_{C}}(t)={{c}_{L}}\cdot L(t)$ (12)
where, cL is the loss cost that the hybrid energy network needs to pay to the user in the event of a power outage; L(t) is the size of the load shedding in the t-th dispatch cycle. When the renewable energy power generation unit is in the grid-connected state, the interaction cost QI(t) of energy exchanges can be calculated by:
${{Q}_{I}}(t)={{c}_{b}}(t)\times {{q}_{b}}(t)-{{c}_{s}}(t)\times {{q}_{s}}(t)$ (13)
where, cb(t), and qb(t) are the purchase price and purchase quantity of the renewable energy power generation unit from the AC grid in the t-th dispatch cycle, respectively; cs(t), and qs(t) are the selling price and sold quantity of the renewable energy power generation unit from the AC grid in the t-th dispatch cycle, respectively. In the t-th dispatch cycle, the heat production revenue QH(t) of the gas turbine can be calculated by:
$Q_{H}(t)=H L \cdot c_{h}$ (14)
where, HL, and ch are the heat load demand, and the unit selling price of heat in that cycle, respectively.
(2) Maximizing the environmental benefits of the hybrid energy network
$\min {{Q}_{P}}=\sum\limits_{t=1}^{{{N}_{C}}}{(\sum\limits_{v=1}^{V}{{{10}^{-3}}}{{c}_{v}}(\sum\limits_{i=1}^{{{N}_{U}}}{{{\beta }_{iv}}{{P}_{i}}}(t)+\varepsilon {{\beta }_{Gv}}{{q}_{s}}(t))})$ (15)
where, QP is the environmental protection cost of the hybrid energy network; ε is the environmental protection cost coefficient (if the renewable energy power generation unit is in the isolated state, ε=0; if the unit is in the grid-connected state, ε=1; in the latter case, the unit might exchange and transfer energy with the AC grid, and the environmental protection cost of each unit in the hybrid energy network needs to be calculated separately); v is the serial number of environmental protection projects; cv is the cost of the v-th environmental protection project; βiv is the cumulative cost coefficient of the v-th environmental protection project in the power generated by the i-th unit; βGv is the cumulative cost coefficient of the v-th environmental protection project in the power generated in the hybrid energy network.
A total of six constraints were designed for the above objectives. The power balance of the hybrid energy network was constrained by:
$\sum\limits_{i=1}^{{{N}_{U}}}{{{P}_{i}}(t)+{{P}_{G}}(t)+{{P}_{B}}(t)={{P}_{L}}(t)-L(t)}$ (16)
It can be seen from (16) that, in the t-th dispatch cycle, the sum of the total output power of each unit, the energy exchange power PG(t) between the renewable energy generating unit and the AC grid, and the power PB(t) of the battery equals the difference between the load power demand PL(t) of the hybrid energy network and the load shedding power L(t). The upper and lower output powers of each unit were constrained by:
$P_{\min i} \leq P_{i}(t) \leq P_{\max i}$ (17)
where, Pmini, and Pmaxi are the upper and lower limits on the i-th unit respectively. The ramp rate of the output power of each unit was constrained by:
$\left\{ \begin{align} & {{P}_{i}}(t)-{{P}_{i}}(t-1)\le L{{V}_{Ui}}\text{ }Gradually\text{ }increasing\text{ }load \\ & {{P}_{i}}(t\text{-}1)-{{P}_{i}}(t)\le L{{V}_{Di}}\text{ }Gradually\text{ }decreasing\text{ }load \\\end{align} \right.$ (18)
where, LVUi, and LVDi are the upper limits on the increase and decrease of the output power of the i-th unit between adjacent dispatch cycles, respectively. The energy exchange power between the renewable energy power generation unit and the AC grid was constrained by:
$P_{\min G}^{{}}\le {{P}_{G}}(t)\le P_{\max G}^{{}}$ (19)
where, PminG, and PmaxG are the upper and lower limits on the allowable exchange power between the renewable energy power generation unit and the AC grid. The operation of the battery was constrained by:
$\left\{ \begin{matrix} {{P}_{\min B}}\le {{P}_{B}}(t)\le {{P}_{\max B}} \\ {{S}_{\min B}}\le {{S}_{B}}(t)\le {{S}_{\max B}} \\ \sum\limits_{t=1}^{{{N}_{C}}}{\left| {{\varphi }_{B}}(t+1)-{{\varphi }_{B}}(t) \right|}\le L{{V}_{B}} \\\end{matrix} \right.$ (20)
where, PminB, and PmaxB are the lower and upper limits on the charging power of the battery per unit time, respectively; SminB, and SmaxB are the limit and upper limits of the state of charge (SOC) of the battery, respectively; ϕB(t) is the state of the battery in the t-th dispatch cycle (if the battery is in the charging state, ϕB(t)=0; if the battery is in the discharging state, ϕB(t)=1); LVB is the upper limit on the number of charging/discharging of the battery in NC dispatch cycles.
To protect the normal operation of the hybrid energy network against the instability of the output power of the renewable energy power generation unit, the spinning reserve capacity was constrained by:
$\sum\limits_{i=1}^{{{N}_{U}}}{P_{\max i}^{{}}}\ge {{P}_{L}}(t)+{{P}_{L}}(t)\cdot d%+{{P}_{\Sigma r}}(t)\cdot {{\xi }_{PW}}%$ (21)
where, d%, and ξPW% are the demand coefficients of the electrical load and the renewable energy power generation unit for reserve capacity, respectively; PΣr(t) is the sum of the rated capacities of the PV power generation unit and the wind power generation unit in the t-th dispatch cycle.
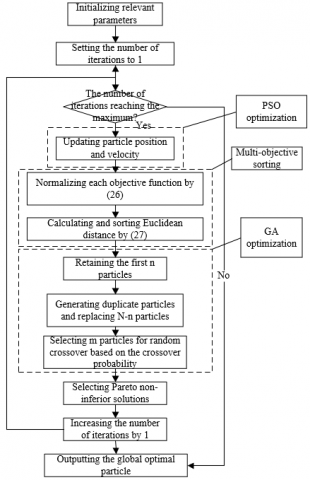
It is a complex problem to realize the digital management of renewable energies for smart cities. Here, the PSO is combined with GA to optimize the multiple objectives of the problem. The workflow of the hybrid algorithm is explained in Figure 5.
The traditional PSO faces two deficiencies: the proneness to premature convergence, and the decline in solution diversify with the growing number of iterations. Despite a low solving efficiency, the GA can greatly diversify the solutions through crossover and mutation. Therefore, the two algorithms can be combined to make up their respective defects, while improving population diversity and convergence quality.
Figure 5. The workflow of the multi-objective optimization algorithm based on PSO and GA
As shown in Figure 5, the particles of the swarm are resorted by fitness in each iteration. The position and velocity of the last Nn particles are replaced by those of the top-n particles. After each iteration, the best-known values of all particles can be obtained. Next, the crossover probability of each particle is calculated by the crossover theory of the GA. The selected m particles are placed in the crossover pool for random pairwise crossover. The parent particles are replaced with offspring particles. The position of offspring particles can be obtained by the crossover of that of parent particles:
$C(p)=\eta \cdot {{M}_{1}}(p)+(1-\eta )\cdot {{M}_{2}}(p)$ (22)
where, η is a random number in [0, 1]. The velocity of offspring particles can be calculated by:
$C(s)=\frac{{{M}_{1}}(s)+{{M}_{2}}(s)}{\left| {{M}_{1}}(s)+{{M}_{2}}(s) \right|}\left| {{M}_{1}}(s) \right|$ (23)
Weight method and vector evaluation method are common optimization methods for multi-objective problems. However, the optimization results of the fixed weight method, a typical weight method, relies too much on the preset weights; the dynamic weighting method is too complex; the vector evaluation method only converges to the local optimums.
For the multi-objective optimization problem of the digital management of renewable energies for smart cities, the key is to reasonably evaluate and select the fitness. Here, the Pareto dominance between particles is chosen to solve each objective function, such that the optimization direction of the Pareto optimal set is consistent with that of the swarm. In this way, the differences between multiple objectives in the problem can be overcome. Suppose each particle p in the external set Ω' satisfies:
${{f}_{{{\Omega }'}}}(p)=\frac{{{N}_{\text{cover}}}}{{{N}_{P}}+1}$ (24)
where, Np is the total number of particles in the swarm; Ncover is the number of particles in the swarm replaced by particle p based on Pareto dominance. The particles p in the current set of particles Ω satisfies:
${{f}_{P}}(q)=\left[ 1+\sum\limits_{p,p\text{}q}^{{{N}_{P}}}{{{f}_{{{P}'}}}(p)} \right]+\frac{1}{(2+\theta _{q}^{l})}$ (25)
where, θql is the distance between particle q and the l-th nearest neighbor particle. Observation shows that (25) consists of two parts: the basic fitness that characterizes the Pareto dominance between particles, and the superimposed fitness that characterizes the distance between particles. If p is greater than q, then p is better than q, and q will be replaced by p.
After forming the Pareto non-inferior solution set, it is necessary to select a global optimal particle that best fits the current demand from all non-inferior solutions as the optimal solution. The sorting of non-inferior solutions could be affected by the demand and management objectives of the digital management of renewable energies for smart cities. Before computing the Euclidean distance between each non-inferior solution vector and the optimal solution, the dimensions and magnitudes of different objective functions must be normalized by:
${Q}'=\frac{Q-{{Q}_{\min }}}{{{Q}_{\max }}-{{Q}_{\min }}}$ (26)
where, Q, and Q' are the true value and normalized value of each objective function, respectively; Qmax, and Qmin are the upper and lower limits of objective function value, respectively. After normalization, the Euclidean distance can be calculated by:
$\begin{aligned}
d\left(p_{o p t}\right)=\left[\left(Q_{T C}(\right.\right.&\left.p_{o p t}\right) \\
&-Q 2\left(Q_{o c}\left(p_{o p t}\right)\right.\\
&\left.\left.-Q_{o c \min }()_{I C_{o p t}}^{2} 1 / 2_{I C \min }\right)_{T C \min }\right]
\end{aligned}$ (27)
This paper establishes an optimization model for hybrid energy network of smart cities in MATLAB. The rated powers of PV power generation and wind power generation were set to 60kW and 200kW, respectively; the battery capacity per unit area of power supply was configured as half of the peak power demand, i.e., 2,300Ah. In addition, the hybrid energy network also contains 6 gas turbines with a rated power of 110kW, 3 fuel cells with a capacity of 40Ah, and 20 translatable loads with a mean power of 90kW. Table 1 shows real-time energy prices. Figure 6 shows the daily load curve of the hybrid energy network. The dispatch cycle was set to 0.5h, that is, each day has 48 dispatch cycles.
Table 1. The real-time energy prices
|
Supply period |
Time |
Electricity price |
Heat price |
||
|
Time-of-use (TOU) price [yuan·(kW·h)-1] |
Peak price [yuan ·(kW·h/month)] |
Non-residential heating [yuan ·(kW·h)-1] |
Area-based charge [yuan /m2] |
||
|
Peak hours |
10: 00-13: 00 17: 00-22: 30 |
1.06 |
36.5 |
0.11 |
22 |
|
Normal hours |
7: 00-10: 00 13: 00-17: 00 |
0.58 |
|||
|
Through hours |
23: 00-7: 00 |
0.38 |
|||
The proposed hybrid optimization algorithm was simulated on MATLAB, with the maximum number of iterations of 500, swarm size of 300, and dimension of 10. Our algorithm and the traditional PSO were separately implemented 50 times to search for the optimal solution and Pareto optimal set. Figure 7 compares the operating costs of the hybrid energy network under the two algorithms. It can be seen that the operating cost stabilized at 611.51 yuan under our algorithm, lower than that (617.47 yuan) under the PSO. Besides, it took fewer iterations for the cost to stabilize under our algorithm than under the PSO. The results indicate that our algorithm outperforms the traditional PSO in convergence speed, operation of hybrid energy network, and optimization of renewable energy dispatch. Therefore, our algorithm boasts strong applicability in the digital management of renewable energies for smart cities.
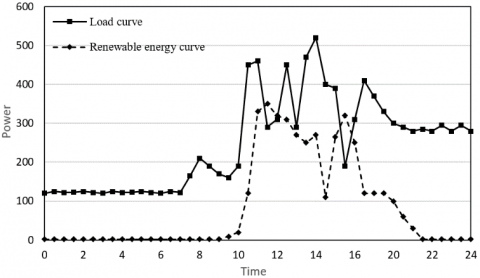
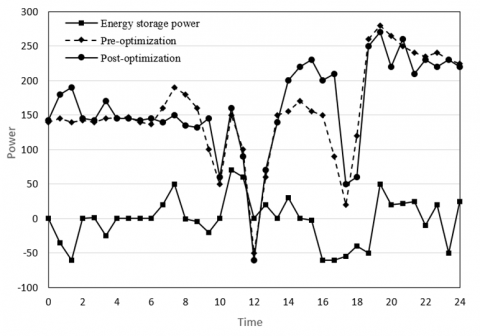
Furthermore, contrastive experiments were designed to verify the effectiveness of the proposed models, objective functions, and algorithm. The PV power generation, wind power generation, battery energy storage, gas turbine power generation, fuel cell power generation, and the exchange power between renewable energies and AC grid were calculated and forecasted. Figure 8 presents the output curve and load curve of renewable energies of the hybrid energy network on a certain day. Figure 9 displays the results of digital management of renewable energies after multi-objective optimization. It can be seen that the optimization lowered the peak load and peak electricity price of the network; the battery was charged by 132.54kW·h in the through hours, and discharged 121.69kW·h in other periods, saving a total of 85.12 yuan of electricity cost.
Figure 6. The daily load curve of the hybrid energy network
Figure 7. The comparison of operating costs of the hybrid energy network under the two algorithms
Figure 8. The output curve and load curve of renewable energies of the hybrid energy network
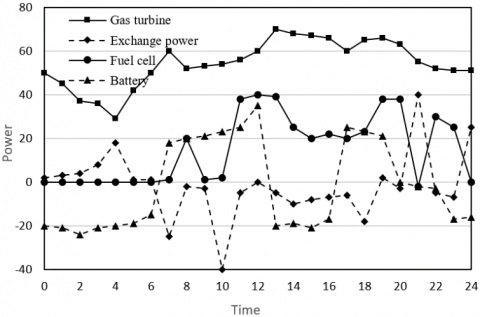
Figure 10 illustrates the output powers of the units in the hybrid energy network after multi-objective optimization. The energy dispatch situation can be analyzed based on the figure. During the heating season in winter, the electricity generated by renewable energies and gas turbine will be firstly supplied to satisfy the electrical and thermals of users in smart cities. In the through hours between 21:00 and 7:00, the renewable energies and gas turbine have a high cost in energy supply; the fuel cell does not work; the battery purchases electricity from the AC grid, and stores the purchased electricity.
The normal hours of energy supply last from 7: 00 to 10: 00, and from 13: 00 to 17: 00. During these hours, the cost of fuel cell power generation is slightly higher than the real-time electricity price, while the output of gas turbine decreases. In this case, the network loads are mainly powered by renewable energy power generation. The energy deficit will be made up by the fuel cell, and the energy surplus will be sold to the State Grid. The other periods belong to the peak hours, where the network loads are powered by renewable energy power generation, fuel cell discharge, and battery discharge. The energy deficit will be satisfied by the AC grid, and the energy surplus will be sold to the State Grid.
Figure 9. The results of digital management of renewable energies after multi-objective optimization
Figure 10. The output powers of the units after optimization
This paper proposes a multi-objective optimization algorithm for digital management that quantifies the multiple energy models for smart cities. Firstly, the dimensions of renewable energy construction for smart cities were enumerated, and the functions, hierarchy, and data flows were illustrated for the digital management system of renewable energies for smart cities. Next, the authors established the probabilistic output models of the power generation by typical renewable energies, and set up the objective functions for the digital management of energies. After that, the PSO and GA were combined to optimize the multiple objectives of the digital management of renewable energies in smart cities. Finally, experiments were carried out to compare our algorithm with the traditional PSO. The results show that our algorithm outperforms the traditional PSO in convergence speed, operation of hybrid energy network, and optimization of renewable energy dispatch. Contrastive experiments demonstrate the effectiveness of the proposed models, objective functions, and the multi-objective optimization algorithm.
We appreciate the valuable comments from the editor and the anonymous reviewers. This research was supported by the Guangdong Provincial Natural Science Foundation Ph.D. Startup Project under Grant Nos. 2018A0303100017; and supported by the Guangdong Philosophy and Social Science Planning Project under Grant Nos. GD18CGL14; and supported by the Guangzhou University Innovation and Entrepreneurship Education Project under Grant Nos. 2019KC009.
[1] Sabiri, Z., Machkour, N., Kheddioui, E., Ailane, A., Tabaa, M. (2017). A new architecture of energy management applied to hybrid renewable energy system. In 2017 29th International Conference on Microelectronics (ICM), pp. 1-4. https://doi.org/10.1109/ICM.2017.8268877
[2] Hajebrahimi, H., Kaviri, S.M., Eren, S., Bakhshai, A. (2020). A new energy management control method for energy storage systems in microgrids. IEEE Transactions on Power Electronics, 35(11): 11612-11624. https://doi.org/10.1109/TPEL.2020.2978672
[3] Yu, X., Geng, Y. (2019). Complementary configuration research of new combined cooling, heating, and power system driven by renewable energy under energy management modes. Energy Technology, 7(10): 1900409. https://doi.org/10.1002/ente.201900409
[4] Buccoliero, G., Anselma, P.G., Bonab, S.A., Belingardi, G., Emadi, A. (2019). A new energy management strategy for multimode power-split hybrid electric vehicles. IEEE Transactions on Vehicular Technology, 69(1): 172-181. https://doi.org/10.1109/TVT.2019.2950033
[5] Shaterabadi, M., Jirdehi, M.A. (2020). Multi-objective stochastic programming energy management for integrated INVELOX turbines in microgrids: A new type of turbines. Renewable Energy, 145: 2754-2769. https://doi.org/10.1016/j.renene.2019.08.002
[6] Kim, S. (2019). A new triple bargaining game-based energy management scheme for hierarchical smart grids. IEEE Access, 7: 161131-161140. https://doi.org/10.1109/ACCESS.2019.2951499
[7] Rezaei, A., Burl, J.B., Zhou, B., Rezaei, M. (2017). A new real-time optimal energy management strategy for parallel hybrid electric vehicles. IEEE Transactions on Control Systems Technology, 27(2): 830-837. https://doi.org/10.1109/TCST.2017.2775184
[8] Elamin, W.E., Shaaban, M.F. (2019). New real-time demand-side management approach for energy management systems. IET Smart Grid, 2(2): 183-191. https://doi.org/10.1049/iet-stg.2018.0033
[9] Askarzadeh, A. (2017). Distribution generation by photovoltaic and diesel generator systems: Energy management and size optimization by a new approach for a stand-alone application. Energy, 122: 542-551. https://doi.org/10.1016/j.energy.2017.01.105
[10] Javaid, N., Naseem, M., Rasheed, M. B., Mahmood, D., Khan, S.A., Alrajeh, N., Iqbal, Z. (2017). A new heuristically optimized Home Energy Management controller for smart grid. Sustainable Cities and Society, 34: 211-227. https://doi.org/10.1016/j.scs.2017.06.009
[11] Ożadowicz, A. (2017). A new concept of active demand side management for energy efficient prosumer microgrids with smart building technologies. Energies, 10(11): 1771. https://doi.org/10.3390/en10111771
[12] Alghisi, D., Ferrari, V., Ferrari, M., Touati, F., Crescini, D., Mnaouer, A.B. (2017). A new nano-power trigger circuit for battery-less power management electronics in energy harvesting systems. Sensors and Actuators A: Physical, 263: 305-316. https://doi.org/10.1016/j.sna.2017.06.025
[13] Boyd, G., Doolin, M., Dutrow, E., Zhang, S. (2017). A new benchmark of energy performance for energy management in US and Canadian integrated steel plants. Iron and Steel Technology (May), 3: 2835-2848.
[14] Álvarez-López, R.A. (2016). New approach to energy management system for home based on open source and hardware. In 2016 IEEE Colombian Conference on Communications and Computing (COLCOM), pp. 1-4. https://doi.org/10.1109/ColComCon.2016.7516407
[15] Rezaei, N., Mazidi, M., Gholami, M., Mohiti, M. (2020). A new stochastic gain adaptive energy management system for smart microgrids considering frequency responsive loads. Energy Reports, 6: 914-932. https://doi.org/10.1016/j.egyr.2020.04.021
[16] Ahmadi, S.E., Rezaei, N. (2020). A new isolated renewable based multi microgrid optimal energy management system considering uncertainty and demand response. International Journal of Electrical Power & Energy Systems, 118: 105760. https://doi.org/10.1016/j.ijepes.2019.105760
[17] Ahmad, W., Javaid, N., Khan, S., Zuraiz, M., Awan, T., Amir, M., Abbasi, R.A. (2019). A new memory updation heuristic scheme for energy management system in smart grid. In International Conference on Advanced Information Networking and Applications, 926: 53-66. https://doi.org/10.1007/978-3-030-15032-7_5
[18] Kougias, I., Karakatsanis, D., Malatras, A., Monforti-Ferrario, F., Theodossiou, N. (2016). Renewable energy production management with a new harmony search optimization toolkit. Clean Technologies and Environmental Policy, 18(8): 2603-2612. https://doi.org/10.1007/s10098-016-1173-4
[19] Hosseini, S.A., Amjady, N., Shafie-khah, M., Catalão, J.P. (2016). A new multi-objective solution approach to solve transmission congestion management problem of energy markets. Applied Energy, 165: 462-471. https://doi.org/10.1016/j.apenergy.2015.12.101
[20] Cherukuri, S.H.C., Saravanan, B., Swarup, K.S. (2018). A new choice based home energy management system using electric springs. In 2018 20th National Power Systems Conference (NPSC), pp. 1-6. https://doi.org/10.1109/NPSC.2018.8771858
[21] Hussain, H.M., Javaid, N., Iqbal, S., Hasan, Q.U., Aurangzeb, K., Alhussein, M. (2018). An efficient demand side management system with a new optimized home energy management controller in smart grid. Energies, 11(1): 190. https://doi.org/10.3390/en11010190
[22] Conrads, H. (2018). The new Atlas shredder from Lindner: Equipped with e-drive and an intelligent energy management system. Cement International, 16(6): 43-46.
[23] Palasciano, C., Bustillo, A., Fantini, P., Taisch, M. (2016). A new approach for machine's management: from machine's signal acquisition to energy indexes. Journal of Cleaner Production, 137: 1503-1515. https://doi.org/10.1016/j.jclepro.2016.07.030
[24] Tehrani, S.Z., Ranjbar, H., Vial, P., Premaratne, P. (2019). A new efficient power management interface for hybrid electromagnetic-piezoelectric energy harvesting system. In 16th International Conference on Information Technology-New Generations (ITNG 2019), pp. 537-542. https://doi.org/10.1007/978-3-030-14070-0_75
[25] Rizoug, N., Mesbahi, T., Sadoun, R., Bartholomeüs, P., Le Moigne, P. (2018). Development of new improved energy management strategies for electric vehicle battery/supercapacitor hybrid energy storage system. Energy Efficiency, 11(4): 823-843. https://doi.org/10.1007/s12053-017-9602-8
[26] Gholami, M., Javidan, R. (2018). Providing a new energy management approach in smart homes using the 6lowpan protocol. In Proceedings of the International Conference on Smart Cities and Internet of Things, pp. 1-9. https://doi.org/10.1145/3269961.3269963
[27] Zemlick, K., Kalhor, E., Thomson, B.M., Chermak, J.M., Graham, E.J.S., Tidwell, V.C. (2018). Mapping the energy footprint of produced water management in New Mexico. Environmental Research Letters, 13(2): 024008. https://doi.org/10.1088/1748-9326/aa9e54