Bing Yang
© 2020 IIETA. This article is published by IIETA and is licensed under the CC BY 4.0 license (http://creativecommons.org/licenses/by/4.0/).
OPEN ACCESS
Traditionally, the beams of mechanical presses are designed and optimized empirically. The empirical design cannot satisfy the increasingly strict requirements on product performance, quality, cost and appearance. This paper attempts to develop a lightweight design for the beam of a straight-side two-point press without sacrificing the strength and stiffness of the structure, thus saving materials and production cost. Our design was mainly developed through multi-goal-driven optimization (multi-GDO) based on ANSYS Workbench. Firstly, the finite-element model of the target beam was established with the aid of ANSYS Workbench and SolidWorks, followed by the static structural analysis on the beam structure. Next, the main dimensional parameters of the beam were subjected to sensitivity analysis, revealing the key factors affecting the beam dimensions. Finally, the multi-objective genetic algorithm (MOGA) was called to optimize the main design variables, and finalize the lightweight design of the beam. The lightweight design was found to greatly save the material and production cost. The research results lay the theoretical basis for beam improvement, and provide a reference for the optimization of other parts of mechanical press and other molding and forging machines.
mechanical press, beam, parametric design, multi-goal driven optimization (multi-GDO)
Mechanical press is an important tool for molding and forging. More than 80% of molding and forging machines are mechanical presses. During mechanical pressing, the slider-crank mechanism converts the motor rotations into the linear reciprocating motions of the slider. In this way, the raw materials are molded and machined into various semi-finished products or finished products [1-3].
Based on body structure, mechanical presses can be divided into open-back press and straight-side press. The open-back press is open on the front, left side and right side, which facilitates the operations, mold installation and automatic feeding. However, the low-rigidity C-shape body is easy to deform under a high impact pressure, reducing the service life of the mold. Hence, open-back presses tend to be small or medium in size.
The straight-side press is closed on both sides. The raw materials can only be fed into the press from the front and the end. Thus, the operations of straight-side press are more complex than those of open-back press. Nevertheless, the machine tool of the straight-side press is rigid enough to withstand a large pressure. As a result, straight-side presses are generally adopted for high-precision processing of heavy materials.
Based on the number of connecting rods, mechanical presses fall into one-point press, two-point press, and four-point press. In this paper, a JA39-1000E straight-side two-point press is taken as the object. The press is an integrated assemblage of a beam, two columns, a base, and two tension bolts. Installed on the column platform, the beam is the key component of the press. As shown in Figure 1, the beam contains the main transmission parts of the press, namely, transmission gear, transmission axle, eccentric sleeve, connecting rods and guide post.
Figure 1. The beam of JA39-1000E straight-side two-point press
Currently, the body of mechanical press is mostly designed and improved empirically. The size parameters are highly irregular, and the body designs are rather clumsy. In the age of information technology (IT), this design strategy cannot satisfy the increasingly strict requirements on product performance, quality, cost and appearance. To solve the problem, the ideas of green design and lean production must be introduced to the body design of mechanical press, especially its main working part: the beam.
Against this backdrop, this paper optimizes the beam in the target straight-side press with the Goal Driven Optimization (GDO) module of ANSYS Workbench. The beam structure was lightened without sacrificing strength or rigidity, reducing the materials and cost of press production. Our design approach optimizes the main dimensions of the beam and enhances the overall performance of the press, laying the basis for optimal design of other parts of the press [4-10].
The remainder of this paper is organized as follows: Section 2 conducts the static structural analysis of the beam; Section 3 carries out parametric design of beam dimensions; Section 4 introduces the multi-GDO of the beam; Section 5 puts forward the conclusions.
2.1 Finite-element modelling of the beam
The 3D modelling software SolidWorks was selected to set up a 3D geometric model of the beam, for the data of the software is fully sharable with ANSYS Workbench. The beam has a complex structure, with many holes, chamfers and fillet corners on the surface. In simulation analysis, these complex features will push up the computing load, and suppress the meshing quality. Hence, the 3D model of the beam was simplified properly before being imported to ANSYS Workbench for finite-element modelling. The dimensions of the beam are listed in Table 1 below.
Table 1. Dimensions of the beam
|
Parameters |
Length (mm) |
Width (mm) |
Height (mm) |
Mass (kg) |
|
Value |
6,900 |
3,800 |
2,760 |
54,623 |
2.2 Meshing
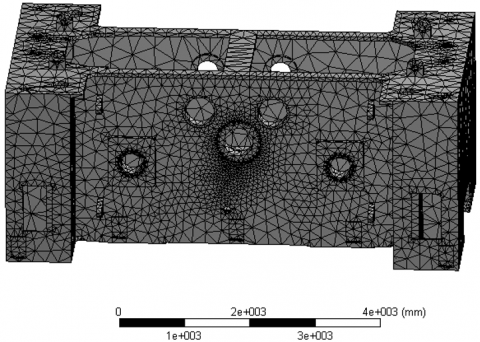
The 3D model was meshed by the automatic grid partition function of the ANSYS Workbench Environment (AWE). Considering the working conditions of the beam, different meshing methods were applied to different parts. The Generate Mesh function was called to divide the 3D model of the beam into regular triangles with side length of 60.0mm.
To ensure meshing quality, the grid density was adjusted automatically depending on the precision required for each region. After all, the meshing quality directly bears on the speed and accuracy of finite-element simulation. Figure 2 presents the finite-element model of the beam.
Figure 2. The finite-element model of the beam
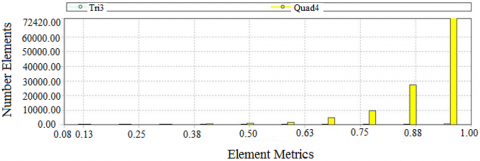
ANSYS Workbench offers various metrics of meshing quality, namely, element quality, Jacobian ratio, skewness and orthogonal quality. Here, element quality is employed to evaluate the meshing quality of our finite-element model. The evaluation results are plotted as Figure 3, where the x value falls in the interval [0, 1]. The closer the value is to 1, the better the element quality. It can be seen that most grids in our model surpassed 0.75 in element quality, and the mean element quality of our model stood at 0.9. This means our model has a high meshing quality.
Figure 3. The element qualities of the grids in our model
2.3 Load constraints and model solution
To solve our model accurately, the load constraints must be close to the actual conditions. During normal operations, the beam of our mechanical press is mainly subjected to the reactive force from the slider, which acts on the joints between the connecting rod axles and the beam. This force creates a maximum nominal load of 10,000kN.
Our mechanical press has two connecting rods: one on the left side and the other on the right side. Therefore, the joint between the front plate and connecting rod axles, and that between the rear plate and connecting rod axles, were respectively applied a 5,000kN uniform load with the Force command in Static Structural, ANSYS Workbench. The uniform loads act on the upper-half cylindrical surface of axle holes, respectively.
Considering the dead weight of the beam, non-directional frictionless constraints were applied on the top surface of the cover plate on the beam, the tension bolt holes, and the joints between the beam and columns.
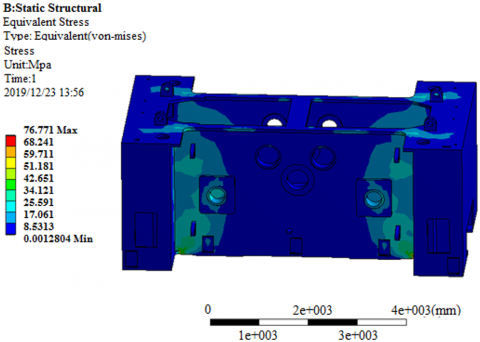
Figure 4. Cloud map of beam stress
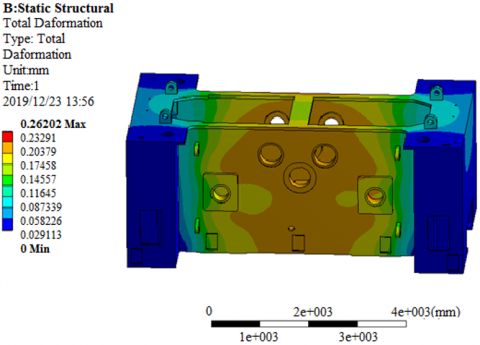
Figure 5. Cloud map of beam deformation
Then, the stress and deformation of the beam were obtained by solving our finite-element model. The cloud maps of the stress and deformation are provided in Figures 4 and 5, respectively.
2.4 Results analysis
The target mechanical press is mainly welded from Q235-A steel plates (elastic modulus Ε: 210GPa; Poisson’s ratio ν: 0.3; yield limit σs: 235MPa). Then, the allowable stress [σ] of the beam can be computed by:
$[\sigma]=\frac{\sigma_{S}}{n_{s}}=130.5 \mathrm{MPa}$ (1)
Considering the load conditions of the beam, the safety coefficient ns was empirically set to 1.8. From the perspective of material mechanics, the beam was simplified as a simply-supported beam. According to engineering experience, the maximum deflection is about 1/5,000-1/8,000 of the beam length. Hence, the maximum deflection of our beam fell between 0.461mm and 0.738mm.
As shown in Figure 4, the maximum stress (76.77MPa) on the beam appeared at the junction between the front plate and the columns and that between the rear plate and the column. The maximum stress is far smaller than the allowable stress of 130.5MPa. Local high stress also existed on the sleeves of the axles.
As shown in Figure 5, the beam was mainly deformed on the sleeves of connecting rod axles on the inside. The maximum deformation (0.262mm) was below the maximum allowable deflection of the beam.
The results of finite-element analysis show that the beam design is safe and acceptable. But the current design might cause a high material waste. Therefore, the next step is to perform multi-GDO of the beam based on stress, strain and weight.
The optimization of beam design is subjected to multiple constraints. Considering the complexity of beam structure, the dimensional parameters should not be selected blindly. Thus, this paper carries out sensitivity analysis to identify the key factors affecting the structural performance of the beam.
Figure 6. The results of sensitivity analysis
According to the static structural analysis, the thicknesses of the front and rear plates were selected for sensitivity analysis [11-13]. The analysis results are displayed in Figure 6.
3.1 Design variables and objective functions
As mentioned before, the target mechanical press is mainly welded from Q235-A steel plates. The thickness of each plate directly affects the stress distribution, deformation and overall mass of the beam. According to the sensitivity analysis, the thicknesses of the front and rear plates were taken as design variables: X=[X1, X2]T. The initial values of the variables are listed in Table 2.
Table 2. Initial values of design variables
|
Design variables |
Initial value/mm |
Meaning |
|
X1 |
75 |
Thickness of front plate |
|
X2 |
80 |
Thickness of rear plate |
The beam optimization aims to achieve two goals: (1) minimizing the total mass without sacrificing the normal performance of the beam; (2) minimizing the maximum deformation of the beam to fulfill the stiffness requirement. Hence, two objective function can be established as:
$\mathrm{F}_{1}(\mathrm{x})=\mathrm{M}(\mathrm{x})=\mathrm{M}\left(\mathrm{x}_{1}, \mathrm{x}_{2}\right)$ (2)
$\mathrm{F}_{2}(\mathrm{X})=\mathrm{D}_{\max }(\mathrm{X})=\mathrm{D}\left(\mathrm{X}_{1}, \mathrm{X}_{2}\right)$ (3)
3.2 Constraints
During the operation, the target beam mainly bears the load from the reactive force of the slider. Hence, the structural safety must be considered in the optimization process, in addition to structural strength [14]. Drawing on engineering experience and previous research, the safety coefficient ns was set to 1.8. Then, the requirement on structural strength can be described as:
$\mathrm{F}_{3}(\mathrm{X})=\sigma \leq \sigma_{\mathrm{S}} / \mathrm{n}_{\mathrm{s}}=130.5 \mathrm{MPa}$ (4)
where, σs=235MPa is the yield limit of Q235-A steel.
As boundary conditions, the value ranges of the two design variables were set as 10% up and down relative to the dimensional standard, in the light of requirements on structural design:
$\left\{\begin{array}{l}
70 \leq x_{1} \leq 75 \\
75 \leq x_{2} \leq 85
\end{array}\right.$ (5)
3.3 Parametric optimization model
Through the above analysis, the parametric optimization model for the beam can be established as:
$\begin{array}{c}
\min \mathrm{F}_{1}(\mathrm{X})=\min \mathrm{M}(\mathrm{X})=\mathrm{M}\left(\mathrm{X}_{1}, \mathrm{X}_{2}\right) \\
\min \mathrm{F}_{2}(\mathrm{X})=\min \mathrm{D}_{\max }(\mathrm{X})=\mathrm{D}\left(\mathrm{X}_{1}, \mathrm{X}_{2}\right) \\
\mathrm{s.t.} \mathrm{F}_{3}(\mathrm{X})=\sigma \leq \sigma_{\mathrm{S}} / \mathrm{n}_{\mathrm{s}}=130.5 \mathrm{MPa} \\
\quad 70 \leq \mathrm{X}_{1} \leq 75 \\
75 \leq \mathrm{X}_{2} \leq 85
\end{array}$ (6)
The modelling process is summarized as follows: The front and rear plates bear most of the load on the beam. Their dimensions are critical to the structural performance of the whole beam. Here, the dimensions of the two plates are parameterized on SolidWorks, creating a parametric 3D model of the beam. The objective functions and constraints can be optimized flexibly in subsequent research.
It can be seen from the modelling process that: it is a complex and systematic task for engineering designers to set up the objective functions in formula (6) for the design variables X1 and X2, and solve the optimization model. From the perspective of engineering application, this paper carries out a multi-GDO design of the beam on ANSYS Workbench.
The AWE provides an environment for preprocessing and post-processing, which is fully compatible with computer-aided design (CAD) software and design flow. Under the AWE, it is easy to apply computer-aided engineering (CAE) techniques quickly in production development, thereby shortening the design cycle and improving the added value of the product.
Designed in CAD software, the improved variables can be transferred to the AWE environment. These variables, coupled with constraints and design goals, enable the automatic optimization of product design: under the constraints, product indices or performance could reach desired levels by changing the adjustable design variables, provided that all the design goals are realized.
Therefore, this paper relies on the GDO module under the AWE to optimize the beam design of the target straight-side two-point press.
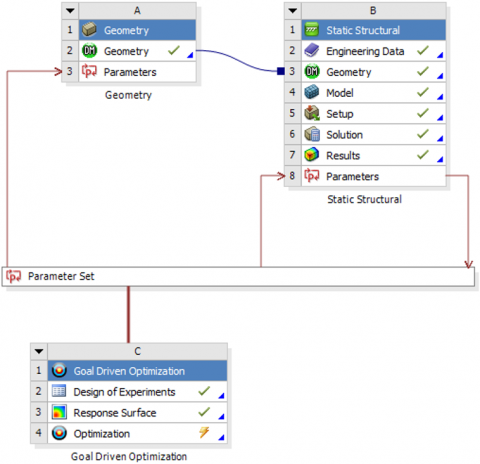
4.1 Optimal design route
The static structural analysis shows that the beam design reaches the required strength and stiffness, leaving a room for improvement. The optimal design route was planned with the aid of three ANSYS Workbench functions: Design of Experiment (DOE), Response Surface and GDO.
Figure 7. The optimal design route
As shown in Figure 7, a series of sampling points were generated through Latin Hypercube Sampling (LHS) of the DOE, and used to construct the response surface model between parameters and objective functions. Then, the optimal solution to the model was searched for by the multi-objective genetic algorithm (MOGA) of the GDO [15-18].
4.2 DOE method
The DOE aims to design a rational test plan that reveals how the input variables affect the output variables, without incurring a high test cost. Currently, there are various DOE methods, some of which are quite innovative. The common pursuit of these methods is to customize the test plan for specific problems, and prevent resource waste. Once the experiment is completed and the relevant data are collected, the engineers and technicians will be able to perform data analysis and modelling conveniently, identify the patterns of response variables, pinpoint and optimize the key active variables, and predict the effect and robustness of optimization.
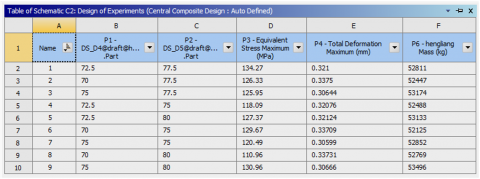
The LHS is a sampling method provided in the DOE module. The LHS-based design generates a matrix of randomly combined samples, which can be filled effectively without repetition. This design approach is good at fitting second- or higher-order nonlinear relationships. This paper adopts the LHS to extract ten groups of sample values, and then computes the response values of the extracted sample values. The calculation results are listed in Figure 8.
Figure 8. The sample values of dimensional design
4.3 Response surface model
One of the key steps of model optimization is to approximate the response relationship between input and output variables. The response surface design, as a statistical method for multivariate problems, collects test data based on rational DOE, fits the functional relationship between factors and response values, and optimize the process parameters through regression analysis [19-21].
In this paper, the response surface model is derived by complete quadratic polynomial fitting in ANSYS Workbench. The surface under the limit state was fitted with quadratic polynomial. This fitting method not only reduces unknown parameters, but also ensures the response stability. After the response surface was generated, the pie chart of input and output variables was displayed on ANSYS Workbench, revealing the degree of impact of each input variable on each output variable [22].
4.4 Model solving and results analysis
Our optimization model attempts to minimize the mass of the target beam without sacrificing its strength, stability and stability. The MOGA of the GDO was called to solve the response surface model. The MOGA is a stochastic optimization algorithm capable of finding the global optimal solution through paralleled probabilistic searches. With strong adaptability and applicability, the algorithm is known for its excellence in handling complex nonlinear problems [23-25].
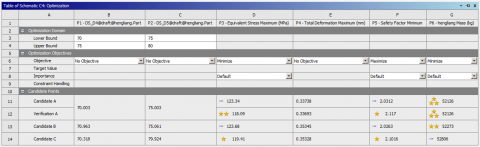
The response surface model was solved in the following steps: First, the GDO module was selected, and the parameters of the MOGA were initialized as: population size, 100; number of samples per iteration, 1,000; the maximum convergence criterion, 80%; maximum number of iterations, 20. Next, the objective functions and constraints were configured by formula (6). The three output variables, namely, maximum stress, maximum strain and minimum mass, were taken as design goals (Figure 9). In the output data, each data point represents the values of the three outputs corresponding to an optimization result [26].
Figure 9. The settings of optimization goals
As shown in Figure 9, the three outputs basically reached the preset goals, that is, the maximum stress was below the constraint on allowable stress, the beam mass was reduced to a certain extent, and the maximum deformation was smaller than the allowable deflection.
The 3D response surfaces of stress and mass are displayed in Figures 10 and 11, respectively. Obviously, the impacts of P1 and P2 on the maximum stress are shaped like parabolas, exhibiting extreme values.
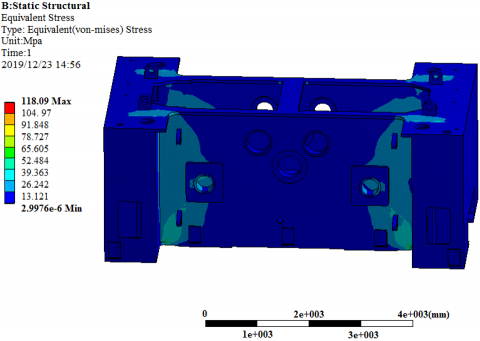
Candidate solution DP12 was selected as the optimal solution. However, the optimal solution deviates slightly from the real solution, for the results were derived from the response surface. Hence, the optimized design variables were rounded and calculated again. Table 3 compares the initial, optimized and rounded values. The final stress and deformation are plotted as Figures 12 and 13, respectively.
Figure 10. The 3D response surface of stress
Figure 11. The 3D response surface of mass
Figure 12. The final stress
Figure 13. The final deformation
The final results indicate that the maximum stress and maximum deformation of the optimized beam surpassed those of the original beam by different degrees, and fell below the allowable levels. Hence, the optimized maximum stress and maximum deformation meet the material performance required for the normal working of the beam, and fulfil the expectation of designers. Meanwhile, the thicknesses of the front and rear plate both decreased through the optimization, and the overall mass of the beam dropped by 4.6% to 52,126kg. The optimized design saves materials and reduces the production cost.
Table 3. Initial, optimized and rounded values
|
Design plan |
Design variables |
Response values |
|||
|
P1 (X1) Front plate thickness mm |
P2 (X2) Rear plate thickness mm |
P3 Maximum stress MPa |
P4 Maximum deformation mm |
P6 Mass kg |
|
|
Initial |
75 |
80 |
76.77 |
0.262 |
54,623 |
|
Optimized |
70.003 |
75.003 |
118.09 |
0.337 |
52,126 |
|
Rounded |
70 |
75 |
118.10 |
0.337 |
52,126 |
Based on ANSYS Workbench, this paper firstly performs static structural analysis on the beam of a straight-side two-point press. Through the analysis, the authors obtained the maximum deformation, maximum stress and their distribution patterns of the beam, and identified the optimization space of the beam structure. Next, the main dimensional parameters of the beam were subjected to sensitivity analysis, revealing the key factors affecting the beam dimensions. Finally, the authors conducted multi-GDO of the beam structure under the constraints of stiffness and strength, and formulated a lightweight beam design by comparing the optimized results with the original results. The design results were found to be reasonable and feasible. Our optimization lays the theoretical basis for beam improvement, and provides a reference for the optimization of other parts of mechanical press and other molding and forging machines.
[1] Tomić, M., Milošević, M., Tomić, N., Pavlović, N.D., Pavlović, V. (2017). Remote control of the mechatronic redesigned slider-crank mechanism in service. Facta Universitatis, Series: Mechanical Engineering, 15(2): 257-268. https://doi.org/10.22190/FUME170510013T
[2] Yavtushenko, A., Yavtushenko, G., Protsenko, V., Bondarenko, Y., Vasilchenko, T. (2019). Dynamics of mechanical press drive. 2019 IEEE International Conference on Modern Electrical and Energy Systems (MEES), Kremenchuk, Ukraine, pp. 14-17. https://doi.org/10.1109/MEES.2019.8896522
[3] Li, Y., Stevens, P., Sun, M., Zhang, C., Wang, W. (2016). Improvement of predicting mechanical properties from spherical indentation test. International Journal of Mechanical Sciences, 117: 182-196. https://doi.org/10.1016/j.ijmecsci.2016.08.019
[4] Xue, B.M., Zhang, W.S., Zhang, Z.X. (2018). Multi-objective wing optimization of civil aircrafts in engine-aircraft integration configuration. Acta Aerodynamica Sinica, 36(6): 941-948. https://doi.org/10.7638/kqdlxxb-2016.0126
[5] Reynoso-Meza, G., Sanchis, J., Blasco, X., Martínez, M. (2016). Preference driven multi-objective optimization design procedure for industrial controller tuning. Information Sciences, 339: 108-131. https://doi.org/10.1016/j.ins.2015.12.002
[6] Nahvi, A., Sadoughi, M.K., Arabzadeh, A., Sassani, A., Hu, C., Ceylan, H., Kim, S. (2019). Multi-objective bayesian optimization of super hydrophobic coatings on asphalt concrete surfaces. Journal of Computational Design and Engineering, 6(4): 693-704. https://doi.org/10.1016/j.jcde.2018.11.005
[7] Ge, Y., Wang, S., Liu, Z., Liu, W. (2019). Optimal shape design of a minichannel heat sink applying multi-objective optimization algorithm and three-dimensional numerical method. Applied Thermal Engineering, 148: 120-128. https://doi.org/10.1016/j.applthermaleng.2018.11.038
[8] Zhu, L., Cao, H., Huang, H., Yang, X. (2017). Exergy analysis and multi-objective optimization of air cooling system for dry machining. The International Journal of Advanced Manufacturing Technology, 93(9-12): 3175-3188. https://doi.org/10.1007/s00170-017-0731-1
[9] Nasir, M.T., Ali, M.A., Khan, T.S., Al-Hajri, E., Kadri, M.B., Kim, K.C. (2019). Performance assessment and multi objective optimization of an Organic Rankine Cycle driven cooling air conditioning system. Energy and Buildings, 191: 13-30. https://doi.org/10.1016/j.enbuild.2019.03.012
[10] Wang, C., Zhang, Y., Zhao, W. (2018). Multi-objective optimization of a steering system considering steering modality. Advances in Engineering Software, 126: 61-74. https://doi.org/10.1016/j.advengsoft.2018.09.012
[11] Han, C., Yu, X.B. (2016). Sensitivity analysis of a vertical geothermal heat pump system. Applied Energy, 170: 148-160. https://doi.org/10.1016/j.apenergy.2016.02.085
[12] Chen, Y., Yang, H., Luo, Y. (2017). Parameter sensitivity analysis and configuration optimization of indirect evaporative cooler (IEC) considering condensation. Applied energy, 194: 440-453. https://doi.org/10.1016/j.apenergy.2016.06.121
[13] Lin, B., Chen, Y. (2017). The parameterized complexity of k-edge induced subgraphs. Information and Computation, 252: 138-160. https://doi.org/10.1016/j.ic.2016.10.004
[14] Farivar, F., Shoorehdeli, M. A. (2016). Stability analysis of particle dynamics in gravitational search optimization algorithm. Information Sciences, 337: 25-43. https://doi.org/10.1016/j.ins.2015.12.017
[15] Liu, B., Yao, K. (2015). Uncertain multilevel programming: Algorithm and applications. Computers & Industrial Engineering, 89: 235-240. https://doi.org/10.1016/j.cie.2014.09.029
[16] Hu, N., Zhou, P., & Yang, J. (2017). Comparison and combination of NLPQL and MOGA algorithms for a marine medium-speed diesel engine optimisation. Energy conversion and management, 133: 138-152. https://doi.org/10.1016/j.enconman.2016.11.066
[17] Taghavifar, H., Anvari, S. (2019). Optimization of a DI diesel engine to reduce emission and boost power by exergy and NLPQL method. Environmental Progress & Sustainable Energy, e13338. https://doi.org/10.1002/ep.13338
[18] Kumar, A., Soota, T., Kumar, J. (2018). Optimisation of wire-cut EDM process parameter by Grey-based response surface methodology. Journal of Industrial Engineering International, 14(4): 821-829. https://doi.org/10.1007/s40092-018-0264-8
[19] Iqbal, U.M., Kumar, V.S., Gopalakannan, S. (2016). Application of Response Surface Methodology in optimizing the process parameters of Twist Extrusion process for AA6061-T6 aluminum alloy. Measurement, 94: 126-138. https://doi.org/10.1016/j.measurement.2016.07.085
[20] Ahmad, A., Alam, S. (2019). Parametric optimization of TIG welding using Response Surface Methodology. Materials Today: Proceedings, 18: 3071-3079. https://doi.org/10.1016/j.matpr.2019.07.179
[21] Elman, H.C., Forstall, V. (2017). Numerical solution of the parameterized steady-state Navier-Stokes equations using empirical interpolation methods. Computer Methods in Applied Mechanics and Engineering, 317: 380-399. https://doi.org/10.1016/j.cma.2016.12.011
[22] Patel, T.M., Bhatt, N.M. (2016). Development of a mathematical model of VMS for automotive structural member using FEA-RSM hybrid modeling. Procedia Technol, 23: 98-105. https://doi.org/10.1016/j.protcy.2016.03.004
[23] Mousavi-Avval, S.H., Rafiee, S., Sharifi, M., Hosseinpour, S., Notarnicola, B., Tassielli, G., Renzulli, P.A. (2017). Application of multi-objective genetic algorithms for optimization of energy, economics and environmental life cycle assessment in oilseed production. Journal of Cleaner Production, 140: 804-815. https://doi.org/10.1016/j.jclepro.2016.03.075
[24] Beshr, M., Aute, V., Radermacher, R. (2016). Multi-objective optimization of a residential air source heat pump with small-diameter tubes using genetic algorithms. International Journal of Refrigeration, 67: 134-142. https://doi.org/10.1016/j.ijrefrig.2016.03.016
[25] Evangelaras, H., Koutras, M.V. (2017). On second order orthogonal Latin hypercube designs. Journal of Complexity, 39: 111-121. https://doi.org/10.1016/j.jco.2016.10.007
[26] Mandal, B.N., Dash, S., Parui, S., Parsad, R. (2016). Orthogonal Latin hypercube designs with special reference to four factors. Statistics & Probability Letters, 119: 181-185. https://doi.org/10.1016/j.spl.2016.08.001