Jayababu Badugu* | Yeddula Peda Obulesu | Choppavarapu Sai Babu
OPEN ACCESS
This paper presents unplanned and smart charging of Electric Vehicles (EV’s) in residential distribution systems. EVs are becoming attractive solution due to zero emission and efficient mode of transportation compared to conventional vehicles based on internal combustion engines. Electric Vehicle chargers are considered as irregular loads, which can affect the performance of distribution systems. Power utilities are facing challenges of possible over-burdens, stresses, deviations in voltages and power losses from EV charging stations. The distribution network faces the possibilities of power outages and frequent voltage variations, which might be the result of unmanaged EV charging. This paper put forward a Smart Load Management (SLM) control methodology to control and manage several EV charging activities to reduce the stress on the distribution network and to improve distribution system reliability, security and the performance. Residential distribution system is simulated in MATLAB with unplanned charging of electric vehicles and results have been presented. The same residential distribution system is simulated with proposed algorithm and results are compared with unplanned charging of electric vehicles.
Electric Vehicles (EVs), coordinated charging, load curve, unplanned charging, Smart Load Management (SLM)
The market size of Electric Vehicles (EVs) has been expanding for the past years. EVs are the ideal substitutes for ordinary petroleum product vehicles to mitigate natural contamination because of carbon discharge [1]. It is ordinarily acknowledged that huge usage of EVs will produce a technical confront for the power system, especially at residential distribution system where high EV concentrations cause different unfavourable impacts [2]. More specifically, the low-voltage distribution system operation becomes challenging since unmanaged EV charging typically coincides with the peak residential consumption, resulting in a considerable peak load and severe voltage deviations in addition to growing the possibility of blackouts due to system overloads [3-5]. In order to overcome these difficulties, smart charging management is getting to be critical, since the scheduling of uncoordinated charging could influence the grid’s working performance and increase the cost of operation, mainly with the development of EV entrances. The Main aim of Smart Load Management (SLM) is to manage EV charging scheduling to accomplish peak demand shaving, enhance voltage profile, and reduce power losses. Based on a priority selection scheme SLM also consider the EV proprietor's preferred charging time zones.
The use of controlled and optimized scheduling can alleviate the need for capacity upgrades by deriving the energy required for charging during off-peak times. Many studies have been performed on managing EVs’ charging behaviours in a variety of ways to lessen the harmful impacts on the power system [6]. The effect of EVs on the dispersion framework will rely upon the quantity of EVs and the charging plan used. The most customary charging plan is to attach to the vehicle and get it charged like any other regular load. These are frequently called uncoordinated or dump charging. This method is not controlled and planned. The main drawback of uncontrolled charging method is increasing peak power, component overloading, voltage deviations, electricity cost increases.
In order to avoid the problem in uncoordinated charging method, coordinated charging method is developed. In this method, EV is charged when the grid permits, changing the load from peak to off-peak periods. Different coordinated and uncoordinated charging techniques are available in the literature. An accepted method for allocating EVs charging at the off-peak hours is the valley filling and peak shaving control strategies. In this approach, EVs are managed to charge when the load demand is little. Setting up EVs demand to fill during the night, non-EVs demand “valley” reduces the electricity production costs [7] and thus the price of EVs charging. A decentralized charging control algorithm was introduced by Chen et al. [8], later the valley filling approach. Each EV defines its hold charging rate iteratively based on control signals broadcasted by a distribution system operator. These signals emulate the valley level of the load demand curve and directs the EVs charging choices. The coordination of EVs recharging resulted in reducing the power losses using high uptake of EVs without network constraints infringement. Singh et al. [9] followed a valley filling and peak shaving charging control methods. The EVs’ batteries were used as distributed energy storage systems to save the node voltage within the prescribed limits. This can be done using Fuzzy Logic Controllers (FLC) to stabilize the grid. Gan et al. [10] proposed a decentralised algorithm to optimally schedule EVs charging. The elasticity of EV loads was used to achieve a valley filling effect.
The EV charging scheduling plan was organized as an optimisation problem, aiming to reduce the demand curve. An iteratively process was engaged to manage EVs to charge according to control signals from system operator. After each iteration, the utility was adjusting the control signals based on the aggregated demand from the defined EVs charging schedules. The optimal charging profiles resulted in a valley filling effect on the non-EVs electricity demand curve. Additionally, many control strategies intend at reducing the power losses and getting better voltage profiles. A real-time EVs charging scheduling algorithm was proposed by Chan and Luo that directs the EVs charging to lessen system losses and to remain voltage between prescribed limits [11]. A real-time coordinated EVs charging method [12] was proposed by taking into the consideration of the EV owner favoured charging time and pricing zone. Shaaban et al. introduced a real-time coordinated charging method [13, 14] based on moving time window. The impacts of EV battery charging profiles on the performance of smart grid distribution systems and on the residential system are explained by Masoum and Sortomme in their works [15, 16]. A planned charging is proposed by Nyns et al. [17] to reduce distribution system losses and to maximize the main grid load factor. Smart EV recharging method is introduced [18] for smart homes/buildings with a PV system according to user choices.
The first objective of this research work is to study the impact of uncoordinated charging of EV’s in residential distribution system and highlights undesired effects such as low voltage profiles, overloading of lines .The second objective of this work is to application of the smart load management recharging of EV’s in the same distribution system to alleviate the undesirable effects of uncoordinated charging of EV’s .
The organization of the paper is as follows: Next section gives Residential distribution system and sections 3 & 4 presents implementation of uncoordinated charging of EV’s. The proposed method is presented in section 5. Results of the proposed algorithm are presented in section 6. Last section is the brief concluding section.
The distribution system under consideration is shown in Figure 1.
Figure 1. Residential distribution system
The system consists of one distribution transformer, two feeders, and twenty houses. Eight consumers are connected to feeder1 and twelve consumers are connected to feeder 2. The rating of the transformer is 150 KVA. EV battery chargers are typically connected to the residential distribution system for charging. Assume that EV battery chargers are unidirectional i.e. power flow from grid to vehicle only. Uncoordinated charging of EV will impact the distribution system voltage as well as overloading of distribution transformer. Accurate prediction of EV impact on power system is very much important for the entire stakeholders, specifically automotive manufacturers, consumers, and more prominently for the EVs using companies mostly at the distribution level. The household load, EV load data, EV User profile, share of EV, Distribution system data and distribution system constraints are required to know the impact of EV on the distribution system under consideration.
2.1 Residential load data
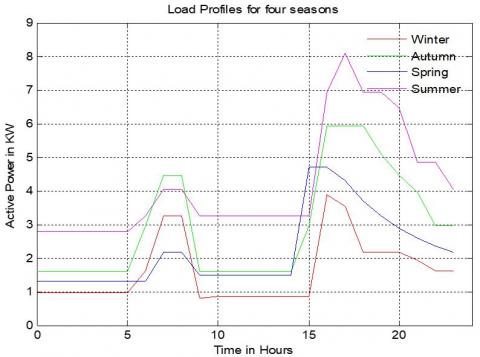
The usage of household energy for a chosen area changes with respect to time of the year and the typical conditions of the weather. Four different profiles are used to carry the work such as summer, autumn, winter and spring. Table 1 shows a 24-hour period for each profile and the details of the load. Figure 2 shows graphical representation of the load profiles for four different seasons. From Figure 2 it is observed that summer season is the most power demanding season.
Table 1. Season wise daily load data
|
Time |
Winter (KW) |
Autumn (KW) |
Summer (KW) |
Spring (KW) |
|
0.00 |
0.97 |
1.58 |
2.77 |
1.29 |
|
1.00 |
0.97 |
1.58 |
2.77 |
1.29 |
|
2.00 |
0.97 |
1.58 |
2.77 |
1.29 |
|
3.00 |
0.97 |
1.58 |
2.77 |
1.29 |
|
4.00 |
0.97 |
1.58 |
2.77 |
0.29 |
|
5.00 |
0.97 |
1.58 |
2.77 |
0.29 |
|
6.00 |
1.62 |
2.97 |
3.24 |
0.29 |
|
7.00 |
3.24 |
4.45 |
4.04 |
0.16 |
|
8.00 |
3.24 |
4.45 |
4.04 |
0.16 |
|
9.00 |
0.81 |
1.58 |
3.24 |
0.48 |
|
10.00 |
0.86 |
1.58 |
3.24 |
0.48 |
|
11.00 |
0.86 |
1.58 |
3.24 |
0.48 |
|
12.00 |
0.86 |
1.58 |
3.24 |
0.48 |
|
13.00 |
0.86 |
1.58 |
3.24 |
0.48 |
|
14.00 |
0.86 |
1.58 |
3.24 |
0.48 |
|
15.00 |
0.86 |
2.97 |
3.24 |
0.71 |
|
16.00 |
3.88 |
5.93 |
6.93 |
0.71 |
|
17.00 |
3.53 |
5.93 |
8.09 |
4.31 |
|
18.00 |
2.16 |
5.93 |
6.93 |
0.70 |
|
19.00 |
2.16 |
5.08 |
6.93 |
0.24 |
|
20.00 |
2.16 |
4.45 |
6.47 |
0.88 |
|
21.00 |
1.94 |
3.95 |
4.85 |
0.59 |
|
22.00 |
1.62 |
2.97 |
4.85 |
0.35 |
|
23.00 |
1.62 |
2.97 |
4.04 |
2.16 |
2.2 Electric Vehicle (EV) data
Three types of EV battery chargers are available in the market. Typically, Level 1 charging is a low cost onboard charger which requires long charging time. Level 2 charging has a balanced performance whose volume and charging time are moderate. Its cost is higher than Level 1 charging. Level 3 charging is mostly used in large power and fast charging systems. It is intended for commercial and public applications, as a filling station but of high cost. Nissan Leaf EV is used in the simulation because of its popularity. Specifications of Nissan Leaf EV are given in Table 2.
Figure 2. Load profile for each residence without EV load
Table 2. Specifications of Nissan Leaf EV
|
S.no |
Parameter |
Value |
|
1 |
Battery Capacity |
21 KWh |
|
2 |
absolute zero of the battery |
0 |
|
3 |
Energy consumption per km |
0.12 Kwh/km |
|
4 |
Driving distance on a fully charged battery |
175 km |
|
5 |
Active power of charger |
3.3 KW |
|
6 |
maximum state of charge |
100% |
|
7 |
Minimum state of charge |
0% |
|
8 |
Charge efficiency |
93% |
2.3 Connection and disconnection of EV to distribution network
The parameters such as user profiles, an estimated daily recharge rate and share of EVs which are used to determine the totalpower consumed to charge EVs, are defined in this section. The following 4 user profiles are considered in this work.
EV user1: Normal family with frequent and unpredictable EV usage. This user is connected to the network from 16.00 to18.00 and 22.00 to 05.00.
EV user 2: Single user. User is connected to the network from 16.00 to 06.00.
EV user 3: Unemployed user. This type of user connected to the network from 00.00 to 10.00 and 14.00 to 17.00.
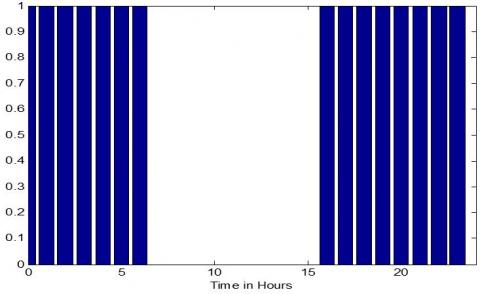
EV user 4: Night Worker. This user is connected to the network from 07.00 to 19.00. Graphical representation of different connection and disconnection times of the four EV profiles are shown from Figure 3 to Figure 6. 0 represents the disconnection and 1 indicates the connection to the network.
Different probabilities assigned to different profiles are shown in Table 3.
Table 3. Probabilities of different users
|
Type of profile |
Probability |
|
Profile 1 |
50% |
|
Profile 2 |
35% |
|
Profile3 |
10% |
|
Profile 4 |
5% |
Figure 3. EV profile 1 connection and disconnection time
Figure 4. EV profile 2 connection and disconnection time
Figure 5. EV profile 3 connection and disconnection time
Figure 6. EV profile 4 connection and disconnection time
2.4 Distribution system constraints
Three main constraints of distribution system are voltage, current and active power. All these parameters should be within the limits for satisfactory performance of distribution system. The Constraint Equations are given below
Vmin≤Vrated≤Vmax (1)
Load current should be less than rated current of lines
Iload≤Iline (2)
Total load profile is less than the transformer power limit
PL≤Ptransformer (3)
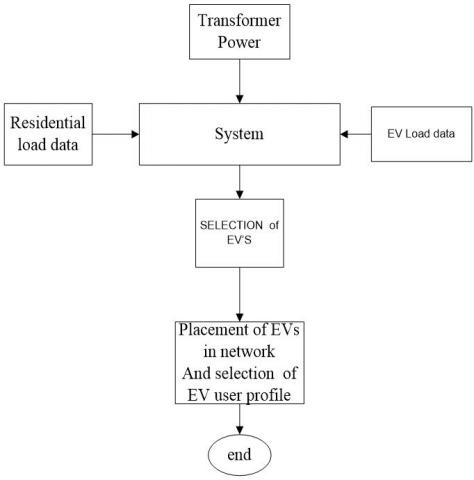
The mainly used standard charging method of EV is to connect the vehicle and get it charged similar to any other regular load which is often called dumb charging. In the process of Dumb charging EV owners charge their EVs at any time. Normally the charging starts at the time they get home. When the EVs are plugged into the mains, the charging begins. So the dumb charging is not controlled and planed. Figure 7 shows the flowchart for uncoordinated charging. MATLAB code is developed for uncoordinated charging. Number of EVs and season of year is input to the programme. This algorithm places the selected number of EVs in distribution system randomly. EVs profiles are selected. Charging power, State of Charge (SOC), the season of year is manually selected. This algorithm keeps the EVs arbitrarily in the network with a specified user profile.
Figure 7. Flowchart for unplanned charging
The parameters such as Number of EVs, and recharging power are manually picked. This algorithm keeps the Electric vehicles randomly into the network. 2 EV’s and charging power 3.3 KW are selected as input. Assume that penetration level is 10%. Table 4 shows the residence with EV and user profile selected and Table 5 shows the 24-hour Load profile without EV.
Table 4. Residence with EV’s and user profiles
|
Residence with 1st EV |
Residence 5 |
|
Residence with 2nd EV |
Residence 9 |
|
User profile 1 |
2nd profile |
|
User profile 2 |
3rd profile |
Table 5. Load profile of one residence without EV
|
Hour |
Power (KW) |
Hour |
Power (KW) |
|
00.00 |
2.77 |
12.00 |
3.24 |
|
01.00 |
2.77 |
13.00 |
3.24 |
|
02.00 |
2.77 |
14.00 |
3.24 |
|
03.00 |
2.77 |
15.00 |
3.24 |
|
04.00 |
2.77 |
16.00 |
6.93 |
|
05.00 |
2.77 |
17.00 |
8.09 |
|
06.00 |
3.24 |
18.00 |
6.93 |
|
07.00 |
4.04 |
19.00 |
6.93 |
|
08.00 |
4.04 |
20.00 |
6.47 |
|
09.00 |
3.24 |
21.00 |
4.85 |
|
10.00 |
3.24 |
22.00 |
4.85 |
|
11.00 |
3.24 |
23.00 |
4.04 |
Table 6 & 7 shows the load profiles of house 5 & 9 after connection of EV. From Table 6, it is observed that power demand is increased during 00.00 to 02.00 AM and 16.00 to18.00 hours. From Table 7, it is observed that power demand is increased during 00.00 to 02.00 AM and 14.00 to16.00 hours.
Table 6. Load profile of residence 5 after the connection of EV
|
Hour |
Power (KW) |
Hour |
Power (KW) |
|
00.00 |
6.07 |
12.00 |
3.24 |
|
01.00 |
6.07 |
13.00 |
3.24 |
|
02.00 |
6.07 |
14.00 |
3.24 |
|
03.00 |
2.77 |
15.00 |
3.24 |
|
04.00 |
2.77 |
16.00 |
10.23 |
|
05.00 |
2.77 |
17.00 |
11.39 |
|
06.00 |
3.24 |
18.00 |
10.23 |
|
07.00 |
4.04 |
19.00 |
6.93 |
|
08.00 |
4.04 |
20.00 |
6.47 |
|
09.00 |
3.24 |
21.00 |
4.85 |
|
10.00 |
3.24 |
22.00 |
4.85 |
|
11.00 |
3.24 |
23.00 |
4.04 |
Table 7. Load profile of residence 9 after the connection of EV
|
Hour |
Power (KW) |
Hour |
Power (KW) |
|
00.00 |
6.07 |
12.00 |
3.24 |
|
01.00 |
6.07 |
13.00 |
3.24 |
|
02.00 |
6.07 |
14.00 |
6.54 |
|
03.00 |
2.77 |
15.00 |
6.54 |
|
04.00 |
2.77 |
16.00 |
10.23 |
|
05.00 |
2.77 |
17.00 |
8.09 |
|
06.00 |
3.24 |
18.00 |
6.93 |
|
07.00 |
4.04 |
19.00 |
6.93 |
|
08.00 |
4.04 |
20.00 |
6.47 |
|
09.00 |
3.24 |
21.00 |
4.85 |
|
10.00 |
3.24 |
22.00 |
4.85 |
|
11.00 |
3.24 |
23.00 |
4.04 |
Connection status of EV at residence 5 and residence 9 are given in the Table 8 & 9 respectively.
Table 8. Connection status at residence 5
|
Time in Hours |
Connect/ Disconnect |
Time in Hours |
Connect/ Disconnect |
|
00.00 |
1 |
12.00 |
0 |
|
01.00 |
1 |
13.00 |
0 |
|
02.00 |
1 |
14.00 |
0 |
|
03.00 |
0 |
15.00 |
0 |
|
04.00 |
0 |
16.00 |
1 |
|
05.00 |
0 |
17.00 |
1 |
|
06.00 |
0 |
18.00 |
1 |
|
07.00 |
0 |
19.00 |
0 |
|
08.00 |
0 |
20.00 |
0 |
|
09.00 |
0 |
21.00 |
0 |
|
10.00 |
0 |
22.00 |
0 |
|
11.00 |
0 |
23.00 |
0 |
Table 9. Connection status at residence 9
|
Time in Hours |
Connect/ Disconnect |
Time in Hours |
Connect/ Disconnect |
|
00.00 |
1 |
12.00 |
0 |
|
01.00 |
1 |
13.00 |
0 |
|
02.00 |
1 |
14.00 |
1 |
|
03.00 |
0 |
15.00 |
1 |
|
04.00 |
0 |
16.00 |
1 |
|
05.00 |
0 |
17.00 |
0 |
|
06.00 |
0 |
18.00 |
0 |
|
07.00 |
0 |
19.00 |
0 |
|
08.00 |
0 |
20.00 |
0 |
|
09.00 |
0 |
21.00 |
0 |
|
10.00 |
0 |
22.00 |
0 |
|
11.00 |
0 |
23.00 |
0 |
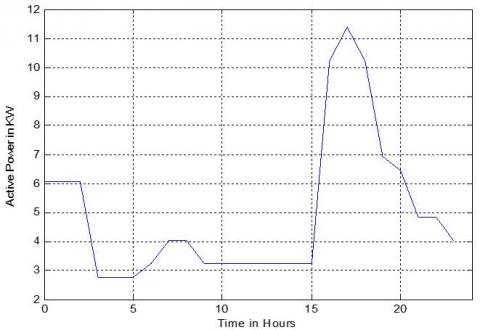
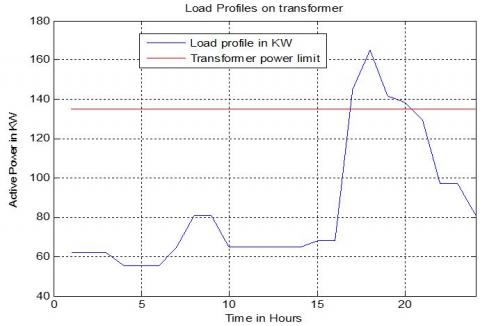
From Figure 8 & 9, it is noted that 16th hour of the day is peak hour. In general, the transformer is hardly able to supply the given distribution system in power demanding periods without EVs in the network. The addition of EV’s into the distribution system, overloads feeder 2 and distribution transformer. The proposed method is able to reduce overloading of the transformer and able to maintain the voltages within limits. From Figure 10, it is observed that during 17-00 hours to 20-00 hours load on transformer is more than transformer power limit. Red line indicates the transformer power limit. Transformer is overloaded because of unplanned charging of electric vehicles.
Figure 8. Daily load curve of residence 5 after the connection of EV
Figure 9. Daily load curve of residence 9 after the connection of EV
Figure 10. Total load profile and transformer power limit
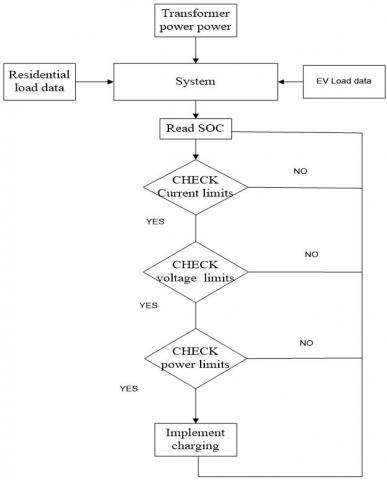
Figure 11. Flowchart for proposed smart load management method
The proposed hour-based Smart Loading Management (SLM) algorithm uses the same input data as used in uncoordinated charging and reschedules the charging of EV’s if needed. The flowchart of smart load management (SLM) algorithm is shown in Figure 11.
First, the State of charge (SOC) of each EV is calculated, which decides time of recharging for each EV. In the next step of constraints monitoring, all the constraints of the distribution system must be fulfilled before the vehicle is scheduled for recharging. This algorithm checks the load currents and voltages at each residence. Two EVs are used in the simulation. One EV is placed at residence5 and the other EV is placed at residence 9. The output currents at residence 5 & 9 are presented in Tables 10 and 11, respectively.
Table 10. Currents at residence 5 after the connection of EV
|
Hour |
Current (A) |
Hour |
Current (A) |
|
00.00 |
16.9300 |
12.00 |
9.0368 |
|
01.00 |
16.9300 |
13.00 |
9.0368 |
|
02.00 |
16.9300 |
14.00 |
9.0368 |
|
03.00 |
7.7259 |
15.00 |
9.0368 |
|
04.00 |
7.7259 |
16.00 |
28.5328 |
|
05.00 |
7.7259 |
17.00 |
31.7682 |
|
06.00 |
9.0368 |
18.00 |
28.5328 |
|
07.00 |
11.2681 |
19.00 |
19.3287 |
|
08.00 |
11.2681 |
20.00 |
18.0457 |
|
09.00 |
9.0368 |
21.00 |
13.5273 |
|
10.00 |
9.0368 |
22.00 |
13.5273 |
|
11.00 |
9.0368 |
23.00 |
11.2681 |
Table 11. Currents at residence 9 after the connection of EV
|
Hour |
Current (A) |
Hour |
Current(A) |
|
00.00 |
16.9300 |
12.00 |
9.0368 |
|
01.00 |
16.9300 |
13.00 |
9.0368 |
|
02.00 |
16.9300 |
14.00 |
18.2409 |
|
03.00 |
7.7259 |
15.00 |
18.2409 |
|
04.00 |
7.7259 |
16.00 |
28.5328 |
|
05.00 |
7.7259 |
17.00 |
22.5641 |
|
06.00 |
9.0368 |
18.00 |
19.3287 |
|
07.00 |
11.2681 |
19.00 |
19.3287 |
|
08.00 |
11.2681 |
20.00 |
18.0457 |
|
09.00 |
9.0368 |
21.00 |
13.5273 |
|
10.00 |
9.0368 |
22.00 |
13.5273 |
|
11.00 |
9.0368 |
23.00 |
11.2681 |
Figure 12. Total load profile and transformer power limit
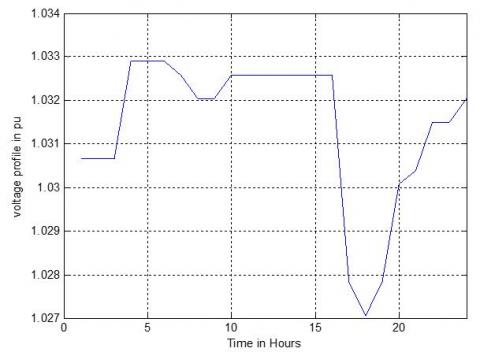
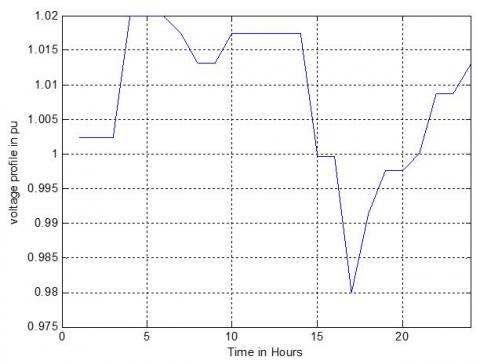
Proposed Smart Load Management is simulated in MATLAB and results have been presented in Figure 12 to Figure 14. From Figure 12, it is observed that load on transformer is less than transformer power limit. Transformer is not overloaded due to the adjustment of EV’s to satisfy the constraints of distribution system. Figures 13 and 14 show the voltage profiles of residence 5 and 9 respectively. It is noted that voltages are within the prescribed limits. Results have been presented for 10% penetration level. This proposed method able to adjust the charging time of electric vehicles to satisfy the distribution system constraints.
Figure 13. Voltage profile in p.u at residence 5
Figure 14. Voltage profile in p.u at residence 9
EV’s are expected to become a method of electrification of road transportation due to technological advancements and demand for eco-friendly energy solutions. The expanding utilization of these vehicles will make a challenge to the current framework of the electrical power system as far as the generation, transmission, more importantly distribution. The higher penetration characteristics of EVs and their uncoordinated charging may bring new peaks into the system, which can have the probability to overload the components of electrical distribution systems and cause voltage fluctuation problems. Proposed algorithm will help to reduce the voltage problems and overloading of transformer without changing the distribution system infrastructure. This research work can be improved further in terms of the following aspects. Development of demand side management (DSM) algorithms to minimize the effects of charging of electric vehicles and investigation of solar system integration with residential distribution system in presence of charging and discharging of electric vehicles.
[1] Hannan, M.A., Azidin, F.A., Mohamed, A. (2014). Hybrid electric vehicles and their challenges: A review. Renewable Sustainable Energy Reviews, 29: 135-150. https://doi.org/10.1016/j.rser.2013.08.097
[2] Masoum, A.S., Deilami, S., Moses, P.S., Masoum, M.A.S., Abu-Siada, A. (2011). Smart load management of plug-in electric vehicles in distribution and residential networks with charging stations for peak saving and loss minimisation considering voltage regulation. IET Generation. Transmission Distribution, 5: 877-888. https://doi.org/10.1049/iet-gtd.2010.0574
[3] Qian, K.J., Zhou, C.K., Yuan, Y. (2015). Impacts of high penetration level of fully electric vehicles charging loads on the thermal ageing of power transformers. International Journal of Electrical Power Energy Systems, 65: 102-112. https://doi.org/10.1016/j.ijepes.2014.09.040
[4] Leou, R.C., Su, C.L., Lu, C.N. (2014). Stochastic analyses of electric vehicle charging impacts on distribution network. IEEE Transactions on Power Systems, 29(3): 1055-1063. https://doi.org/10.1109/TPWRS.2013.2291556
[5] Staats, P.T., Grady, W.M., Arapostathis, A., Thallam, R.S. (1998). A statistical analysis of the effect of electric vehicle battery charging on distribution system harmonic voltages. IEEE Trans. Power Deliv., 13(2): 640-646. https://doi.org/10.1109/61.660951
[6] Richardson, P., Flynn, D., Keane, A. (2012). Optimal charging of electric vehicles in low voltage distribution systems. IEEE Transactions on Power Systems, 27: 268-279. https://doi.org/10.3390/en7042449
[7] Karfopoulos, E.L., Hatziargyriou, N.D. (2013). A multi-agent system for controlled charging of a large population of electric vehicles. IEEE Transactions on Power Systems, 28(2): 1196-1204. https://doi.org/10.1007/s10462-016-9520-8
[8] Chen, N., Tan, C.W., Quek, T.Q.S. (2014). Electric vehicle charging in smart grid: Optimality and valley-filling algorithms. IEEE Journal of Selected Topics in Signal Processing, 8(6): 1073-1083. https://doi.org/10.1109/JSTSP.2014.2334275
[9] Singh, M., Kumar, P., Kar, I. (2013). A multi charging station for electric vehicles and its utilization for load management and the grid support. IEEE Transactions on Smart Grid, 4(2): 1026-1037. https://doi.org/10.1109/TSG.2013.2238562
[10] Gan, L., Topcu, U., Low, S.H. (2013). Optimal decentralized protocol for electric vehicle charging. IEEE Transactions on Power Systems, 28(2): 940-951. https://doi.org/10.3390/en10091333
[11] Chan, K.W., Luo, X. (2014). Real-time scheduling of electric vehicles charging in low-voltage residential distribution systems to minimise power losses and improve voltage profile. IET Generation Transmission and Distribution, 8(3): 516-529. https://doi.org/10.1049/iet-gtd.2013.0256
[12] Deilami, S., Masoum, A.S., Moses, P.S., Masoum, M.S. (2011). Real time coordination of plug-in electric vehicle charging in smart grids to minimize power losses and improve voltage profile. IEEE Transactions on Smart Grid, 2(3): 456-467. https://doi.org/10.1109/TSG.2011.2159816
[13] Shaaban, M.F., Ismail, M., El-Saadany, E.F. (2014). PEVs real-time coordination in smart grid based on moving time window. IEEE PES General Meeting Conference & Exposition, pp. 1-5. https://doi.org/10.1109/PESGM.2014.6939926
[14] Shaaban, M.F., Ismail, M., El-Saadany, E.F., Zhuang, W. (2014). Real time PEV charging/discharging coordination in smart distribution systems. IEEE Trans. on Smart Grid, 5(4). https://doi.org/10.1109/TSG.2014.2311457
[15] Masoum, A.S., Deilami, S., Moses, P.S., Abu-Siada, A. (2010). Impacts of battery charging rates of plug-in electric vehicle on smart grid distribution systems. IEEE PES Innovative Smart Grid Technologies Conf. Europe, ISGT Europe, pp. 1-6. https://doi.org/10.1109/ISGTEUROPE.2010.5638981
[16] Sortomme, E., Hindi, M.M., James, S.D., Mac Pherson, Venkata, S.S. (2011). Coordinated charging of plug-in hybrid electric vehicles to minimize distribution system losses. IEEE Transactions on Smart Grid, 2(1). https://doi.org/10.1109/TSG.2010.2090913
[17] Nyns, K., Haesen, E., Driesen, J. (2010). The impact of charging plug-in hybrid electric vehicles on a residential distribution grid. IEEE Trans. Power Syst., 25: 371-380. https://doi.org/10.1109/TPWRS.2009.2036481
[18] Wi, Y.M., Lee, J.U., Joo, S.K. (2013). Electric vehicle charging method for smart homes/buildings with a photovoltaic system. IEEE Transactions on Consumer Electronics, 59(2): 323-328. https://doi.org/10.1109/TCE.2013.6531113