Weizhe Mu
OPEN ACCESS
In recent years, cross-border e-commerce platforms have become an important way for Chinese consumers to buy overseas products. This paper aims to find out the main influencing factors of the consumer behavior on cross-border e-commerce platforms, and predict the purchase decisions of food product on these platforms. Firstly, twelve factors that may affect the purchase decisions of consumers on cross-border e-commerce platforms were selected, and subjected to big data analysis. Seven of them were found to have a significant impact on consumer behavior on the said platforms. Next, a multilayer perceptron (MLP) was constructed to evaluate the importance of each influencing factor to the purchase decisions. The fuzzy weights of the most important factors were determined by an improved frequent-pattern (FP) growth algorithm. Finally, a purchase decision prediction model was established for consumers on cross-border e-commerce platforms, and successfully applied to predict the purchase decisions over 6 categories of products on such platforms.
big data, purchase decision, prediction, cross-border e-commerce platform, multilayer perceptron (MLP)
With the growing popularity of the Internet, the online shopping market in China is booming. Many e-commerce platforms have been established and improved, especially those on cross-border e-commerce (e.g. Amazon.cn and Tmall Global). The major cross-border e-commerce platforms are competing to seize more market shares by updating technical level and marketing strategy. This competition has gradually created a buyer’s market, i.e. a market favorable to consumers.
To sell more products, the enterprises on cross-border e-commerce platforms must cater to the needs of consumers. This requires an in-depth understanding of the market features of products and the purchasing features (e.g. trajectory and demand) of various consumers, and an accurate prediction of the consumer behavior on cross-border e-commerce platforms.
For consumers, the shopping process, whether online or physical, generally includes the following steps: creating interest, searching for information, evaluating available products, making purchase decisions, and evaluating the purchased products. The most important step is undoubtedly the making of purchase decisions.
Online shopping is highly digitalized and virtualized. The purchase decisions of online shopping are influenced by numerous factors, ranging from sociology, psychology, organizational behavior to statistics. As a result, the consumer behavior of online shopping is much more complex than that of physical shopping.
Therefore, this paper attempts to find out the main influencing factors of the consumer behavior on cross-border e-commerce platforms, and to predict the purchase decisions of food product on these platforms.
The purchase decisions of online shopping are usually predicted by extracting the login process and cycle of consumers from existing data resources, and projecting their future decisions and behavior based on the extracted data [1, 2]. The analysis and prediction of consumer behavior in online shopping help enterprises to grasp the purchase features, trends and intentions of consumers.
So far, researchers have mainly relied on the login data of consumers to analyze the purchase decisions and consumer behavior on e-commerce platforms. Chen et al. [3] examined the clickstream data in the server log of an enterprise on an e-commerce platform, and determined whether consumers want to view the webpage or exit after the login. Kim et al. [4] also studied the online access and purchase behavior of consumers based on the clickstream, and measured the browsing time of each website, revealing that the access frequency is positively correlated with the purchase intention. Bag et al. [5] mined the browsing data in weblogs, and output complete data on consumer behavior. Zhang et al. [6] evaluated the competing enterprises of e-commerce platforms, in the light of consumer behavior data from weblogs.
In recent years, machine learning methods [7, 8] have been increasingly applied to analyze the predict consumer behavior. For example, Sohrabi et al. [9] designed a method to analyze the preference and other features of consumers in online shopping. The method identifies the browsing path of consumers, using neural network (NN) and the k-means clustering (KMC). Guo et al. [10] adopted the Apriori algorithm, an association rule learning strategy, to determine the consumer preference path. Tsai et al. [11] proposed an NN model based on radial-basis function (RBF) to disclose the relationship between consumer features and consumer interest. Based on the login data and transaction data of consumers, Choi et al. [12] designed a Markov chain model to predict consumer behavior. Zeng et al. [13] presented an active consumer behavior prediction model based on weighted Markov chain, which estimates the consumer behavior through optimal classification of the state. Drawing on rough set theory, Wang et al. [14] obtained a new prediction method of consumer behavior on e-commerce platforms, after reducing the attributes of the prediction conditions with the aid of discernibility matrix. Chun et al. [15] extracted association rules from weblogs by the rough set of discernibility matrix, and then analyzed consumer behavior and predicted the purchase decisions.
Similarly, semantics have also been frequently employed to predict consumer behavior. For instance, Li et al. [16] explored consumer behavior analysis and prediction based on web mining and domain ontology, and introduced ontology to improve the timeliness and accuracy of commerce recommendations. Ashraf et al. [17] proposed an ontology that reflects the semantics of consumer behavior, and used it to classify the knowledge and basic concepts of consumer behavior. Tao et al. [18] mined the knowledge of consumer behavior based on web network, built the ontology of network consumption knowledge, and applied the ontology to make personalized recommendations to consumers.
The rapid growth of e-commerce has generated a large amount of consumer data. Many large e-commerce platforms face the problem of information overload. To solve the problem, more and more solutions have emerged based on big data analysis. Yu et al. [19] developed a Hadoop-based consumer behavior analysis system, which can acquire consumer behavior and process a large amount of relevant data. Ren et al. [20] introduced the Hadoop-based parallel KMC in cloud computing environment, and detailed the design plan and strategy of this method.
To sum up, the existing studies on consumer behavior in online shopping mainly predict purchase decisions based on the information of individual consumer (e.g. preferences, habits and emotions) and the interaction between consumers. Most traditional methods cannot deal with the huge amount of data on consumer behavior in online shopping. The prediction models trained by historical data on consumers are unable to mine the influencing factors of purchase decisions in online shopping.
Twelve factors that may affect the purchase decisions of consumers on cross-border e-commerce platforms were selected through literature review and comprehensive analysis. These potential influencing factors include: the economy of the living area of consumers (ECO), the culture of the living area of consumers (CUL), the personal preference of consumers (PRE), the discount rate (DIS), the category of product (CAT), the price of product (PRI), the quality of product (QUA), the shop rating (RAT), the convenience of online shopping (CON), the total number of comments (COM), the number of pure-text comments (TEX) and the number of comments with pictures (PIC).
The research data were collected from 64 kinds of food products sold on Tmall Global from January 15 to December 15, 2018. The private information was filtered out from the data, leaving only the information about consumers, products and consumer behavior.
In each month, over 30,000 pieces of data were collected, involving 2,600 products. There were 29,936 pieces of data after the exclusion of those on failed transactions. To ensure data validity, the data with zero sales volume were also removed. Thus, 22,612 pieces of valid data were obtained. In total, the research data of product and transaction include 311,675 pieces.
3.1 Regression analysis
The research data were firstly subjected to descriptive statistical analysis. The results show that the online sales volume of food products peaked at 69,372, and averaged at 302.45. Thus, the food products from Tmall Global are very popular among consumers, and consumers are spending a growing portion of income on this cross-border e-commerce platform. Table 1 lists the Pearson correlation coefficients (PCCs) between the 12 factors and sales volume.
Table 1. The PCCs between the 12 factors and sales volume
|
Possible influencing factors |
Abbreviations |
The PCC |
|
The economy of the living area of consumers |
ECO |
0.259 |
|
The culture of the living area of consumers |
CUL |
-0.006 |
|
The personal preference of consumers |
PRE |
0.336 |
|
The discount rate |
DIS |
0.009 |
|
The category of product |
CAT |
-0.079 |
|
The price product |
PRI |
-0.087 |
|
The quality of product |
QUA |
0.692 |
|
The shop rating |
RAT |
0.366 |
|
The convenience of online shopping |
CON |
0.085 |
|
The total number of comments |
COM |
0.285 |
|
The number of pure-text comments |
TEX |
0.510 |
|
The number of comments with pictures |
PIC |
0.326 |
As shown in Table 1, the PCC between ECO and sales volume was 0.259. There is a significant positive correlation between the two factors. The better the economy of their living area, the more likely for consumers to purchases products on the cross-border e-commerce platform.
The PCC between CUL and sales volume was -0.006, revealing a weak correlation between the two factors. Hence, the sales volume has little to do with the culture of the living areas of consumers on the cross-border e-commerce platform.
The PCC between PRE and sales volume was 0.336, a sign of the significant positive correlation between the two factors. This means the products preferred by the consumers can be sold easily on the cross-border e-commerce platform. The personal preference may vary from product to product.
The PCC between DIS and sales volume was 0.009, indicating a weak correlation between the two factors. In other words, the consumers on the cross-border e-commerce platform make purchase decisions without thinking much of the discount rate.
The PCC between CAT and sales volume was -0.079, that is, the two factors have a significant negative correlation. Different types of products are sold in different volumes on the cross-border e-commerce platform.
The PCC between PRI and sales volume was -0.087, reflecting the great suppression effect of product price on sales volume. The higher the product price, the fewer the product is purchased by consumers on the cross-border e-commerce platform.
The PCC between QUA and sales volume was 0.0692. Thus, there is a significant positive correlation between product quality and sales volume. The products with good quality are immensely popular among consumers on the cross-border e-commerce platform.
The PCC between RAT and sales volume was 0.366, which signifies the significant positive correlation between the two factors. The shops with high ratings tend to attract many consumers and sell lots of products on the cross-border e-commerce platform.
The PCC between CON and sales volume was 0.085, showing that the convenience of online shopping can greatly promote the sales volume. For example, the products with packaging and free shipping services are sold in high volumes on the cross-border e-commerce platform.
The PCC between COM and sales volume was 0.285. Thus, the total number of comments has a significant positive correlation with sales volume. The consumers on the cross-border e-commerce platform tend to purchase the products with many comments.
The PCC between TEX and sales volume was 0.510, an evidence to the significant positive correlation between the two factors. The products with numerous pure-text comments are sold in huge volumes on the cross-border e-commerce platform.
The PCC between PIC and sales volume was 0.326, i.e. the two factors have a significant positive correlation. On the cross-border e-commerce platform, consumers are very like to purchase products with many comments with pictures.
Table 2 displays the results of the analysis of variance (ANOVA) on the 12 potential influencing factors. The results show that, when the decision coefficient was 0.751, the F-value stood at 97.274, and the p-value was smaller than 0.01. Therefore, the regression equation has a good fitting effect, and the explained variable could be interpreted well by the explanatory variable. Through the above analysis, the multicollinearity and the heteroscedasticity of residuals were excluded.
The final regression results are shown in Table 3. It can be seen that the purchase decisions of consumers on the cross-border e-commerce platform are significantly affected by ECO, PRE, CAT, PRI, RAT, COM, TEX and PIC, but not greatly influenced by CUL, PRI, CON or DIS.
Table 2. ANOVA results
|
Source of variance |
Sum of squares |
df |
Mean square |
F |
Sig. |
|
Between groups |
3.759E10 |
14 |
3.146E9 |
97.274 |
0.0001 |
|
Within groups |
2.887E10 |
20,764 |
143,702.356 |
|
|
|
Total |
6.646E10 |
20,778 |
|
|
|
|
Variables |
Non-standardized coefficient |
Standardized coefficient |
t |
Sig. |
Confidence interval |
||
|
|
B |
Standard error |
|
|
|
Lower limit |
Upper limit |
|
ECO |
66.703 |
12.858 |
0.023 |
4.689 |
0.000 |
39.002 |
92.749 |
|
CUL |
4.287 |
6.816 |
0.004 |
0.629 |
0.521 |
-9.18 |
17.92 |
|
PRE |
-15.736 |
0.268 |
-0.451 |
-60.26 |
0.000 |
-16.82 |
-15.87 |
|
DIS |
-4.392 |
16.986 |
-0.002 |
-0.283 |
0.782 |
-35.87 |
28.69 |
|
CAT |
-34.626 |
6.652 |
-0.023 |
-5.305 |
0.649 |
-49.02 |
-22.21 |
|
PRI |
-0.003 |
0.006 |
-0.002 |
-0.312 |
0.762 |
-0.012 |
0.008 |
|
QUA |
13.982 |
0.129 |
1.035 |
120.98 |
0.000 |
13.92 |
14.97 |
|
RAT |
8.902 |
6.665 |
0.005 |
1.339 |
0.069 |
-4.319 |
21.942 |
|
CON |
64.683 |
18.709 |
0.015 |
3.519 |
0.256 |
28.27 |
99.84 |
|
COM |
4.458 |
0.159 |
0.289 |
28.921 |
0.000 |
4.179 |
4.786 |
|
TEX |
0.009 |
0.003 |
0.017 |
1.962 |
0.000 |
0.000 |
0.016 |
|
PIC |
2.865 |
0.098 |
-0.287 |
-29.21 |
0.000 |
-3.112 |
-2.668 |
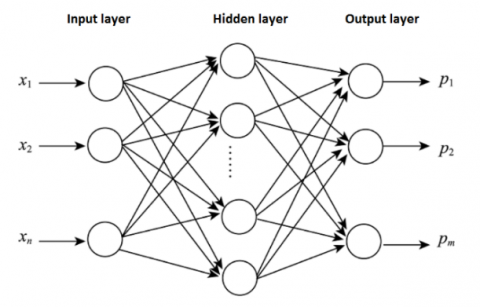
This section sets up a prediction model of the purchase decisions on cross-border e-commerce platforms, aiming to determine the sequence of products that are mostly wanted by consumers. To begin with, the multilayer perceptron (MLP) [21] was introduced to disclose the relationship between the influencing factors of purchase decisions. The MLP is a class of feedforward artificial NN trained by error backpropagation algorithm. Through continuous learning of input and output data, the MLP boasts a strong simulation ability for nonlinear systems. As shown in Figure 1, a three-layer MLP is established to simulate the purchase decisions on cross-border e-commerce platforms. The NN structure was designed to process any number of variables with any precision requirements.
Figure 1. The structure of the 3-layer MLP
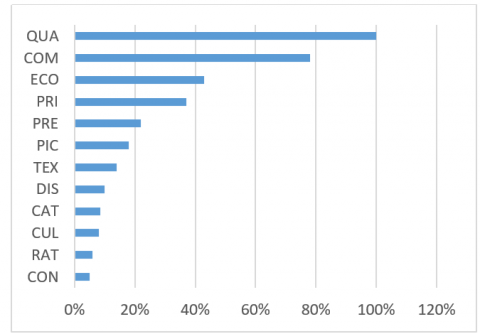
Figure 2. The importance of each input variable
The 311,675 pieces of data collected for our research were divided into three categories: 50% of them were randomly selected as training samples, 20% were taken as test samples, and 30% were reserved. The influencing factors were inputted into the MLP, which yields the sales volume of each product.
The importance of each input variable determined by the MLP is presented in Figure 2.
The MLP analysis shows that the leading influencing factors on consumer behavior on cross-border e-commerce platforms include QUA, COM, ECO, PRI and PRE.
Next, the traditional frequent-pattern (FP) growth algorithm was improved, and applied to mine the association rules between the five leading factors and the decisions to purchase the food products on cross-border e-commerce platforms. The FP growth algorithm was improved in the following steps:
Step 1. Transverse the item head of the FP-tree in a bottom-up manner to obtain all the prefix path of the current node. Then, take the current node as the suffix mode to get all the paths containing the node in the FP-tree.
Step 2. If a single path is obtained in Step 1, then combine each element of the prefix path and the suffix pattern, creating a frequent item set. Otherwise, find if the prefix path needs to be merged. If yes, merge the prefix path after pruning.
Step 3. Taking the obtained path as a new database, create a new PF-tree according to the FP-tree creation procedure. Note that the root node of the tree is the suffix mode, i.e. the mining item.
Step 4. Taking the generated tree as the data source of the input of Step 1, and repeat the above steps until a path is generated.
The whole process of FP-tree mining is completed through the above procedure. All the frequent item sets mined are closed ones. In this way, the search space of the closed item sets was optimized, the path of the tree was reduced, and the computing speed was accelerated.
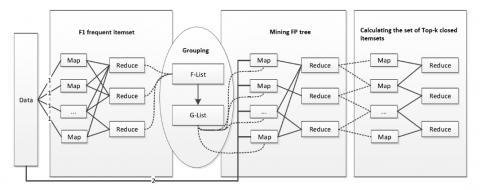
Facing the big data on cross-border e-commerce platforms, the traditional FP-growth algorithm was improved through MapReduce, distributed storage and local fusion. The improvement strategy is inspired by Hadoop. The implementation of MapReduce is illustrated in Figure 3 below
Figure 3. MapReduce implementation of the improved FP-Tree algorithm
As shown in Figure 3, grouping is implemented by counting the number of items m in each group:
$\mathrm{m}=\frac{|F|}{n}$
where, F is the number of items in the F-List set; n is the number of groups. Then, the items in each transaction data were traversed, and sorted according to the F-List set. Finally, the mapping number i of the items was looked up in the mapping table.
According to the MLP and the improved FP-growth algorithm, the fuzzy weight $\left(w_{i}^{-}, w_{i}^{+}\right)$ of each influencing factor was derived from historical transaction data. Specifically, the transaction data were mined by the improved FP-growth algorithm to obtain the association rules between each influencing factor and the CAT. The lower and upper limits of the fuzzy weight ( $w_{i}^{-}$ and $w_{i}^{+}$) were computed by finding the support degrees under the confidence of 1 and 0.5, respectively. Tables 4~8 show the fuzzy weights of QUA, COM, ECO, PRI and PRE, respectively.
Table 4. Fuzzy weights of QUA
|
QUA levels |
Fuzzy weights |
|
Excellent |
(0.7, 1.0) |
|
Good |
(0.7, 0.4) |
|
General |
(0.4, 0.2) |
|
Bad |
(0.2, 0.0) |
|
COM levels |
Fuzzy weights |
|
≤50 |
(0.0, 0.1) |
|
50-100 |
(0.1, 0.3) |
|
100-200 |
(0.3, 0.6) |
|
≥200 |
(0.6, 1.0) |
|
ECO levels |
Fuzzy weights |
|
Underdeveloped |
(0.0, 0.1) |
|
General |
(0.1, 0.4) |
|
Developed |
(0.4, 1.0) |
|
PRI levels |
Fuzzy weights |
|
≤100 |
(0.0, 0.2) |
|
100-500 |
(0.2, 0.4) |
|
500-10,000 |
(0.4, 0.8) |
|
≥1,000 |
(0.8, 1.0) |
|
PRE levels |
Fuzzy weights |
|
Like |
(1.0, 0.6) |
|
General |
(0.6, 0.2) |
|
Dislike |
(0.2, 0.0) |
The best and worst plans for the five influencing factors were defined respectively as:
$Z^{+}=\left(\left(\max \left(x_{i 1}^{-}\right), \max \left(x_{i 1}^{+}\right)\right),\left(\left(\max \left(x_{i 2}^{-}\right), \max \left(x_{i 2}^{+}\right)\right), \ldots\right.\right.\left(\left(\max \left(x_{i n}^{-}\right), \max \left(x_{i n}^{+}\right)\right)\right.$
$Z^{-}=\left(\left(\min \left(x_{i 1}^{-}\right), \min \left(x_{i 1}^{+}\right)\right),\left(\left(\min \left(x_{i 2}^{-}\right), \min \left(x_{i 2}^{+}\right)\right), \ldots\right.\right.\left(\left(\min \left(x_{i n}^{-}\right), \min \left(x_{i n}^{+}\right)\right)\right.$
Substituting the data in Table 9 into the above formulas, the best and worst plans for the five factors in our research can be obtained as:
$Z^{+}=((0.249,0.329),(0.229,0.384),(0.256,0.375)(0.322,0.407),(0.327,0.449))$
$Z^{-}=((0.108,0.122),(0.086,0.207),(0.133,0.211)(0.129,0.259),(0.103,0.218))$
Therefore, the six categories of products can be ranked as C2, C5, C6, C4, C3, C1 in descending order of their purchase probability by consumers on cross-border e-commerce platforms. In this way, the author successfully predicted the purchase decisions of consumers concerning food products on cross-border e-commerce platforms.
Table 9. Final decision matrix
|
CAT no. |
QUA |
COM |
ECO |
PRI |
PRE |
|
C1 |
(0.122,0.244) |
(0.086,0.212) |
(0.256,0.375) |
(0.322,0.386) |
(0.208,0.287) |
|
C2 |
(0.165,0.272) |
(0.124,0.248) |
(0.155,0.292) |
(0.227,0.269) |
(0.327,0.449) |
|
C3 |
(0.117,0.329) |
(0.138,0.384) |
(0.179,0.351) |
(0.222,0.407) |
(0.152,0.234) |
|
C4 |
(0.108,0.122) |
(0.128,0.244) |
(0.176,0.314) |
(0.237,0.314) |
(0.103,0.255) |
|
C5 |
(0.249,0.271) |
(0.126,0.326) |
(0.189,0.333) |
(0.129,0.259) |
(0.112,0.303) |
|
C6 |
(0.192,0.324) |
(0.229,0.207) |
(0.133,0.211) |
(0.262,0.272) |
(0.152,0.218) |
This paper develops a prediction model for the purchase decisions of consumers on cross-border e-commerce platforms. The model was designed based on the MLP and association rules. Firstly, the influencing factors of consumer behavior were determined and their importance to purchase decision-making were evaluated through big data analysis. Next, the weight of each leading influencing factor was obtained through the MLP and the improved FP-growth algorithm.
Finally, the proposed model was successfully applied to predict the purchase decisions on six categories of food products on cross-border e-commerce platforms.
This paper is supported by Planned Project of Philosophy and Social Sciences, Heilongjiang Province (Grant No.: 17GLE297).
[1] Sismeiro, C., Bucklin, R.E. (2004). Modeling purchase behavior at an e-commerce web site: A task-completion approach. Journal of Marketing Research, 41(3): 306-323. http://dx.doi.org/10.1509/jmkr.41.3.306.35985
[2] Karimi, S., Papamichail, K.N., Holland, C.P. (2015). The effect of prior knowledge and decision-making style on the online purchase decision-making process: A typology of consumer shopping behaviour. Decision Support Systems, 77: 137-147. https://doi.org/10.1016/j.dss.2015.06.004
[3] Chen, Y.W., Ma, J.W. (2012). E-commerce consumers purchase decision and its influencing factors. Advances in Psychological Science, 20(1): 27-34. http://dx.doi.org/10.3724/SP.J.1042.2012.00027
[4] Kim, M.J. (2017). How to promote e-commerce exports to china: An empirical analysis. Social Science Electronic Publishing, 39(2): 53-74. https://doi.org/10.23895/kdijep.2017.39.2.53
[5] Bag, S., Tiwari, M.K., Chan, F.T.S. (2019). Predicting the consumer's purchase intention of durable goods: An attribute-level analysis. Journal of Business Research, 94: S0148296317304770. https://doi.org/10.1016/j.jbusres.2017.11.031
[6] Zhang, H.Y., Ji, P., Wang, J.Q., Chen, X.H. (2016). A Neutrosophic normal cloud and its application in decision-making. Cognitive Computation, 8(4): 649-669. https://doi.org/10.1007/s12559-016-9394-8
[7] Ventos, V., Teytaud, O. (2018). Bridge: New challenge for artificial intelligence. Revue d'Intelligence Artificielle, 31(3): 249-279. https://doi.org/10.3166/RIA.31.249-279
[8] Sun, G., Bin, S. (2018). A new opinion leaders detecting algorithm in multi-relationship online social networks. Multimedia Tools and Applications, 77(4): 4295-4307. https://doi.org/10.1007/s11042-017-4766-y
[9] Sohrabi, B., Mahmoudian, P., Raeesi, I. (2012). A framework for improving e-commerce websites usability using a hybrid genetic algorithm and neural network system. Neural Computing & Applications, 21(5): 1017-1029. https://doi.org/10.1007/s00521-011-0674-7
[10] Guo, Y., Wang, M., Li, X. (2017). Application of an improved Apriori algorithm in a mobile e-commerce recommendation system. Industrial Management & Data Systems, 117(2): 287-303. https://doi.org/10.1108/IMDS-03-2016-0094
[11] Tsai, C.F., Chiou, Y.J. (2009). Earnings management prediction: A pilot study of combining neural networks and decision trees. Expert Systems with Applications, 36(3): 7183-7191. https://doi.org/10.1016/j.eswa.2008.09.025
[12] Choi, S.P.M., Liu, J. (2002). Markov decision approach for time-constrained trading in electronic marketplace. International Journal of Information Technology & Decision Making, 1(3): 511-523. https://doi.org/10.1142/S0219622002000324
[13] Zeng, Q.L. (2001). Linear-weighted method for vector-valued semi-markov decision programming. Mathematica Applicata, 14(Suppl): 77-80.
[14] Wang, M.J., Deng, S.X. (2011). Research to e-commerce customers losing predict based on rough set. Applied Mechanics & Materials, 58-60: 164-170. https://doi.org/10.4028/www.scientific.net/AMM.58-60.164
[15] Ju, C.H., Lu, Q.B., Guo, F.P. (2013). E-commerce customer churn prediction model combined with individual activity. Systems Engineering-Theory & Practice, 33(1): 141-150.
[16] Zhang, L., Xu, W., Zhang, L.K., Lau, R.Y.K. (2014). An ontology-based Web mining method for unemployment rate prediction. Decision Support Systems, 66: 114-122. https://doi.org/10.1016/j.dss.2014.06.007
[17] Ashraf, J., Hussain, O.K., Hussain, F.K. (2014). Empirical analysis of domain ontology usage on the Web: eCommerce domain in focus. Concurrency & Computation Practice & Experience, 26(5): 1157-1184. https://doi.org/10.1002/cpe.3089
[18] Tao, T.Y., Zhao, M. (2012). An ontology-based information retrieval model for vegetables e-commerce. Journal of Integrative Agriculture, 11(5): 800-807. https://doi.org/10.1016/S2095-3119(12)60070-7
[19] Yu, X., Guo, S., Guo, J., Huang, X.R. (2011). An extended support vector machine forecasting framework for customer churn in e-commerce. Expert Systems with Applications, 38(3): 1425-1430. https://doi.org/10.1016/j.eswa.2010.07.049
[20] Ren, Z.J., Wang, J., Shi, W.S., Xu, X.H., Zhou, M. (2014). Workload Analysis, implications, and optimization on a production Hadoop cluster: A case study on Taobao. IEEE Transactions on Services Computing, 7(2): 307-321. https://doi.org/10.1109/TSC.2013.40
[21] Orhan, U., Hekim, M., Ozer, M. (2011). EEG signals classification using the K -means clustering and a multilayer perceptron neural network model. Expert Systems with Applications, 38(10): 13475-13481. https://doi.org/10.1016/j.eswa.2011.04.149