Arpit Deo*![]() | Safdar Sardar Khan
| Safdar Sardar Khan![]() | Nitika Vats Doohan
| Nitika Vats Doohan![]() | Aviral Jain
| Aviral Jain![]() | Mitali Nighoskar
| Mitali Nighoskar![]() | Aditi Dandawate
| Aditi Dandawate![]()
© 2024 The authors. This article is published by IIETA and is licensed under the CC BY 4.0 license (http://creativecommons.org/licenses/by/4.0/).
OPEN ACCESS
The primary objective of this investigation is to establish a clear correlation between air quality and the prevalence of respiratory conditions, this is done by employing deep learning (DL) methodologies. RNN was compared against alternative methods such as GNN, CNN, feed-forward technique (DL), k-nearest neighbours, linear regression, decision tree, and neural network. Performance evaluations were conducted employing an Octuple cross-validation approach, with the root mean square error (RMSE) employed to perform comparative analysis. RMSE serves as the primary metric for evaluating regression models, additional criteria for model comparison include computational efficiency, scalability, assessing model performance with larger datasets; and generalization to new data. While RMSE's simplicity and sensitivity to large errors are strengths, limitations include sensitivity to outliers and overlooking distributional differences. The data was collected on two major features, the first being the Air quality dataset which contained various gases present in the atmosphere that affect the air quality, and the second being the hospital patient dataset which indicates the number of people suffering from respiratory diseases due to the air quality. The study acknowledges the superior performance of the Recurrent Neural Network (RNN) model but suggests the need for new learning methods handling small datasets and explores efficient, scalable approaches like distributed and federated learning.
air pollution, air quality index, deep learning, recurrent neural network, respiratory diseases, predictive modeling
In today’s world, different industries, residential areas, and vehicles release a complex mix of harmful substances into the atmosphere. This blend of atmospheric toxins has significant implications for human health. Among these pollutants, fine particulate matter stands out as having the most significant impact on human well-being. The leading genesis of fine particulate matter is the combustion of propellants, both from moving vehicles and fixed establishments like power plants, industries, households, and biomass combustion. Consequences of air pollution contribute to various immediate and long-term health issues, including lung cancer, chronic obstructive pulmonary disease (COPD), and cardiovascular diseases. In 2019 alone, globally approximately 4.2 million premature deaths were ascribed to atmospheric air pollution [1] which highlights the urgent need to address them.
Airborne toxins exhibit diverse chemical and physical characteristics contingent upon the origins of the pollutants. Either human activities or natural hazards contribute to Outdoor air pollutants [2]. Typically, indoor air pollutants originate from activities such as smoking, the materials used in construction, air conditioning systems, etc. [3, 4]. From a chemical point of view, these pollutants can exist in vapour form broadly categorized as either inorganic or organic. Portions of Inorganic pollutants are sulfur dioxide (SO2), carbon monoxide (CO), ozone (O3), and nitrogen dioxide (NO2) [5]. In contrast, gaseous organic pollutants consist of compounds akin to polycyclic aromatic hydrocarbons (PAHs), benzene, toluene, xylene, and various aliphatic chemicals [6, 7].
Initially, the assessment of the toxicity of the combination of sulfur dioxide and smoker relied on the premise that particulate matter served as a conduit for the transmission of sulfur dioxide to the lower regions of the lung [8]. However, the observation of the independent effects of particles necessitated a reevaluation of the toxicology of this substance, which had previously been considered relatively harmless except in the presence of sulfur dioxide [9, 10]. Therefore, Machine Learning (ML) and Deep Learning (DL) have showcased remarkable effectiveness in addressing such issues. In contrast to orthodox computational frameworks, ML and DL algorithmic approaches construct empirical models built upon current datasets with little to no stipulations for specific data distributions to make accurate predictions or facilitate decision-making. This characteristic significantly amplifies their performance capabilities [11].
The primary focus of this study is to explore advanced techniques for anticipating and detecting abnormalities in the functioning of respiratory organs and systems [12]. Notably, our research leverages the power of AI, ML, and DL to enhance automation, employing effective methodologies that contribute to improved threshold rates and accuracy. In terms of methodology, the study employs specific deep-learning techniques, which will be explicitly mentioned early in the abstract for enhanced clarity [13].
Enhanced air quality pertains to the decrease in the concentration of primary pollutants like nitrogen dioxide (NO2), sulfur dioxide (SO2), particulate matter with a diameter of 10 micrometers or less (PM10), fine particulate matter with a diameter of 2.5 micrometers or less (PM2.5), and carbon dioxide (CO2) present in the atmosphere. Therefore, Machine Learning (ML) and Deep Learning (DL) have showcased remarkable effectiveness in addressing such issues. In contrast to orthodox computational frameworks, ML and DL algorithmic approaches construct empirical models built upon current dataset with little to no stipulations for specific data distributions to make accurate predictions or facilitate decision-making. This characteristic significantly amplifies their performance capabilities.
This research seeks to establish a clear link between air quality issues and the subsequent application of ML/DL techniques. These techniques address the challenges identified earlier by providing efficient tools for the anticipation and detection of respiratory abnormalities. The health impact data is seamlessly integrated into the technological discussions, emphasizing how ML/DL advancements translate into tangible health benefits and improved outcomes. Through a comparative study of different ML/DL methods, the aim is to identify the most optimized technique for predicting respiratory diseases based on various air quality concentrations and indices. The conventional methods' base relies upon ANN (Artificial Neural Network) and CNN (Convolutional Neural Network). Though every method used has its different results and effectiveness, therefore it is necessary to compare and find, which method is better and results in a better accuracy rate in terms of detection and prediction of respiratory diseases.
Dey et al. [14] used Linear regression, artificial neural networks, and kNN-DTWD approaches to employ and analyze environmental data, considering temporal and geographical links and detecting rapid decreases in PM2.5 levels. These methods enhanced prediction accuracy in environmental research.
Koul et al. [15] used CNN models trained on 5810 chest X-ray images achieved 98.88% accuracy in diagnosing lung disease. The Densenet-121 model with Mish activation and Nadam optimizer performed best, with 98.97% accuracy on non-dataset images and advanced computer-aided diagnosis of lung lesions.
Basu and Rana [16] proposed that a convolutional neural network was evolved as a part of computer-aided diagnosis systems to enhance the diagnosis of interstitial lung disease. This approach of deep learning improves the accuracy of diagnosis. High-resolution computed tomography (HRCT). Algorithm achieved 76.4% of accuracy through computed tomography and was successfully categorized 92.7% of the diagnoses within a single category.
Sriporn et al. [17] evaluated different deep learning and machine learning approaches, measures performance metrics, and proposed methods for spatial feature extraction and COVID-19 pneumonia detection.
Pham et al. [18] used different CNN architectural models, such as functional and sequential models, are introduced, and their efficiency in correctly categorizing lung cancer patients. These models provide effective answers with less computing effort and expense, resulting in earlier illness identification and better patient care. To increase the performance and generalization abilities of the models, overfitting needs to be addressed.
Soh et al. [19] utilized models such as the temporal model, Markov assessment model, neural network model, etc. for statistical prediction. Through LSTM and GRU air pollution forecasting system was developed. For ephemeral estimation of air quality BiGRU was used.
Priyadarsini et al. [20] put forward convolutional neural networks to categorize respiratory diseases based on sound data. Various data augmentation techniques were utilized mainly accuracy, precision, recall etc.
Trusculescu et al. [21] used Machine learning algorithms to predict adverse outcomes in COPD patients. Patient data from three Taiwan hospitals were used as input features.
Liao et al. [22] compare traditional diagnosing techniques like spirometry, impulse oscillometry, and washout tests. It deduces certain machine-learning techniques best suited for diagnosing diseases like trained classifiers and Bayesian models for Pulmonary Edema, decision tree models, random forests, and association rules for Malignant Pleural Mesothelioma.
Chen et al. [23] used a robust framework for analysis of respiratory diseases through auscultation recording. surpasses existing methods and utilizes a scheme to reduce model complexity without compromising accuracy which includes a teacher network based on CNN-MoE architecture and a compact Student network with two convolutional blocks.
Mary and Raj [24] used Smartphone and watches sensors for measuring thoracoabdominal asynchrony, an early indicator of respiratory distress which effectively distinguishes respiratory patients from healthy individuals, achieving a 90% recall and 76% precision when the device is held on the chest or abdomen for one minute.
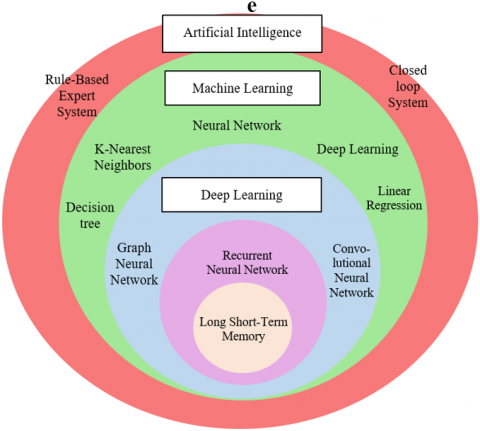
In the context of integrating hybrid models involving Graph Neural Networks (GNN), Convolutional Neural Networks (CNN), Recurrent Neural Networks (RNN), and Long Short-Term Memory (LSTM), the approach involves combining the strengths of these architectures to enhance overall performance in specific applications. As shown in Figure 1 the integration of these models involves combining their outputs or features at different stages, allowing each component to contribute its specialized capabilities. For instance, GNN might capture overall network relationships, CNN could identify spatial patterns, and RNN/LSTM could handle temporal dependencies. The hybrid model aims to leverage the strengths of each architecture, creating a more comprehensive and effective framework for the specific applications discussed in the research. The paper investigates hybrid deep sentiment analysis models combining LSTM, CNN, and SVM, demonstrating their superior accuracy across diverse datasets compared to individual models (SVM, LSTM, and CNN), with a notable emphasis on the efficacy of combining deep learning models with SVM. The evaluation considers both reliability and computation time, highlighting the enhanced performance of hybrid models in sentiment analysis [25].
Figure 1. Classification of AI, ML and Deep Learning methods
Long Short-Term Memory (LSTM)
A strong recurrent neural network architecture used for modeling sequential data. Its memory cells, controlled by gates, selectively retain, and utilize information over time. It is known to capture long-term dependencies and proves value in various domain. Also improves prediction accuracy, and captures complex patterns. Its advanced gating mechanisms handle long-time lags and preserve historical information. Leveraging LSTM enhances performance and usability in tasks with intricate sequential relationships.
LSTM was created to tackle the issue of vanishing gradient and in designing was to integrate nonlinear controls into the recurrent neural network cell, it prevents the gradient of the objective function from diminishing concerning the state signal, which is closely tied to the parameter updates calculated using Gradient Descent during training [26].
Input Gate:
$i_t=\delta\left(\mathcal{W}_i x_t+\mathcal{U}_i h_{t-1}+b_i\right)$ (1)
$\widetilde{C_t}=\tan h\left(\mathcal{W}_i x_t+\mathcal{U}_i h_{t-1}+b_c\right)$ (2)
Forget Gate:
$f_t=\mathcal{W}_f x_t+\mathcal{U}_f x_t$ (3)
Cell:
$C_t=i_t \tilde{C}_t+f_t C_{t-1}$ (4)
Output Gate:
$o_t=\delta\left(\mathcal{W}_o x_t+\mathcal{U}_o h_{t-1}+\mathcal{V}_o C_t+b_o\right)$ (5)
Ct $h_t=o_t \tan h\left(C_t\right)$ (6)
Graph Neural Network (GNN)
They are the class of neural networks that grips structural information encoded in a graph to enable effective learning and reasoning. In traditional times grid structures were formed but after GNN was introduced, connectivity patterns and dependencies among elements in graphs to capture rich information and make predictions were formed. Their remarkable performance is in the domains of social network analysis, recommendation systems, bioinformatics, and knowledge graph completion. It works like a process the first step includes initialization in which each node is assigned an initial feature representation, then the next message passing is performed where every node in the graph collects information from its neighbouring node. It is done by aggregating and combining the feature representations of neighbouring nodes, typically through a weighted sum or concatenation operation. After collecting information each node is updated by its process is iteratively repeated for a fixed number of iterations, where the final node representations are utilized for the given task, such as node classification, link prediction, or graph classification, which relies on the underlying graph structure [27].
$a \theta(\mathcal{K}) * y=\mathcal{V} a \theta(\mathcal{V} \mathcal{S} y)$ (7)
$\mathcal{J M}-\mathcal{D}-\frac{1}{2} \mathcal{A D}-\frac{1}{2}=\mathcal{V} \Lambda \mathcal{V S}$ (8)
Convolutional Neural Network (CNN)
The architecture utilizes a hierarchical arrangement of convolutional and pooling layers to autonomously learn spatially localized patterns and features from the input data.It is like a super-smart detective that looks for hidden clues in pictures. It's specially designed to understand images by scanning them in small sections and finding important patterns, like edges, shapes, or textures [28]. These patterns help CNN recognize objects or make predictions about what's in the picture.
By going through multiple layers, it finds more complex patterns. They are used in tasks like image recognition and self-driving cars, making them powerful tools for understanding the world through pictures.
In the model, the input vector $x_t$ is passed through the 1D-CNN layer, resulting in the output vector $\ell_t$. This is achieved by applying the convolution kernel $k_t$ and bias vector $b_{\ell}$ to the input vector $x_t$ using the hyperbolic tangent function. The output of the 1D-CNN layer is a spatiotemporal feature matrix denoted as $\mathcal{L}=\left[\mathcal{L}_1, \mathcal{L}_2, \ldots, \mathcal{L}_t\right]$ [29].
$\ell_t=\tan h\left(x_t * k_t+b_{\ell}\right)$ (9)
Recurrent Neural Network (RNN)
RNN exhibited superior interpretability and modeling performance in their prediction results. It is like a brain with memory that can understand and generate a sequence of Information. Designed to work with data that comes in a specific order like time series data. RNNs retain past information, capturing temporal dependencies and context. They process data sequentially, updating their memory along the way [30].
LLet us consider the value of the $d$-dimensional state signal vector as $z(t)$. The evolution of this state signal over time, denoted by $t$, is described by a general nonlinear first-order non-homogeneous ordinary differential equation:
$\frac{d s(t)}{d t}=f(t)+\phi$ (10)
Here, $f(t)$ is a $d$-dimensional vector-valued function of time $t$ in the positive real numbers $\mathbb{R}^{+}$, and $\emptyset$ is a constant $d$ dimensional vector [31]. RNN demonstrated its advantages in processing time series data, leading to an increasing number of scholars utilizing RNN in AQI research. Hunta and Pengchata [32] employed RNN in a data-led model for estimating quality of air.
The integration of GNN, CNN, RNN, LSTM into hybrid models poses challenges. The increased complexity of managing interactions between diverse architectures may hinder model design. Computational demands rise due to simultaneous processing, necessitating efficient hardware. Diverse datasets are required for effective training, and optimal hyperparameter tuning becomes intricate across architectures. The interpretability of hybrid models diminishes as complexity grows, demanding careful consideration of trade-offs between enhanced performance and challenges such as increased computational requirements, diverse data needs, and intricate optimization processes.
4.1 Introduction
The early prediction of respiratory diseases through air monitoring is crucial for timely detection, prevention, and intervention. This approach aids in healthcare resource planning, raising public awareness, and informs evidence-based policies to improve air quality and prevent respiratory diseases. This study builds on existing literature, emphasizing the necessity of our investigation and potential contributions. Our study aims to deepen the understanding of the connection between air quality and respiratory diseases. Additionally, we seek to develop a predictive model as a schematic diagram for the overview shown in Figure 2, using Machine Learning and Deep Learning (RNN), for accurate and efficient respiratory disease prediction based on air quality data.
The integration of air quality measurements and respiratory patient data is essential for gaining a holistic understanding of the environmental factors and individual health conditions that impact respiratory health. This integration facilitates precise predictions, empowering healthcare providers to implement proactive measures.
To develop more accurate and robust model we introduced three models namely GNN, CNN, and RNN to early predict the results as they offer spatial relationships, spatial patterns, and temporal dependencies.
GNNs can capture the interconnections between different air quality monitoring stations, considering factors such as pollutant concentrations, geographical locations, and meteorological conditions. This enables GNNs(Graph Neural Networks) to analyze and infer the effect of the quality of air on respiratory health across different locations.
CNNs(Convolutional Neural Networks) are used because they excel at analyzing spatial data, extracting relevant features, capturing non-relevant relationships, benefiting from transfer learning, and providing interpretability.
RNNs (Recurrent Neural Networks) are used to predict respiratory diseases through air quality because they can analyze temporal patterns, incorporate memory, process sequential data, predict future risks, and capture long-term dependencies.These characteristics make RNNs a valuable tool in leveraging air quality information for accurate respiratory disease prediction.
The purpose of this research paper is to enhance the prediction accuracy of respiratory disease occurrences by integrating advanced deep learning techniques with previously employed methods. The methodology employed by the base paper used feed-forward neural networks and weighted them models such as Decision Tree (DT), k-Nearest Neighbors (k-NN), Linear Regression (LR), Deep Learning (DL) and Neural Network (NN), which used the five-fold cross-validation approach for validation. To compare each model Root Mean Square Error (RMSE) was used. The findings indicated that the deep learning approach (feedforward neural network) provided the best-optimized predictions with the least RMS error.
Figure 2. RNN model
RMSE is sensitive to prediction errors, particularly its emphasis on larger errors, which is crucial for addressing significant deviations between predicted and actual values. Moreover, the mathematical simplicity stemming from the use of squared errors makes RMSE convenient, ensuring non-negativity and facilitating straightforward mathematical operations. Additionally, RMSE's interpretability, as it is expressed in the same units as the target variable, enabling stakeholders to comprehend the practical significance of model errors and facilitates effective communication about model performance. Lastly, RMSE's utility in comparative analysis enables the straightforward evaluation and selection of different models or variations, with lower RMSE values serving as indicators of superior predictive performance, thereby aiding in the optimization and selection of models.
We aim to further work and improve upon the base paper, by incorporating three additional methods, which are Convolutional Neural Networks (CNN), Recurrent Neural Networks (RNN), and Graph Neural Networks (GNN). We evaluated their performance and compared them with the previously used methods. The objective was to demonstrate how GNN, RNN, and CNN outperform the other previously applied methods.
By leveraging the advantages of RNN, which allow both backward and forward propagation, we anticipate minimizing prediction errors and enhancing the accuracy of respiratory disease occurrence forecasting.
The inclusion of GNN and CNN will provide additional insights into the spatial and temporal patterns of air quality parameters further improving the predictive capabilities of the model. The research results will enhance our comprehension of the correlation between air pollution and respiratory well-being, leading to more precise forecasts.In this proposed work three main processes are described mainly data collection, dataset preparation, and model generation and evaluation.
4.2 Dataset preparation and cleaning
The data was collected on two major features, the first being the Air quality dataset which contained various gases present in the atmosphere that affect the air quality, and the second being the hospital patient dataset which indicates the number of people suffering from respiratory diseases due to the air quality. After data collection the preprocessing steps were conducted, including data cleaning, to address any inconsistencies, missing values, or outliers in the dataset. The data was also standardized and normalized the data as needed to ensure uniformity and enhance the performance of machine learning algorithms.
The variables were identified and selected for the experiment. These variables were quality indicators (pollutant concentrations, meteorological factors) and patient-specific data related to respiratory health outcomes. In the patient data, the patient names were converted into codes to maintain privacy.
The dataset used for model generating the framework in this study was obtained from two primary provenances: Phayao Hospital and the Pollution Control Department, Ministry of Natural Resources and Environment. The data on the number of patients with respiratory diseases was obtained from the Phayao Hospital database. Additionally, air quality (AQ) data, including ozone (O3), nitrogen dioxide (NO2), carbon monoxide (CO), sulfur dioxide (SO2), PM10, and PM2.5, were collected from the measurement station at Kwan Phayao Learning Park. A schematic representation of the above is shown in Figure 3.
To analyze the frequency of respiratory diseases based on the ICD-10 classification, eight most common pulmonary ailments identified were: J00 (acute rhinitis or the common cold), J02 (acute pharyngitis), J30 (allergic or vasomotor rhinitis), J03 (acute tonsillitis), J06 (acute upper respiratory tract infection), J20 (acute bronchitis), J32(Chronic sinusitis). To distinguish between the effectiveness of each disease, a model for every one of these respiratory disease types, using datasets specifically focused on J00, J02, J03, J06, J20, J30, J32 was created. The models in this paper were to addressed to be implemented on these eight specific respiratory diseases, but they can also effectively tackle applied on other respiratory conditions as well.
Figure 3. The process of study
In Dataset Preparation, both data were merged based on the date, covering the period from October 2015 to October 2020. The raw data was analyzed and transformed into a format suitable for training the machine learning models.
The dataset used for model generation combined the AQ values with the frequency on day-to-day and monthly intervals of number of patients (coded from J00 to J99) to create a dataset suitable for implementing various models. The raw data underwent transformation to facilitate its utilization in the prediction model generation process [32].
4.3 Model generation and evaluation
In Model Generation and Evaluation, five machine learning techniques were employed which were:-Decision Tree (DT), k-Nearest Neighbors (k-NN), Linear Regression (LR),Feed Forward technique (Deep Learning (DL)) and Neural Network(NN). Three more deep learning models were introduced to make it an Eight-fold cross-validation model, the dataset was divided into eight equal-sized subsets or folds. The model underwent training on seven folds and was assessed on the eighth fold. The training was repeated eight times to ensure each fold served as the evaluation set once. The outcomes from each iteration were averaged to derive an overall performance measure for the model thus, the data was meticulously compiled into a table in Table 1, culminating in the creation of a comprehensive graph in Figure 4.
When dealing with sequential or time-series data RNN gives the best output result. We are applying an algorithm of RNN along with RMSE as RNN allows both backward propagation and forward propagation which can minimize errors whereas feedforward uses only forward propagation.
The strength of RNNs lies in their internal memory, which allows them to retain information about past observations and incorporate it into the prediction process. This is especially beneficial in scenarios where the relationship between variables evolves over time or exhibits a dynamic pattern. The iterative nature of RNNs enables them to update their internal state based on each sequential input, making them well-suited for tasks like predicting respiratory disease occurrences from air quality parameters.
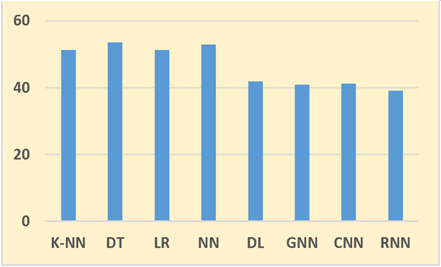
Figure 4. Comparative performance analysis of models (daily dataset)
Figure 5. Comparative performance analysis for diseases (monthly dataset)
We endeavour to showcase the superior performance of advanced techniques including Convolutional Neural Networks (CNN), Recurrent Neural Networks (RNN), and Graph Neural Networks (GNN) incorporating Long Short-Term Memory (LSTM)-and Graph Neural Networks (GNN) in predicting respiratory disease occurrences, in comparison to alternative models such as k-nearest neighbours (KNN), Decision Tree (DT), and Linear Regression (LR). The inclusion of LSTM within the RNN framework enables bidirectional propagation, allowing the model to capture intricate temporal dependencies and correltions present in respiratory disease data hence, a detailed performance analysis based on monthly datasets was crafted, presented in both tabular format in Table 2 and visually depicted through a graph as in Figure 5. By considering historical information as well as current conditions, these models can effectively account for the dynamic nature of respiratory disease occurrence. The ability of modern deep learning techniques; GNN, CNN, and RNN to incorporate both backward and forward propagation contributes to minimizing prediction errors.
Forward propagation calculates the neural network's output given the input data, while backward propagation computes gradients that indicate the parameters' contribution to the prediction error. Gradients, which indicate the partial derivatives of the loss function concerning the variables, demonstrate how the loss function reacts to variations in the parameters.. Through the chain rule of calculus, gradients are propagated backward in the network.
Each layer calculates gradients based on those from the subsequent layer, which are accumulated for parameter updates. By adjusting the parameters in the opposite direction of the gradients, the loss function is minimized. The learning rate controls the step size for parameter updates during optimization. Consequently, this iterative forward and backward propagation process enhances prediction accuracy by utilizing gradients to guide parameter updates, leading to an optimal configuration and minimized prediction errors.
The spatial aspect of data handling varies across models, and clarifying this process is essential, particularly for Graph Neural Networks (GNNs) and Convolutional Neural Networks (CNNs). GNNs excel in capturing spatial dependencies within graph-structured data, where nodes represent entities, and edges denote relationships.While CNNs leverage convolutional layers to extract spatial features from grid-like structures, such as air quality parameter matrices. These spatial aspects contribute to the models' ability to discern complex patterns relevant to respiratory disease prediction.
Table 1. Comparative performance analysis table of models (daily dataset)
|
K-NN |
DT |
LR |
NN |
DL |
GNN |
CNN |
RNN |
|
575.149 |
759.113 |
550.112 |
612.234 |
522.645 |
518.432 |
524.337 |
511.042 |
Table 2. Comparative performance analysis table of models (monthly dataset)
|
K-NN |
DT |
LR |
NN |
DL |
GNN |
CNN |
RNN |
|
51.322 |
53.456 |
51.290 |
52.912 |
41.833 |
40.832 |
41.221 |
39.019 |
Table 3. Comparative performance analysis table of models
|
ML |
J00 |
J02 |
J03 |
J06 |
J20 |
J30 |
J31 |
|
K-NN |
9.657 |
3.331 |
3.417 |
2.876 |
5.640 |
3.567 |
5.421 |
|
DT |
8.875 |
2.699 |
3.241 |
2.797 |
5.783 |
3.612 |
4.390 |
|
LR |
9.463 |
2.447 |
3.314 |
2.610 |
5.532 |
3.486 |
4.235 |
|
NN |
9.934 |
3.689 |
3.593 |
2.852 |
5.822 |
3.639 |
5.571 |
|
DL |
8.342 |
2.534 |
3.093 |
2.512 |
5.590 |
3.498 |
4.345 |
|
GNN |
8.325 |
2.637 |
2.949 |
2.509 |
5.611 |
3.201 |
4.198 |
|
CNN |
8.874 |
2.789 |
3.623 |
2.678 |
5.712 |
3.299 |
4.201 |
|
RNN |
7.832 |
2.201 |
2.864 |
2.421 |
5.322 |
3.135 |
4.012 |
By understanding and analyzing extended dependencies and patterns in the data, these models can learn from past observations and make accurate predictions about future respiratory disease occurrences so we compared the model against the diseases(code) in Table 3 and visually represented it in the graph as in Figure 6. This feature is particularly beneficial in scenarios where the relationship between air quality parameters and respiratory health is influenced by various factors and exhibits complex patterns. The expected outcome of the proposed work is to the compare and analyze techniques such as GNN, CNN, and RNN, with their capabilities of backward and forward propagation, and error minimization, offer superior performance in predicting the occurrence of respiratory diseases compared to traditional models and therefore extract the best optimized method. This research will enhance our knowledge of the relation between respiratory disorders and air quality, leading to more precise predictions and informed decision-making for public health interventions and strategies to prevent such diseases.
Figure 6. Comparative performance analysis for diseases
The main objective of this research is to evaluate and assess the adverse consequences of inadequate air quality on the respiratory system through the implementation of various deep learning methodologies such as CNN (Convolutional Neural Network), RNN (Recurrent Neural Network), and GNN (Graph Neural Network). These techniques were compared with traditional computing methods namely, Decision Tree (DT), k-Nearest Neighbors (k-NN), Linear Regression (LR) etc.
Table 4. Comparative percentage reduction in error metrics between RNN and other models
|
KNN |
DT |
LR |
NN |
DL |
GNN |
CNN |
|
23.93 |
27.01 |
23.92 |
26.23 |
6.73 |
4.44 |
5.34 |
The effectiveness of the prediction models was evaluated by applying the Eight-fold cross-validation approach. The results suggested that the Recurrent Neural Network models outperformed the other prediction models. This finding suggests that these deep learning techniques can be considered as suitable alternatives for predictive modelling in the context of respiratory disease causes related to air quality. The percentage reduction in error of Recurrent Neural Network (RNN) models in predicting respiratory consequences of poor air quality has practical implications as shown in Table 4. RNNs can enhance early warning systems, aiding timely identification of health risks and guiding targeted interventions. Integrating RNN-based models into early warning systems may enhance their accuracy, enabling more timely identification of respiratory health risks associated with poor air quality. This improvement can inform targeted public health interventions, including issuing advisories, recommending protective measures, and influencing urban planning to mitigate air quality issues. Ultimately, the adoption of RNNs in early warning systems may lead to more effective strategies for safeguarding public health in the face of environmental challenges The study challenges traditional methods, encouraging a shift to advanced deep learning techniques, potentially revolutionizing predictive modeling in environmental health. This shift could lead to more accurate models, improving strategies to address the impact of poor air quality on respiratory health.
While acknowledging the superior performance of the Recurrent Neural Network (RNN) model in addressing the specific problem statement, future work can focus on refining learning methods tailored for small or imbalanced datasets. This might involve exploring specific techniques, such as semi-supervised learning or generative adversarial networks, to effectively handle these challenges.
To enhance efficiency and scalability, researchers could delve into concrete methodologies. For instance, in the realm of distributed learning, investigating algorithms like Apache Spark or TensorFlow's distributed computing capabilities could offer valuable insights. Similarly, in the context of federated learning, the utilization of frameworks like PySyft or exploring techniques employed by major platforms like Google's Federated Learning can pave the way for advancements in handling large-scale datasets and real-time applications.
In summary, future research should not only target specific areas like semi-supervised learning and generative adversarial networks for small or imbalanced datasets but also consider concrete methodologies such as Apache Spark for distributed learning or PySyft for federated learning. These endeavors aim to improve the efficiency and scalability of machine learning methods, contributing to enhanced respiratory health prediction.
[1] Isaifan, R.J. (2020). The dramatic impact of the Coronavirus outbreak on air quality: Has it saved as much as it has killed so far?. Global Journal of Environmental Science and Management, 6(3): 275-288. https://doi.org/10.22034/gjesm.2020.03.01
[2] World Health Organization. (2016). World health statistics 2016 [OP]: Monitoring health for the sustainable development goals (SDGs). World Health Organization.
[3] Curtis, L., Rea, W., Smith-Willis, P., Fenyves, E., Pan, Y. (2006). Adverse health effects of outdoor air pollutants. Environment International, 32(6): 815-830. https://doi.org/10.1016/j.envint.2006.03.012
[4] Koenig, J.Q. (1988). Indoor and outdoor pollutants and the upper respiratory tract. Journal of Allergy and Clinical Immunology, 81(5): 1055-1059. https://doi.org/10.1016/0091-6749(88)90180-7
[5] Apte, K., Salvi, S. (2016). Household air pollution and its effects on health. F1000Research, 5. https://doi.org/10.12688/f1000research.7552.1
[6] Li, J., Sun, S., Tang, R., Qiu, H., Huang, Q., Mason, T. G., Tian, L. (2016). Major air pollutants and risk of COPD exacerbations: A systematic review and meta-analysis. International Journal of Chronic Obstructive Pulmonary Disease, 3079-3091. https://doi.org/10.2147/COPD.S122282
[7] Bloemsma, L.D., Hoek, G., Smit, L.A. (2016). Panel studies of air pollution in patients with COPD: Systematic review and meta-analysis. Environmental Research, 151: 458-468. https://doi.org/10.1016/j.envres.2016.08.018
[8] Kim, D., Chen, Z., Zhou, L.F., Huang, S.X. (2018). Air pollutants and early origins of respiratory diseases. Chronic Diseases and Translational Medicine, 4(2): 75-94. https://doi.org/10.1016/j.cdtm.2018.03.003
[9] Gautam, S., Yadav, A., Tsai, C.J., Kumar, P. (2016). A review on recent progress in observations, sources, classification and regulations of PM 2.5 in Asian environments. Environmental Science and Pollution Research, 23: 21165-21175. https://doi.org/10.1007/s11356-016-7515-2
[10] Cohen, A.J., Brauer, M., Burnett, R., Anderson, H.R., Frostad, J., Estep, K., Balakrishnan, K., Brunekreef, B., Dandona, L., Dandona, R., Feigin, V., Freedman, G., Hubbell, B., Jobling, A., Kan, H., Knibbs, L., Liu, Y., Martin, R., Morawska, L., Arden Pope III, C., Shin, H., Straif, K., Shaddick, G., Thomas, M., van Dingenen, R., van Donkelaar, A., Vos, T., Murray, C.J.L., Forouzanfar, M.H. (2017). Estimates and 25-year trends of the global burden of disease attributable to ambient air pollution: An analysis of data from the Global Burden of Diseases Study 2015. The Lancet, 389(10082): 1907-1918. https://doi.org/10.1016/S0140-6736(17)30505-6
[11] Harrison, R.M., Yin, J. (2000). Particulate matter in the atmosphere: which particle properties are important for its effects on health?. Science of The Total Environment, 249(1-3): 85-101. https://doi.org/10.1016/S0048-9697(99)00513-6
[12] Rahman, M.M., Paul, K.C., Hossain, M.A., Ali, G.M.N., Rahman, M.S., Thill, J.C. (2021). Machine learning on the COVID-19 pandemic, human mobility and air quality: A review. IEEE Access, 9: 72420-72450. https://doi.org/10.1109/ACCESS.2021.3079121
[13] World Health Organization. (2022). News Room, Fact Sheets, Household air pollution. https://www.who.int/news-room/fact-sheets/detail/household-air-pollution-and-health
[14] Dey, S., Biswas, S., Nandi, S., Nath, S., Das, I. (2020). Deep greedy network: A tool for medical diagnosis on exiguous dataset of COVID-19. In 2020 IEEE 1st International Conference for Convergence in Engineering (ICCE), Kolkata, India, pp. 340-344. https://doi.org/10.1109/ICCE50343.2020.9290715
[15] Koul, A., Bawa, R.K., Kumar, Y. (2023). Artificial intelligence techniques to predict the airway disorders illness: A systematic review. Archives of Computational Methods in Engineering, 30(2): 831-864. https://doi.org/10.1007/s11831-022-09818-4
[16] Basu, V., Rana, S. (2020). Respiratory diseases recognition through respiratory sound with the help of deep neural network. In 2020 4th International Conference on Computational Intelligence and Networks (CINE), Kolkata, India, IEEE, pp. 1-6. https://doi.org/10.1109/CINE48825.2020.234388
[17] Sriporn, K., Tsai, C.F., Tsai, C.E., Wang, P. (2020). Analyzing lung disease using highly effective deep learning techniques. In Healthcare. MDPI, 8(2): 107. https://doi.org/10.3390/healthcare8020107
[18] Pham, L., Phan, H., Palaniappan, R., Mertins, A., McLoughlin, I. (2021). CNN-MoE based framework for classification of respiratory anomalies and lung disease detection. IEEE Journal of Biomedical and Health Informatics, 25(8): 2938-2947. https://doi.org/10.1109/JBHI.2021.3064237
[19] Soh, P.W., Chang, J.W., Huang, J.W. (2018). Adaptive deep learning-based air quality prediction model using the most relevant spatial-temporal relations. IEEE Access, 6: 38186-38199. https://doi.org/10.1109/ACCESS.2018.2849820
[20] Priyadarsini, M.J.P., Rajini, G.K., Hariharan, K., Raj, K.U., Ram, K.B., Indragandhi, V., Subramaniyaswamy, V., Pandya, S. (2023). Lung diseases detection using various deep learning algorithms. Journal of Healthcare Engineering, 2023. https://doi.org/10.1155/2023/3563696
[21] Trusculescu, A.A., Manolescu, D., Tudorache, E., Oancea, C. (2020). Deep learning in interstitial lung disease-how long until daily practice. European Radiology, 30(11): 6285-6292. https://doi.org/10.1007/s00330-020-06986-4
[22] Liao, K.M., Liu, C.F., Chen, C.J., Shen, Y.T. (2021). Machine learning approaches for predicting acute respiratory failure, ventilator dependence, and mortality in chronic obstructive pulmonary disease. Diagnostics, 11(12): 2396. https://doi.org/10.3390/diagnostics11122396
[23] Chen, Y., Ye, C., Wang, W., Yang, P. (2020). Research on air quality prediction model based on bidirectional gated recurrent unit and attention mechanism. In Proceedings of the 4th International Conference on Advances in Image Processing, pp. 172-177. https://doi.org/10.1145/3441250.3441280
[24] Mary, L.W., Raj, S.A.A. (2021). A survey on sars-cov-2 (covid-19) using machine learning techniques. In 2021 2nd International Conference on Smart Electronics and Communication (ICOSEC), Trichy, India, IEEE, pp. 1612-1617. https://doi.org/10.1109/ICOSEC51865.2021.9591841
[25] Dang, C.N., Moreno-Garcia, M.N., De la Prieta, F. (2021). Hybrid deep learning models for sentiment analysis. Complexity, 2021: 1-16. https://doi.org/10.1155/2021/9986920
[26] Yu, Y., Si, X., Hu, C., Zhang, J. (2019). A review of recurrent neural networks: LSTM cells and network architectures. Neural Computation, 31(7): 1235-1270. https://doi.org/10.1162/neco_a_01199
[27] Iskandaryan, D., Ramos, F., Trilles, S. (2023). Graph neural network for air quality prediction: A case study in madrid. IEEE Access, 11: 2729-2742. https://doi.org/10.1109/ACCESS.2023.3234214
[28] Li, S., Xie, G., Ren, J., Guo, L., Yang, Y., Xu, X. (2020). Urban PM2.5 concentration prediction via attention-based CNN-LSTM. Applied Sciences, 10(6): 1953. https://doi.org/10.3390/app10061953
[29] Wang, J., Jin, L., Li, X., He, S., Huang, M., Wang, H. (2022). A hybrid air quality index prediction model based on CNN and attention gate unit. IEEE Access, 10: 113343-113354. https://doi.org/10.1109/ACCESS.2022.3217242
[30] Sherstinsky, A. (2020). Fundamentals of recurrent neural network (RNN) and long short-term memory (LSTM) network. Physica D: Nonlinear Phenomena, 404: 132306. https://doi.org/10.1016/j.physd.2019.132306
[31] Athira, V., Geetha, P., Vinayakumar, R., Soman, K.P. (2018). Deepairnet: Applying recurrent networks for air quality prediction. Procedia Computer Science, 132: 1394-1403. https://doi.org/10.1016/j.procs.2018.05.068
[32] Hunta, S., Pengchata, R. (2022). A deep learning approach for prediction of respiratory disease from air quality. In 2022 6th International Conference on Information Technology (InCIT), Nonthaburi, Thailand, IEEE, pp. 262-265. https://doi.org/10.1109/InCIT56086.2022.10067262