Alaa Sabree Awad![]() | Mohammed Khalaf*
| Mohammed Khalaf*![]() | Mahmood Alsaadi
| Mahmood Alsaadi![]()
© 2024 The authors. This article is published by IIETA and is licensed under the CC BY 4.0 license (http://creativecommons.org/licenses/by/4.0/).
OPEN ACCESS
Securing wireless sensor networks (WSNs) is imperative, particularly for an intrusion detection system (IDS) deployed in inaccessible terrains, which are susceptible to a multitude of security threats. This study introduces a novel IDS framework employing deep learning to curtail a spectrum of cyber assaults, including but not restricted to DoS, tampering, and sinkhole attacks. In addition to that, The crux of the proposed model depends on the optimization of the cluster head (CH) selection among sensor nodes, where nodes with superior energy levels are preferentially considered for CH roles. This research advances beyond energy-centric CH selection criteria by incorporating delay and distance considerations, culminating in the development of the Particle Distance Updated Bottlenose Dolphin Optimization (PDU-BDO) algorithm for the CH election process. Subsequently, an intrusion detection analysis is conducted via an optimized deep hierarchical voting neural network (DHVNN), with the PDU-BDO algorithm facilitating the neural network's (NN) weight tuning during training. The efficacy of the PDU-BDO algorithm, benchmarked against three extant methodologies using the NSL-KDD dataset, reflects significant performance enhancements, yielding an accuracy of 91.6%, precision of 88.2%, recall of 86%, F1-score of 82%, and a kappa score of 71.4%. Moreover, deep learning-based IDS against adversarial attacks is corroborated through real-world application scenarios, signalling a stalwart defense mechanism within the WSN paradigm.
cluster head selection, optimization, deep neural network, anomaly detection, classification
With the advancements achievement in wireless technologies, the deployment of WSNs has proliferated across diverse sectors such as aviation, manufacturing, and environmental monitoring [1]. Despite their growing utility, WSNs introduce new security vulnerabilities, with intrusion attacks posing significant threats to the safety of individuals and the integrity of property. The effective discrimination of various attack vectors is imperative for the assurance of robust security within WSNs, thus propelling the study of intrusion detection to the forefront of critical research [2].
Research in this domain has traditionally hinged on the analysis of network traffic data through machine learning techniques. However, as WSNs expand in scale and complexity [3], the resultant intricacy of traffic data surpasses the analytical capabilities of conventional machine learning approaches, resulting in suboptimal feature extraction and accuracy [4]. Moreover, the inherent security risks of data leakage and forgery are exacerbated by the limited storage computational, and communication capacities of individual sensor nodes.
In response to these challenges, contemporary studies have advocated for a two-tiered defensive strategy to fortify WSN confidentiality. The primary tier focuses on cryptographic communication, authentication, and baseline protective measures. Nonetheless, as adversarial network tactics evolve, the efficacy of these initial safeguards has been observed to wane [5]. Consequently, intrusion detection systems serve as a critical secondary line of defense, compensating for the limitations of the first tier and mitigating the damages incurred from network breaches [6]. This paper delves into the paradigm of outlier detection within numerous real-time contexts, exploring its viability as a sophisticated mechanism for intrusion detection in WSNs.
· In the domain of environmental monitoring, sensors that measure variables such as temperature and humidity are often deployed in remote and inhospitable locales to record and analyze natural environmental patterns. It is within these challenging settings that outlier detection becomes instrumental, pinpointing the precise temporal and spatial coordinates of environmental events and initiating alerts upon their occurrence.
· In the sphere of habitat monitoring, endangered species are subtly outfitted with compact sensors, a practice that facilitates the observation and tracking of wildlife behaviors. Here, the utility of outlier detection is underscored by its capacity to discern atypical activity patterns, thus providing a granular view of both individual and collective behaviors within a species.
· The field of health and medical monitoring leverages miniature sensors affixed to patients to continuously monitor physiological status. Outlier detection in this context serves a critical function by flagging anomalous readings, potentially signaling the onset of health issues and enabling medical professionals to administer timely interventions.
· Industrial monitoring entails the application of sensors to measure parameters such as pressure, temperature, and vibrational intensity, thereby gauging the operational integrity of machinery. The prompt identification of irregular sensor data via outlier detection is paramount, as it may herald equipment malfunctions or other irregularities, precipitating immediate maintenance or repair.
· Target tracking is enhanced by embedding sensors within mobile entities to surveil and elucidate their movements in real-time. Outlier detection refines the precision and effectiveness of this tracking by filtering spurious data, which in turn sharpens the predictive accuracy of the target's trajectory.
· Lastly, surveillance monitoring incorporates the strategic placement of discrete, sensitive sensors within defined zones. The ability of outlier detection to localize the source of an anomaly plays a pivotal role in precluding unauthorized access and potential adversarial incursions, thereby fortifying the security of such areas.
The adequacy of conventional network intrusion detection methods is notably diminished when contemplating their direct application to WSNs, which are categorized by constrained processing and communication resources [7]. In the milieu of WSN intrusion detection, the extant body of research predominantly examines network traffic data through classical machine learning paradigms. As WSNs burgeon in scale and complexity, the generation of high-dimensional traffic data ensues, presenting substantial challenges for standard machine learning techniques, which manifest in the form of deficient feature extraction and compromised accuracy rates, rendering them ill-suited for such application environments [8].
Intrusion detection technology remains a cornerstone for safeguarding the security of networked systems. The precision in discerning diverse network threats is of paramount importance. In this regard, deep learning-based intrusion detection systems offer a salient advantage over traditional machine learning approaches by simplifying complexity and augmenting the capability to discern data flow attributes, which in turn enhances the precision of detection models [9].
The novelties introduced in this work are twofold:
· A novel DHVNN intrusion detection NN is posited, integrating GRU and hierarchical voting mechanisms, complemented by the Particle Distance Updated Bottlenose Dolphin Optimization (PDU-BDO) technique. The efficacy of the suggested model in association with detection performance and feature selection is rigorously assessed.
· The DHVNN framework is adept at extracting essential traffic parameters from network data. It employs convolution-derived features as inputs for the GRU network, which facilitates the feature extraction from sequential data. A dropout schema is implemented to mitigate the overfitting phenomenon and bolster the generalizability of the WSN intrusion detection methodology. The culmination of this process involves a voting strategy for effectuating multiple classifications.
· When contrasted with antecedent methodologies for intrusion detection in WSNs, the proposed approach demonstrates an augmented capability for detection performance, real-time identification, and classification of a myriad of WSN attack vectors.
The paper is structured as follows: in Chapter 2, we provide a review of related work. Chapter 3 delineates the proposed technique. Chapter 4 is dedicated to the evaluation of performance. Chapter 5 illustrate intrusion detection using deep hierarchical voting NN. Chapter 6 elaborate the findings and finally potential avenues for future research.
Security paradigms in wireless sensor networks (WSNs) are distinct from traditional wired networks, influenced by the unique topological characteristics of WSNs and constraints such as limited battery life [10]. Consequently, the implementation of Intrusion Detection Systems (IDS) within WSNs necessitates diverse methodologies. This review synthesizes significant recent advances in the field.
Graph Neural Networks (GNNs), augmented with Lyapunov optimization, have been employed to train on graph data, optimizing the synaptic efficacy between neuron pairs [11]. Deep Neural Networks (DNNs) have also been explored for intrusion detection, with feature selection being honed by cross-correlation techniques to identify optimal parameters for DNN architectures [12].
A novel approach that amalgamates the Genetic Algorithm (GA) with the Whale Optimization Algorithm (WOA) for specific sample of classification in IDS was proposed [13], highlighting the need for effective feature selection and classification strategies. To advance IDS capabilities, an integration of Long Short-Term Memory (LSTM) networks with the Grey Wolf Optimizer (GWO) was suggested, aiming to refine detection techniques [14].
Research into WSN-specific IDS frameworks has demonstrated a methodology that leverages DoS attack patterns, employing parallelized population communication and the Lévy flight strategy for optimization [15]. Moreover, the advent of high-dimensional traffic data in WSNs has prompted the development of improved Deep Convolutional Neural Networks (IDCNN) for robust Malicious Node Detection (MND) [16].
The integration of LSTM networks with Convolutional Neural Networks (CNN) has been posited as a Hybrid Deep NN approach, tailored to extract salient features from network traffic data, thereby enhancing intrusion detection accuracy [17]. Automated Machine Learning (AutoML) models, utilizing Bayesian optimization, have been tailored for the selection and hyper-parameter optimization of machine learning algorithms, for example linear regression and support vector, to expedite intrusion detection [18].
An innovative anomaly detection methodology employing Artificial Neural Networks (ANNs), refined through the cuckoo search algorithm, has been introduced [19]. Furthermore, optimization of energy-based attack detection methods using an ANN in conjunction with MATLAB Simulink has been explored, demonstrating the efficacy of biologically inspired systems in enhancing IDS in WSNs [20].
It has been observed that unprotected nodes can compromise network performance and disrupt system behavior, an issue that is underscored when regression analyses are applied to both protected and unprotected networks.
The burgeoning field of IDS is marked by a concerted effort to develop sophisticated algorithms for intrusion classification and prevention. The application of meta-heuristic methods in designing advanced IDS solutions has become increasingly prominent. Such approaches hold the potential to significantly elevate IDS performance by offering real-time, accurate, and intelligent security measures. The overarching objective remains the enhancement of intrusion classification efficacy and precision.
The wireless sensor network is built with a two-dimensional plane deployment area in which the cluster is established, and the cluster head is chosen using the Particle Distance Updated Bottlenose Dolphin Optimization (PDU-BDO) method. For Cluster head selection, certain criteria including as energy, distance, latency, and Quality of Service (QoS) are taken into account.
Figure 1 depicts a system model for safe and optimum transmitting data in wireless sensor networks, in which intrusions are identified using a deep hierarchical voting NN, which aids in the rejection of hostile nodes.
Figure 1. Intrusion detection with optimal head selection in WSN
3.1 Node deployment in network
N network elements that have the same sensing diameter rk and communications radius ri are randomly placed with in WSN two-dimensional plane installation region. Assume nodes set is K={k1, k2, …, kn}, and the position parameters of node ki are (xk1, ykk). During the 1st deployment, a suitable Wireless Sensor Networks key supply strategy is used for key exchange, so that nearby nodes may create a secure connection using a shared key. Separate distribution field to generate m×m target point set G={g1, g2, …, gn×m}, gi is indicated as (xg1, ygt), and Euclidean distance among target point gi and node ki is denoted as (xg1, ygt):
$D\left(g_i, k_i\right)=\sqrt{\left(x_{k 1}-x_{g 1}\right)^2+\left(y_{k 1}-y_{g 1}\right)^2}$
Here perception possibility of node ki to mark point gi is:
$p\left(k_i, g_i\right)=\left\{\begin{array}{c}1 D\left(g_i, k_i\right) \leq r_k \\ 0 \text { other }\end{array}\right.$
As per Eq. (3), if distance between target position gi and node ki is lower than or equivalent to node's perceiving radius, D(gi, ki), sensing chance of node ki to target point gi is 1 as shown in Figure 2, and the node can cover the target point. Conversely, perception likelihood of node ki to target point giis 0, indicating that the node does not cover the target location. The joint perception likelihood of target position gi is derived at this moment, based on union of the covering ratios of node set K={k1, k2, …, kn} to target point gi.
$K\left(g_i\right)=\sum_{i=1}^n \sum_{j=1}^m\left(I_1^{i j}-I_2^{i j}\right)$
Figure 2. Overall methodology and critical aspects of WSN
The combined perceiving probability of objective position is 1 only if it's covered through any type of node within node location; else, this joint perception chance is 0. Considering that service area of all corresponding point is ∆m×∆n, then simultaneous perception probability is 1, and also coverage area is∆m×∆n; else, it is 0, target point's coverage area may be represented as e×(∆m×∆n). The node coverage seems to be the proportion of region surrounded by node to entire area of deployment area once it has been deployed, and its mathematical form is:
$F=\frac{e_i k_i}{\sum_{i=1}^n e^{w_j} g_i}$
where, $e^{w_j}$ gives total area of deployment; ei gives total area covered by nodes.
3.2 Cluster head selection
As previously stated, this paper presents a unique optimization strategy for WSN clustering based upon this hybrid multi-objective algorithm. Here, multi-objective GA is employed to identify its CHs for reducing intra-cluster distance of MNs, and optimal routing based just on gravitational searches method is employed to determine best route and transmit data between both CH and sink.
The proposed approach is a population-based meta-heuristic optimization technique that draws inspiration from bottlenose dolphins, a species found in nature. Consequently, it is designated as the bottlenose dolphin optimizer. The deceloped approach emulates the mud ring feeding strategy used by them. The dolphin algorithm's methodology is based on a simulations of dolphin population's hunting behavior. Dolphins achieve predation through four critical steps in this algorithm: call stage, search stage, receiving stage, and predation stage. The behavior of four interconnected phases is used to create the search connections, and the optimal solution to the problem is achieved by continual iterations.
Initialization: In order to deal with the context of optimization, dolphin for each case can serves as a viable solution. Dolphin is provided by Doli={x1, x2, …, xD]T (i=1, 2, …, N), in D dimension, here N gives no., of dolphins and xj (j=1, 2, …, D) is feature that can lead of all component to be improved. If distance between target position giand node ki is lower than or equivalent to node's perceiving radius, D(gi, ki), sensing chance of node ki to target point giis 1, and the node can cover the target point. Conversely, perception likelihood of node ki to target point gi is 0, indicating that the node does not cover the target location. The combined observation likelihood of goal position gi is derived at this moment, based on union of the covering ratios of node set K={k1, k2, …, kn} to target point gi. In addition, original optimum suggested that (given by L) and region optimal solving (given by K) are 2 features related to dolphin. In addition to that, all the varilables that associated with Doli(i=1, 2, …, n) there are 2 correlate with features Li (i=1, 2, …, N) and Ki (i=1, 2, …, n) here Li g variables are Li (i=1, 2, …, N), and Ki(i=1, 2, …, N), here Li given ideal solutions that Doli discoveries in a 1 for each time as well as Ki given optimal solution of what Doli discoveries by itself or obtains the best answer from the rest. Fitness E is core for estimating which outcome is better. In DSA, three types of distances are used in total. The 1st is distance between Doli and Dolj named DDi,j and DDi,j=‖Doli- Dolj‖, (i, j=1, 2, …, N, i≠j. The 2nd is distance between Doli and Ki named DKi=‖Doli-Kj‖, i=1, 2, …, N. In the other aspect, the 3rd is space linking the correct variables Li and Ki known DKLi and DKLi=‖Li- Ki‖, i=1, 2, …, N.
Search stage: In this search stage, every dolphin search neighborhood utilizing sound wave. Sound is given by Vi=[v1, v2, …, vD]T (i=1, 2, …, M), here M is no., of sound and Vj=(J=1, 2, …, D) is part in every dimensions, like route element of each sound. Furthermore, Sound fulfills ‖Vi‖= rapidity (i=1,2,…M) attribute, here “speed” is coefficient given by rapidity feature of sound. While, maximum exploration period is given by $T_1$ Within maximum search time T1 sound Vj that Doli=( i=1, 2, …, N) makes at time t will search for new solution Xijt that is given by:
$X_{i j t}=D o l_i+V_j t$ (1)
For new solution Xijt that Doli obtains, its fitness Eijt is: Eijt=Fitness(Xijt). Single optimal result Li for each Doli is given by Li=Xiab. In order to cpute that scenario, If Fitness(Ki) Ki is swapped by Li; or, Ki this is considered no change is required.
Call stage: During this phase, all dolphin produces a vocalization to communicate its search results to other dolphins, including the identification of a better option.
Stage of reception: Near-by dolphins will assess the most accurate information they get using their own most effective strategies, selecting the most appropriate answer as the ideal approach.The value of Ki. The process of exchanging information, which includes the steps of making a call and receiving a call, is shown in a matrix called the "transmission time matrix" TS. This matrix has dimensions of N x N. n TS, TSi,j gives that Doli to Dolj. To make this clear, for Ki, Kj and TSi,j, if fitness (Ki)<fitness(Kj) and $T S_{i, j}>\left[\frac{D D_{i, j}}{ { A.speed }}\right]$ then $T S_{i, j}=\left[\frac{D D_{i, j}}{ { A.speed }}\right]$ here A is acceleration constant which makes sound faster. Here TSi,j is marked as upper limit make contact with specific time T2. If fitness (Ki)>fitness(Kj), Ki is replaced by Kj or, Ki stay the same time.
Predation stage: According to the available information, every dolphin has to compute the area R of its surroundings and verify the distances relating the optimal result of its neighboring dolphins and the place after the predation phase. It will thereafter be updated.
Particle updating: If there are N candidate resolutions, then every particle has a location vector and velocity vector given by:
$\begin{aligned} & x_i=\left(x_{i 1}, x_{i 2}, \ldots x_{M i}\right)^T \\ & v_i=\left(v_{i 1}, v_{i 2}, \ldots v_{M i}\right)^T\end{aligned}$ (2)
here, i=1, 2, …, N, M givess dimension. Here, xij(t) and vij(t) gives ith particle position and velocity in $j$th dimensions during time instant t. For tracking global best positioning, nCA maintain in set π={p1, p2, ..., pN) that contains best position.
$p_i=\left\{p_{i 1}, p_{i 2},,, p_{i M}\right\}^t$ (3)
Local best position of $i$th particle as well as overall global best location at time t are denoted by pi(t) and pg(t).
$\begin{gathered}p_i(t)=\arg \min f_i(t) \\ p_g(t)=\operatorname{arg\,\,min\,\,f}\left(p_i(t)\right)\end{gathered}$ (4)
Based on size of R1 value and position relationships between Xi, Li and Ki, particular procedure is given in three cases. The next 3 cases are demonstrated by eg., of Doli (i=1, 2, …, N).
$R_2=\left(1-\frac{2}{e}\right) D K_i, e>2$ (5)
newDol $_i=K_i+\frac{\text { Dol }_i-K_i}{D K_i} R_2$ (6)
From the above equation, Doli can leads Ki with the correct path while completely terminate at a position. In order to make that clear, E v e the total distance that can be calculated from the Ki leads to direction in R2.
$\begin{gathered}R_2=\left(1-\frac{\frac{D K_i}{\text { fitness }\left(K_i\right)}+\frac{D K_i-D K L_i}{\text { fitness }\left(L_i\right)}}{e. D K_i \frac{1}{\text { fitness }\left(K_i\right)}}\right), e>2 \\ \text { newDol } l_i=K_i+\frac{\text { random }}{\| \text { random } \|} R_2\end{gathered}$ (7)
(i.e.,), Doli travels to random point where can be easily leads to calculated distance from Ki to R2.
$\begin{aligned} R_2= & \left(1-\frac{\frac{D K_i}{\text { fitness }\left(K_i\right)}+\frac{D K L_i-D K_i}{\text { fitness }\left(L_i\right)}}{\text { e.DK } K_i \frac{1}{\text { fitness }\left(K_i\right)}}\right), D K_i, e>2 \\ & \text { newDol }{ }_i=K_i+\frac{\text { random }}{\| \text { random } \|} R_2\end{aligned}$ (8)
Doli traveling from Ki is R2. Afterwards Doli travels to location of newDoli comparing fitness of newDoli and Ki and when:
fitness $\left(\right.$ newDol $\left._i\right)<$ fitness $\left(K_i\right)$ (9)
Replacing Ki with newDoli, Ki=newDoli. Or, Ki will not change. Dolphins keep entering new round in search till termination is achieved.
Conclusion of every cycle (i.e. after T max the number of generations have been completed), dolphin having characteristics maximize goal is selected as global optimum location again for head node. For current round, sensor closest to the best global position is chosen as CH. Chosen node serves as CH till its energy falls below a certain threshold.
A classic unbalanced data categorization challenge is network data, which consists of a significant volume of regular traffic as well as a tiny quantity of anomalous traffic.
Figure 3. Architecture of deep hierarchical voting neural network
When the total error is minimized in this scenario, even though the accuracy rate of some organization are generally develops, the minority classes for accuracy rate is frequently quite poor. Moreover, the suggested deep hierarchical voting model of neural networks is separated into 5 components for malicious traffic identification as shown in Figure 3. In particular, its input layer, the hierarchy component, its feature conversion component, a bidirectional gated memory unit component, and the voting-based creation component.
GRU (Gated Recurrent Unit): This network was created using the LSTM network variation. GRU misses a gate as compared to LSTM. As a result, overall amount of variable is fewer than that of LSTM. In addition, The traffic detection algorithm contains at least 2 features: (1) the capacity to reduce parameters; and (2) the processing of time series data. As a result, GRU is incorporated into the suggested model. The current gate zt is utlise to govern is transported through into update state. Consequently, The greater the update gate value, the more data from the preceding instant is input.
$z_t=\sigma\left(W_z x_t+U_z h_{t-1}\right)$ (10)
Reset gate rt control data from previous candidate’s set $h_t^{\prime}$, there is small amount of information from last state is written to:
$r_t=\sigma\left(W_r x_t+U_r h_{t-1}\right)$ (11)
xtis given through network unit, which is multiplied by its weight Wr. identical pass for ht-1 that have information for old t-1 units. This is multiplied by its weight Ur. These outcomes are combined together and Sigmoid activation function is given to squash outcome between Zero and One. In this aspect, Current memory fulfilled is given by:
$h^{\prime}{ }_t=\tanh \left(W_h x_t+r_t \odot U h_{t-1}\right.$ (12)
Weight Wh and ht-1 with weight U can be Multiplying with input xt, for calculating Hadamard outcome between complete reset gate rt and Uht-1. Last memory that can be found at current time content is given by:
$\boldsymbol{h}_{\boldsymbol{t}}=\left(\mathbf{1}-z_t\right) h_{t-1}+z_t h_t^{\prime}$ (13)
Stage 1: Applying element-wise multiplication to zt and ht-1;
Stage 2: Applying element-wise multiplication to (1-zt) and $h_t^{\prime}$; add results from Stage 1 and Stage 2
Traffic flow encoder: The method proposed in this study utilizes the bidirectional GRU concept. The GRU model's time-sequential structure allows for the extraction of characteristics from traffic segments using two sequences: from front to rear, given by ht(→), and from back to front, given by ht(<-), and then merged to ht:
$\begin{gathered}h_t(\rightarrow)=G R U(\rightarrow)_{(s e q ~ i)} i \in[1, B], t \in[1, L] \\ \left.h_t(<-)=G R U(<-)_{(s e q\,\,i} \right) i \in[1, B], t \in[1, L] \\ h_t=\left[h_t(\rightarrow), h_t(<-)\right]\end{gathered}$ (14)
Activation functions: The activation function is primarily employed in neural networks to perform a nonlinear modification of numeric values of neural network section. In addition,It can raise the NN algorithm's nonlinearity and develops the NN algorithm's expressive ability. The hyperbolic tangent function may be expressed mathematically (14). In the attention mechanism, an activation function could be utilized. ReLU (Rectified Linear Unit) in association with activation function for various layers is denoted by Eq. (15):
$\begin{gathered}f_1(x)=\tanh (x) \\ f_2(x)=\max \left(0, W^T x+b\right)\end{gathered}$ (15)
Attention mechanism: soft attention mechanism is utilized in this work. 1st and foremost, the model contains a trainable attentional weight matrix; this same value is passed to Sofmax function value to generate a weight with correct value, and indeed K completed dimension weight matrix of value sum is equivalent to One. Ultimately, a attention vector may be calculated by weighting concealed state.
$\begin{gathered}u_t=\tanh \left(W_w h_t+b_w\right) \\ \propto_t=\frac{\exp \left(u_t^T w_w\right)}{\sum_t \alpha_t h_t} \\ V=\sum_t \alpha_t h_t\end{gathered}$ (16)
where, ht gives hidden state, as mentioned in Ww gives concentration weight matrix, bw gives attention in terms of bias, $\propto_t$ gives weight ratio for each matrix, V gives concentration mechanism weighted concentration vector.
Voting based output layer: The goal of this step is to classify security incidents using a majority vote mechanism. Since every NN utlise a various selection of input variables, the classification performance of every model will differ. Is the ultimate decision must represent a democratic majority if a lot of NN describe an incidence as an attack.
$w(r)=\left\{\begin{array}{cl}0, & \text { if } r<0.4 \\ 5 r-2 & \text { if } 0.4 \leq r \leq 0.6 \\ 1, & \text { if } r>0.6\end{array}\right.$
$\boldsymbol{f}\left(r_1, r_2, r_3\right)=\frac{1-\omega\left(r_2\right)}{2} r_1+0.5 r_2+\frac{1-\omega\left(r_2\right)}{2} r_3$ (17)
Varying the input characteristics and variables of every models is a critical aspect since it ensures that there is no link or equivalency between the current probabilities of every NN. r2 now match decision among learning "attack" or "normal" by ranking the outcomes of each NN. When r2>0.5, last result is labeled “attack,” r2<0.5, event is “normal”.
The NSL-KDD data set is can be found at the University of New Brunswick [21]. There are no duplicate records present. This is an expand version of the KDD Cup' 99 available data set [22]. The magnitude of the training sets and testing sets data for KDD Cup' 99 is sufficient, eliminating the need to conduct more tests. There are 125,973 training recordings and 22,544 testing in NSL-KDD collected data set. In this consequences, Training and testing datasets have 41 characteristics that indicate network aspects, and 42nd features has 5 class labels that specify normal or 4 network assaults. Denial of service (DoS) attacks, user to root attacks, remote to local attacks, and probing assaults are four distinct categories of network attacks. The classification techniques are executed on a personal computer equipped with a 2.66 GHz Intel Core i5 central processing unit and 4GB of random access memory.
The experimental result is determined by metrics like as accuracy, F1-score, recall, precision, and kappa score. These parameters are evaluated by comparing results to LSTM-based Recurrent Neural Networks (GWO-LSTM) with Greyish Wolf Optimizer (GWO) [14], improved Deep Convolutional Neural Network (IDCNN) [16], artificial neural networks (ANNs) optimized utlising cuckoo search model [19], and proposed Particle Distance Updated Bottlenose Dolphin optimized deep hierarchical voting neural network [20].
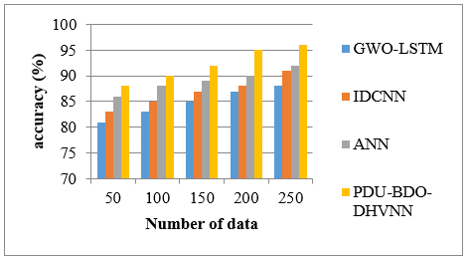
Accuracy indicates the suggested deep learning model's total prediction ability as shown in Table 1. The effectiveness of classifier models to identify both absence and presence of attack is measured by true positive (TP) and true negative (TN). The number of false positive (FP) and false negative (FN) predictions produced by the models is identified by false positive (FP) and false negative (FN) [23].
Accuracy $=\frac{T P+T N}{T P+T N+F P+F N}$ (18)
Table 1. Comparison for accuracy
|
Number of data |
GWO-LSTM |
IDCNN |
ANN |
PDU-BDO-DHVNN |
|
50 |
81 |
83 |
86 |
88 |
|
100 |
83 |
85 |
88 |
90 |
|
150 |
85 |
87 |
89 |
92 |
|
200 |
87 |
88 |
90 |
95 |
|
250 |
88 |
91 |
92 |
96 |
Figure 4. Comparison of accuracy
Figure 4 compares the accuracy of current GWO-LSTM, IDCNN, ANN, and suggested PDU-BDO-DHVNN, where the X axis shows the quantity of data to be utilised for analysis and the Y axis represents the accuracy values acquired in %. While, in compersion to the current methods, the suggested technique obtains 91.6, which is 7.2percentage points better than GWO-LSTM, 5.2percentage points better than IDCNN, and 2.6percentage points better than ANN as shown in Table 2.
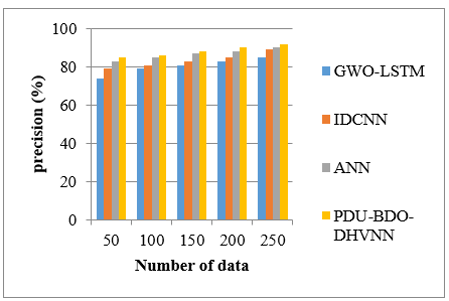
Precision assess effectiveness of attack categorization model Precision reflects a classifier's likelihood of correctly predicting the outcome when an assault is present. It is sometimes referred to as the true positive (TP) rate.
$\operatorname{Precision}(P)=\frac{T P}{T P+F P}$ (19)
Table 2. Comparison for precision
|
Number of Data |
GWO-LSTM |
IDCNN |
ANN |
PDU-BDO-DHVNN |
|
50 |
74 |
79 |
83 |
85 |
|
100 |
79 |
81 |
85 |
86 |
|
150 |
81 |
83 |
87 |
88 |
|
200 |
83 |
85 |
88 |
90 |
|
250 |
85 |
89 |
90 |
92 |
Figure 5. Comparison of precision
Figure 5 compares the precision of current GWO-LSTM, IDCNN, ANN, and suggested PDU-BDO-DHVNN, where the X axis represents the quantity of data to be utilized for complete analysis and Y axis represents the precision values achieved in %. When compersion to the current methods, the suggested technique obtains 88.2%, that is 8.2percentage points better than GWO-LSTM, 5percentage points better than IDCNN, and 2.4percentage points better than ANN as shown in Table 3.
Recall is probability of classifiers for predicting outcome as negative when attack is not present. In addition, It is illustrated as true negative (TN) rate.
$\operatorname{Recall}(R)=\frac{T P}{T P+F N}$ (20)
Table 3. Comparison for recall
|
Number of Data |
GWO-LSTM |
IDCNN |
ANN |
PDU-BDO-DHVNN |
|
50 |
71 |
70 |
75 |
77 |
|
100 |
73 |
75 |
81 |
83 |
|
150 |
79 |
78 |
85 |
88 |
|
200 |
78 |
82 |
89 |
90 |
|
250 |
81 |
85 |
88 |
92 |
Figure 6 compares recall between current GWO-LSTM, IDCNN, ANN, and proposed PDU-BDO-DHVNN, where the X axis represents quantity of data to be utilized for analysis and Y axis represents the recall values achieved in %. When compared to the current methods, the suggested technique scores 86%, that is 10.4percentage points better than GWO-LSTM, 8percentage points better than IDCNN, and 3.6percentage points better than ANN.
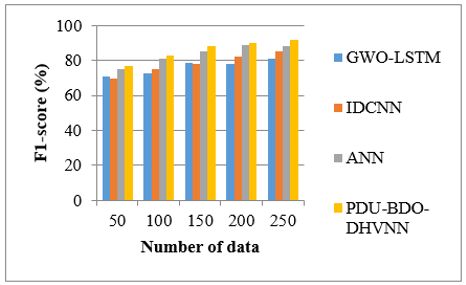
Table 4 shows F1- Score that utilized to calculate prediction performance. It's calculated also as weighted average (or harmonic mean) of accuracy and recall.
$F 1-$ Score $=\frac{2 * P * R}{P+R}$ (21)
Figure 6. Comparison of recall
Table 4.Comparison for F1-Score
|
Number of Epochs |
GWO-LSTM |
IDCNN |
ANN |
PDU-BDO-DHVNN |
|
50 |
59 |
69 |
74 |
76 |
|
100 |
61 |
71 |
76 |
79 |
|
150 |
64 |
73 |
79 |
82 |
|
200 |
65 |
75 |
80 |
85 |
|
250 |
68 |
78 |
82 |
88 |
Figure 7. Comparison of F1- Score
Figure 7 compares the F1- Score between current GWO-LSTM, IDCNN, ANN, and suggested PDU-BDO-DHVNN, where the X axis represents the quantity of data to be utilised for analysis and the Y axis represents a F1- Score values achieved in percentage. When compared to the current methods, the suggested technique scores 82%, that is 18.4 percentage points better than GWO-LSTM, 9 percentage points better than IDCNN, and 4.2 percentage points better than ANN as shown in Table 5.
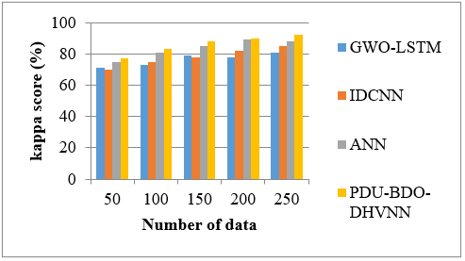
Kappa score is widely used to assess interdependence. The significance of rater reliability is that it demonstrates extent to which data obtained in the research are truly representative of the variables examined.
Figure 8 compares the specificity of current GWO-LSTM, IDCNN, ANN, and suggested PDU-BDO-DHVNN, where the X axis represents the quantity of data to be utilized for analysis and the Y axis represents actual Kappa score values achieved in percentage. When compared to the current methods, the suggested technique obtains 71.4%, that is 14.4percentage points higher than GWO-LSTM, 9percentage points higher than IDCNN, and 4.4percentage points higher than Fast ANN as shown in Table 6.
Table 5. Comparison for kappa score
|
Number of Epochs |
GWO-LSTM |
IDCNN |
ANN |
PDU-BDO-DHVNN |
|
50 |
51 |
54 |
62 |
65 |
|
100 |
54 |
60 |
65 |
68 |
|
150 |
58 |
62 |
67 |
72 |
|
200 |
61 |
65 |
69 |
75 |
|
250 |
65 |
69 |
72 |
77 |
Figure 8. Comparison of Kappa score
Table 6. overall comparison of existing and proposed method
|
Methods |
Accuracy(%) |
Precision(%) |
Recall(%) |
F1-Score (%) |
Kappa Score (%) |
|
GWO-LSTM |
84.8 |
80.4 |
76.4 |
63.4 |
57.8 |
|
IDCNN |
86.8 |
83.4 |
78 |
73.2 |
62 |
|
ANN |
89 |
86.6 |
83.6 |
78.2 |
67 |
|
PDU-BDO-DHVNN |
91.6 |
88.2 |
86 |
82 |
71.4 |
This study may be improved even further by using machine learning algorithms in terms of dynamic threshold prediction and weighted correlation varilable selection for multivariate completed data. Utilizing a Machine Learning algorithm, a dynamic threshold prediction approach may be used to accurately identify contextual abnormalities. Another possible benefit of this method is its capability to effectively address the distinctiveness of specific parameters. Using weighted correlation has the ability to enhance the system's performance in online processing. This involves identifying the crucial characteristics and giving greater attention to the parameters depending on their significance.
One of the critical difficulties that must be addressed promptly in actual WSN systems is intrusion detection. The threat and repercussions of network attacks in WSN could be disregarded, given the continual growth of the provider network and the rapid rise in data volume. Most present intrusion detection systems are limited to dealing with particular sorts of assaults and are useless against unknown threats. Furthermore, while it enhances network security, it also incurs higher energy consumption and transmission delay. These concerns need further consideration in WSN. This study presents a novel intrusion detection model for WSN called Particle Distance Updated Bottlenose Dolphin optimized deep hierarchical voting neural network (PDU-BDO-DHVNN). The model considers security, energy efficiency, and real-time aspects. The proposed method achieves 5.8% of accuracy, 6.2% of precision,10% of recall, 19.4% of F1-score, 14% of kappa score better than GWO-LSTM.When compred with IDCNN, the propose merhod achieves 4.2%, 5.2%, 8%, 9.2%, 9.4% better results in terms of various parametetes.when analyzing the existing ANN, the proposed method achieves 2.6%, 2.4%, 3.6%, 4.2% and 4.4% better results in terms of various parameters. The intrusion detection approach suggested in this research has also been shown to be viable and successful in simulated studies using public data sets. Subsequent research will prioritize the use of a lightweight feature selection approach to enhance overall results. In the future, we will conduct an analysis to investigate the impact of adversarial assaults on the proposed model. This will demonstrate the resiliency of deep learning approaches against such attacks.
[1] Pandey, O.J., Mahajan, A., Hegde, R.M. (2018). Joint localization and data gathering over a small-world WSN with optimal data mule allocation. IEEE Transactions on Vehicular Technology, 67(7): 6518-6532. https://doi.org/10.1109/TVT.2018.2805921
[2] Modares, H., Salleh, R., Moravejosharieh, A. (2011). Overview of security issues in wireless sensor networks. In 2011 Third International Conference on Computational Intelligence, Modelling & Simulation, Langkawi, Malaysia, pp. 308-311. https://doi.org/10.1109/CIMSim.2011.62
[3] Kalantary, S., Taghipour, S. (2014). A survey on architectures, protocols, applications, and management in wireless sensor networks. Journal of Advanced Computer Science & Technology, 3(1): 1-11.
[4] Tomić, I., McCann, J.A. (2017). A survey of potential security issues in existing wireless sensor network protocols. IEEE Internet of Things Journal, 4(6): 1910-1923. https://doi.org/10.1109/JIOT.2017.2749883
[5] Zheng, L., Zhang, H., Han, W., Zhou, X., He, J., Zhang, Z., Gu, Y., Wang, J. (2022). Technologies, applications, and governance in the internet of things. In Internet of Things-Global Technological and Societal Trends from Smart Environments and Spaces to Green ICT, pp. 143-177.
[6] Pathan, A.S.K., Lee, H.W., Hong, C.S. (2006). Security in wireless sensor networks: issues and challenges. In 2006 8th International Conference Advanced Communication Technology, Phoenix Park, pp. 6. https://doi.org/10.1109/ICACT.2006.206151
[7] Raza, S., Wallgren, L., Voigt, T. (2013). SVELTE: Real-time intrusion detection in the Internet of Things. Ad Hoc Networks, 11(8): 2661-2674. https://doi.org/10.1016/j.adhoc.2013.04.014
[8] Mao, Q., Hu, F., Hao, Q. (2018). Deep learning for intelligent wireless networks: A comprehensive survey. IEEE Communications Surveys & Tutorials, 20(4): 2595-2621. https://doi.org/10.1109/COMST.2018.2846401
[9] Liu, H., Lang, B. (2019). Machine learning and deep learning methods for intrusion detection systems: A survey. Applied Sciences, 9(20): 4396. https://doi.org/10.3390/app9204396
[10] Abduvaliyev, A., Pathan, A.S.K., Zhou, J., Roman, R., Wong, W.C. (2013). On the vital areas of intrusion detection systems in wireless sensor networks. IEEE Communications Surveys & Tutorials, 15(3): 1223-1237. https://doi.org/10.1109/SURV.2012.121912.00006
[11] Biswas, P., Samanta, T., Sanyal, J. (2022). Intrusion detection using graph neural network and Lyapunov optimization in wireless sensor network. Multimedia Tools and Applications, 1-12. https://doi.org/10.1007/s11042-022-13992-9
[12] Gowdhaman, V., Dhanapal, R. (2022). An intrusion detection system for wireless sensor networks using deep neural network. Soft Computing, 26(23): 13059-13067. https://doi.org/10.1007/s00500-021-06473-y
[13] Mojtahedi, A., Sorouri, F., Souha, A.N., Molazadeh, A., Mehr, S.S. (2022). Feature selection-based intrusion detection system using genetic whale optimization algorithm and sample-based classification. arXiv preprint arXiv:2201.00584. https://arxiv.org/abs/2201.00584
[14] Karthic, S., Manoj Kumar, S., Senthil Prakash, P.N. (2022). Grey wolf based feature reduction for intrusion detection in WSN using LSTM. International Journal of Information Technology, 14: 3719–3724. https://doi.org/10.1007/s41870-022-01015-7
[15] Liu, G., Zhao, H., Fan, F., Liu, G., Xu, Q., Nazir, S. (2022). An enhanced intrusion detection model based on improved kNN in WSNs. Sensors, 22(4): 1407. https://doi.org/10.3390/s22041407
[16] Kumar, M., Mukherjee, P., Verma, K., Verma, S., Rawat, D.B. (2021). Improved deep convolutional neural network based malicious node detection and energy-efficient data transmission in wireless sensor networks. IEEE Transactions on Network Science and Engineering, 9(5): 3272-3281. https://doi.org/10.1109/TNSE.2021.3098011
[17] Manjula, P., Priya, S.B. (2022). An effective network intrusion detection and classification system for securing WSN using VGG-19 and hybrid deep neural network techniques. Journal of Intelligent & Fuzzy Systems, 43(5): 6419-6432. https://doi.org/10.3233/JIFS-220444
[18] Singh, A., Amutha, J., Nagar, J., Sharma, S., Lee, C.C. (2022). AutoML-ID: automated machine learning model for intrusion detection using wireless sensor network. Scientific Reports, 12(1): 1-14. https://doi.org/10.1038/s41598-022-13061-z
[19] Imran, M., Khan, S., Hlavacs, H., Khan, F.A., Anwar, S. (2022). Intrusion detection in networks using cuckoo search optimization. Soft Computing, 26(20): 10651-10663. https://doi.org/10.1007/s00500-022-06798-2
[20] Hasan, B., Alani, S., Saad, M.A. (2021). Secured node detection technique based on artificial neural network for wireless sensor network. International Journal of Electrical & Computer Engineering (2088-8708), 11(1).
[21] ‘University of New Brunswick’. Available at https://www.unb.ca/cic/datasets/ ids- 2018. html, accessed on 20 January 2017.
[22] Dhanabal, L., Shantharajah, S.P. (2015). A study on NSL-KDD dataset for intrusion detection system based on classification algorithms. International Journal of Advanced Research in Computer and Communication Engineering, 4(6): 446-452.
[23] Kadiyala, P., Shanmukhasai, K.V., Budem, S.S., Maddikunta, P.K.R. (2022). Anomaly detection using unsupervised machine learning algorithms. In Deep Learning for Security and Privacy Preservation in IoT, Springer, Singapore, pp. 113-125. https://doi.org/10.1007/978-981-16-6186-0_6