Tao Ma![]()
© 2024 The author. This article is published by IIETA and is licensed under the CC BY 4.0 license (http://creativecommons.org/licenses/by/4.0/).
OPEN ACCESS
With the rapid development of cloud computing technology, its application in the education industry has become increasingly widespread, particularly in terms of its impact on the employment structure of college graduates. Cloud computing has not only transformed the structure of employment fields but also redefined the skill sets required for these jobs. In light of this, this study aims to explore in depth the effects of cloud computing service models on the employment structure of college graduates and proposes effective predictive analysis methods. Utilizing the Spark-Improved Random Forest (IRF) algorithm, this research addresses the challenges of efficiency and accuracy in employment structure prediction within a big data environment and provides a detailed analysis of the evolving trends in employment structure based on cloud computing service models. Moreover, while existing studies lack in data processing capabilities and depth of analysis, the methods and analyses presented in this study offer new perspectives for addressing these issues and provide a scientific basis for career guidance for college graduates.
cloud computing, employment structure, Spark-Improved Random Forest (Spark-IRF) algorithm, college graduates, employment predictive analysis
In today's rapidly developing information technology environment, cloud computing, as an innovative computing model, is gradually changing the operation modes of various industries, including the education sector and the job market [1-3]. With the widespread application of cloud computing technology, it has had a profound impact on the employment structure of college graduates. This impact is manifested not only in the expansion of employment fields but also in the changing demands for employment skills [4-7]. Therefore, a thorough analysis of the impact of cloud computing service models on the employment structure of college graduates not only helps us understand the current trends in the job market but also provides references for reforms in higher education [7].
As the economy develops and technology advances, the demands of the job market continue to change. Precisely predicting and analyzing the changes in the employment structure of college graduates has become an important issue in educational planning and policy-making [8]. Research in this area not only helps colleges adjust their educational programs and optimize their major offerings but also enables graduates to understand changes in the job market early on, allowing them to plan their career paths rationally, thereby improving employment quality and rates [9-12].
However, existing research methods often face issues of inefficiency and low precision when dealing with large-scale employment data. Traditional analysis methods struggle to effectively process and analyze complex and variable job market data under a big data context, which limits the reliability and practicality of the predictions [13, 14]. Moreover, in-depth analyses of the role of cloud computing service models in changes to the employment structure are relatively lacking, which limits our understanding of employment market trends in terms of depth and breadth [4, 15-17].
This paper aims to fill this research gap through two main research contents. First, this study proposes a Spark-IRF algorithm for predictive analysis of the employment structure of college graduates. Based on the Spark big data processing framework and utilizing an improved random forest algorithm, this method can efficiently handle large-scale employment market data and enhance the accuracy of predictions. Second, this research also conducts an in-depth analysis of the changing trends in the employment structure of college graduates based on cloud computing service models, revealing how cloud computing technology influences adjustments in employment structures and changes in demand for employment skills. Through these two parts of the study, this paper not only expands the research on the application of cloud computing in the field of education but also provides new ideas and methods for career guidance for college graduates, which have significant theoretical and practical value.
Applying the original random forest algorithm to the predictive analysis of the employment structure of college graduates can identify the factors and their interrelationships that have a significant impact on graduate employment, thereby helping to predict future employment trends and structural changes. However, when dealing with college graduate employment data, the challenge lies in the high dimensionality and diverse types of data, including dimensions such as educational background, skill proficiency, and industry demand. The complexity of such data makes it difficult for the original random forest algorithm to effectively process these high-dimensional data while maintaining a high accuracy rate. Additionally, using traditional methods to equally vote across all attributes might overlook the influence of certain key factors on employment outcomes, thus reducing the accuracy of predictions.
To effectively address these challenges, this paper introduces the Spark-IRF algorithm for the predictive analysis of the employment structure of college graduates. This algorithm, based on the powerful Spark cloud computing platform, optimizes the original random forest algorithm. First, when handling high-dimensional employment data, the algorithm enhances data processing efficiency and execution speed through dimensionality reduction. Secondly, in the ensemble process of the trees, not every tree is given the same weight for voting; instead, different weights are assigned based on the performance of the trees, which helps to reduce model bias and increase the accuracy of prediction results.
The employment structure data for college graduates covers multiple dimensions, such as employment status, industry classification, and work location, which are often inconsistent in format and standards. For this purpose, it is first necessary to standardize the employment status (e.g., employed, unemployed) to "Y" (yes) and "N" (no); industry classification may involve multiple levels, such as primary and secondary industry classifications, which need a unified format (e.g., IND1001, IND1002); city categories, including first-tier cities, second-tier cities, etc., also require uniform coding conversion (e.g., WP0001, WP0002). Additionally, specific work addresses, due to privacy and accessibility issues, can be converted to corresponding geographic codes or postal codes.
Considering the characteristics of college graduate employment structure data, the process of the Spark-IRF algorithm is divided into three stages: data preprocessing, dimensionality reduction of communicable disease data, and weighted voting method (WVM).
Data preprocessing aims to transform the original employment data into a consistent format for more accurate analysis. For example, employment status can be standardized to "employed" or "unemployed"; industry categories are divided into primary and secondary industry codes; work locations include specific cities and districts. For geographic location data, converting specific work place addresses to postal codes can be achieved using the cloud computing service's map API, which not only protects individual privacy but also facilitates uniformity and standardization in the dataset.
In terms of data dimensionality reduction, this study adopts a dimension reduction method based on the importance of feature attributes of employment data, as shown in Figure 1. During the training process of each decision tree, the information gain ratio of each feature attribute variable in the training data subset is calculated and these variables are arranged in descending order of their information gain ratios. Subsequently, the top k variables with the highest information gain ratios are selected as important variables, and a random selection of (l-j) variables from the remaining (L-j) is made to participate in subsequent model training. This reduces the dataset's dimensionality from the original L to l. This method not only significantly reduces data complexity but also retains the most critical information for the predictive model, thereby effectively enhancing the accuracy and efficiency of the employment structure predictive analysis.
During the dimensionality reduction process, the first focus is on assessing the importance of feature attributes for node splitting during the decision tree training process. Specifically, this process begins by calculating the entropy of each feature attribute variable before each node split. Entropy, a fundamental concept in information theory, is used to measure the uncertainty of a variable. Here, by calculating the entropy of each feature attribute under different employment statuses, the ability of each feature to distinguish between different employment outcomes can be quantified.
Suppose the number of different target variable attribute values in the dataset Tu is represented by f1, and the probability value of type x in all types within the target variable subset is represented by ox. The following equation defines the entropy of the target variable in the training data subset Tu(u=1,2...j):
$E N\left(T_u\right)=\sum_{x=1}^{f 1}-o_x \log o_x$ (1)
Figure 1. Dimensionality reduction process for employment structure data of college graduates
Figure 2. Configuration of the spark cloud computing experimental platform
Next, for each training data subset Tu in the decision tree, the entropy value buk of each input variable relative to the target variable is calculated. This step further analyzes the correlation strength between each input variable (such as major, skills, education, etc.) and the final employment outcome. By assessing the entropy values of these input variables, the algorithm can identify the variables that most influence the prediction of employment status. The following equation provides the entropy calculation formula for each input variable buk:
$E N\left(b_{u k}\right)=\sum_{n \in N\left(b_{u k}\right)} \frac{\left|T_{(n, u)}\right|}{\left|T_u\right|} E N\left(n\left(b_{u k}\right)\right)$ (2)
Finally, the final step of the dimensionality reduction process is completed by calculating the self-split information of each input variable. Self-split information quantifies how much the entropy of the target variable is reduced under a given input variable, thus providing a measure of the quality of feature splitting. Variables that can maximize information gain, i.e., those that can most reduce the uncertainty of employment status, are selected as key features for building the decision tree. Suppose the number of different values of buk is represented by f2, and the probability value of type x in all types within variable bk is represented by o(x,k). The following equation provides the calculation formula for the self-split information U(buk) of each input variable:
$U\left(b_{u k}\right)=\sum_{x=1}^{f 2}-o_{(x, k)} \log _2\left(o_{(x, k)}\right)$ (3)
Let n(bk)ÎN(bk), the following equation gives the information gain of each feature attribute variable:
$\begin{aligned} & H\left(b_{u k}\right)=E N\left(T_u\right)-E N\left(b_{u k}\right) =E N\left(T_u\right)-\sum_{n \in N\left(b_{u k}\right)} \frac{\left|T_{(n, u)}\right|}{\left|T_u\right|} E N\left(n\left(b_{u k}\right)\right)\end{aligned}$ (4)
The dimensionality reduction process for college graduate employment data crucially relies on the precise evaluation of the importance of feature variables. Although directly using information gain as a measure of feature importance can effectively identify features that significantly contribute to classification, this method is prone to overfitting, especially when dealing with complex and high-dimensional employment data. Overfitting results in excellent model performance on the training set but significantly reduced generalization ability on unknown data. To alleviate this issue and further improve the model's accuracy and generalization ability when processing college graduate employment data, using the information gain ratio instead of pure information gain to assess the importance of feature variables has become a necessary strategy.
The information gain ratio selects features that not only provide the maximum information gain but also avoid overfitting due to the high dispersion of the features themselves by considering the amount of information inherent in the features (i.e., the rate of change in information before and after splitting). The definition of the information gain ratio for buk is given by the following equation:
$H E\left(b_{u k}\right)=\frac{H\left(b_{u k}\right)}{U\left(b_{u k}\right)}$ (5)
Since college graduate employment data usually includes various factors such as personal skills, educational background, and industry demands, the importance of these factors is not consistent. By calculating the information gain ratio of each feature variable attribute to assess its importance, the features that most influence the prediction of changes in employment structure can be identified. To optimize model performance and improve prediction accuracy, this paper further defines the importance of feature variable attributes and performs data dimensionality reduction accordingly. The importance NU(buk) of buk is defined as follows:
$N U\left(b_{u k}\right)=\frac{H E\left(b_{u k}\right)}{\sum_{(x=1)}^L H E\left(b_{(u, x)}\right)}$ (6)
In the flow of the Spark-IRF algorithm for predictive analysis of the employment structure of college graduates, the WVM is a key step used to enhance the model's prediction accuracy. Employment structure prediction focuses on a comprehensive consideration of different industries, skills, and educational backgrounds, where the predictive performance of each decision tree may vary based on different features. Therefore, the Spark-IRF algorithm introduces WVM to assign different weights to the voting results of each tree, based on each tree's classification or regression accuracy during training. WVM ensures that predictions on the test dataset are not merely a simple majority vote but consider the weighted accuracy of each tree's prediction, effectively reducing the impact of noisy data and enhancing the accuracy and reliability of the model's predictions for changes in the employment structure of college graduates.
Specifically, after the model training phase, the performance of each tree is tested using Out-of-Bag (OOB) data. Each decision tree gu tests its performance using the OOB data OOBu not involved in training, thereby calculating each tree's classification accuracy ZXu. Classification accuracy is defined as the proportion of correctly classified samples out of all the OOB samples tested by the tree, including correctly classified and misclassified categories. This ratio reflects each tree's effectiveness in dealing with unseen data, providing a basis for subsequent weighted voting. Suppose the indicator function is represented by U(·), the correct classification value by b, and the incorrect classification value (c≠b) by c, then the calculation formula is:
$Z X_u=\frac{U\left(g_u(a)=b\right)}{U\left(g_u(a)=b\right)+\sum U\left(g_u(a)=b\right)}$ (7)
In the prediction phase, the entire random forest model predicts each record in the test dataset A. When the target variable is continuous, the random forest is configured as a regression model. In this case, the prediction result consists of the weighted average of all decision trees' predictions, where the weighting is based on each tree's OOB classification accuracy, directly relating each tree's voting weight to its prediction accuracy. Suppose the voting weight of decision tree gu is represented by qu, then the definition formula for the weighted regression result Ge(A) is:
$G_e(A)=\frac{1}{j} \sum_{u=1}^j\left[q_u \times g_u(a)\right]=\frac{1}{j} \sum_{u=1}^j\left[Z X_u \times g_u(a)\right]$ (8)
For discrete target variables, the prediction result is the classification result obtained through the weighted majority vote of all decision trees. Each tree gains its voting weight based on its classification accuracy on OOB data. Thus, for each sample in the test dataset A, the algorithm aggregates the weighted voting results of all decision trees to determine the final category. The definition formula for the weighted classification result Gz(A) is provided below:
$G_z(A)=M A_{u=1}^j\left[q_u \times g_u(a)\right]=M A_{u=1}^j\left[Z X_u \times g_u(a)\right]$ (9)
Figure 2 presents a diagram showing the configuration of the Spark cloud computing experimental platform used in this study. In the process of applying the Spark-IRF algorithm for predictive analysis of the employment structure of college graduates, a key step is using Spark's distributed computing capability to process and analyze large-scale employment datasets. Taking "field of study" as an example feature attribute, different fields of study impact graduates' employment outcomes differently. Initially, a Resilient Distributed Dataset (RDD) generated by the field of study attribute is used to process data in parallel and calculate the data volume under various fields of study. In the Spark environment, a new RDD is generated through filtering operations, and then the count() function is used to calculate the total number of data items in this new RDD, thereby determining the sample size for each field of study. The Spark cluster assigns a task to each Partition of the RDD to calculate the data items in each partition in parallel. After completing these partition calculations, the cluster controller aggregates these results, ultimately obtaining the data count results for specific fields of study. This processing method fully utilizes Spark's parallel computing features, significantly enhancing the efficiency of processing large-scale employment datasets, and providing effective data support for predictive analysis of the employment structure of college graduates.
3.1 Cloud monitoring submodule
In the study of employment structure changes among college graduates, the cloud monitoring submodule plays a crucial role. Its main task is to ensure monitoring efficiency while minimizing interference with the data processing workflow, thereby finding a reasonable balance between monitoring capabilities and costs. Specifically for analyzing changes in the employment structure of college graduates, this monitoring module ensures the timeliness and accuracy of employment data by monitoring the collection, processing, and analysis processes in real-time. To reduce the system overhead of monitoring, measures such as reducing the frequency of data collection and optimizing data processing algorithms are adopted to minimize the impact on the overall analysis process. However, these optimization strategies might sacrifice the detail and timeliness of monitoring to some extent, thus carefully designed monitoring strategies are required to effectively capture key changes in the job market even when information resources are limited.
The design of the cloud monitoring submodule takes into account the diversity and specificity of monitoring resource data types to more effectively capture and analyze key indicators affecting the graduate job market. Important monitoring indicators in this analytical model include, but are not limited to, graduate employment rates, industry distribution, regional distribution of employment, and major-specific employment rates. Specifically, for the analysis of changes in the employment structure of college graduates, monitoring indicators may also include changes in job demand, industry recruitment trends, and the match between graduate skills and job requirements. These indicators are crucial for predicting and analyzing trends in the job market, identifying potential employment opportunities, and assessing risks. Similar to monitoring the cardinality of source/target IP address pairs on cloud platforms to identify security threats, monitoring the flow of graduate employment helps identify hot and cold spots in the job market, as well as potential employment opportunities. Similarly, monitoring the performance of servers can provide data support for adjusting and optimizing university education programs by understanding the types of positions that graduates from different majors are assigned to and their performance in the workplace.
The monitoring frequency of the cloud monitoring submodule needs to balance real-time requirements and system performance to effectively track dynamic changes in the job market while avoiding excessive burdens on the data processing and analysis systems. Given the characteristics of employment data and the diversity of analysis needs, different monitoring indicators require different monitoring frequencies. For instance, indicators like employment rates and industry recruitment needs might require higher monitoring frequencies to capture immediate market changes, whereas indicators such as graduate skill match might be more stable and thus suitable for lower monitoring frequencies. Considering the optimized use of cloud computing resources and maintenance of performance, similar to the application of Ganglia technology in monitoring cloud platform resources, this model can adopt tiered monitoring frequency settings. For rapidly changing indicators, shorter monitoring periods are used, while for slower-changing indicators, the monitoring period can be extended to balance real-time needs and system performance. Additionally, for some long-term stable static information, such as certain basic educational resource allocations, updates can be made irregularly or only monitored when changes occur.
Given the distributed nature of college graduate employment data and the high demands for real-time and accurate data in job market analysis, a tiered architectural approach is also used for the data collection system. Specifically, local monitoring nodes can be deployed in areas with large data volumes and high job market activity to collect employment data of college graduates in that region. At the same time, a global monitoring node is deployed in a central location where data processing and analysis demands are high. This node not only coordinates and aggregates data from various local monitoring nodes but also conducts further data processing and analysis. If data indicate rapid growth in job market demand in certain areas, the global monitoring node quickly conveys this information to relevant universities and policymakers to swiftly respond to market changes.
3.2 Submodule for predicting trends in employment structure data for college graduates
Facing the complexity and dynamic nature of job market data, along with the diversity of college graduate data types, building an accurate, efficient, and reliable employment trend prediction model becomes a significant challenge. This requires a deep understanding of different types of employment data and market trend changes, combined with the features of the cloud computing platform for the design of the prediction model. The model needs to be able to process and analyze large volumes of distributed employment data in real-time, capturing trends such as fluctuations in industry demands, changes in employment positions, and shifts in graduate skill requirements, to predict future changes in employment structures. By integrating analysis of historical data and real-time data, and using advanced data analysis techniques such as machine learning algorithms, the prediction submodule can provide accurate job market trend predictions for universities and policymakers, thus guiding the development of educational training programs and employment market regulation strategies.
In this scenario, the cloud platform primarily handles employment data for college graduates, including employment rates, industry distribution, job demand, and other multidimensional data. The processing states of these data on the cloud platform can be divided into receiving, processing, and analyzing states, similar to the idle, executing, and exception states in scientific computing services. The cloud platform needs to break down the job market analysis tasks into multiple subtasks according to the data volume and complexity of different majors, assigning them to various computing nodes. Additionally, the resource scheduler on the cloud platform allocates tasks based on the computing resource requirements, such as CPU cores and memory, to optimize computational efficiency and resource utilization. By analyzing these operational states and resource allocation strategies, a model can be established for predicting trends in the employment structure data of college graduates, utilizing linear or nonlinear models to predict employment trends or changes in industry demands for graduates from different majors. The process flowchart is shown in Figure 3.
Figure 3. Process flowchart for predicting trends in employment structure data for college graduates
Predicting changes in the employment structure of college graduates is a key feature, aimed at accurately understanding and predicting dynamic changes in the job market. This process involves analyzing various types of employment data, such as changes in industry demand, job distribution, and graduate skill match. Under static or stable conditions, trends in the job market may be relatively stable and easy to predict. However, under the influence of economic fluctuations and industry updates, changes in employment structure may exhibit greater volatility, requiring prediction models that can accurately capture these dynamic changes. Particularly during the seasons when a large number of graduates enter the job market, or when emerging industries are rapidly developing, changes in employment data become more intense, necessitating more refined prediction strategies. The specific prediction methods have been provided in the previous section.
3.3 Submodule for correlation analysis of employment structure data for college graduates in the cloud
The submodule for correlation analysis of employment structure data for college graduates in the cloud enables users to not only view the current state of the job market through real-time monitoring and prediction technologies but also to gain an intuitive understanding of employment trends through dynamic charts. However, for users lacking deep market understanding or analytical experience, mere data visualization may not sufficiently reveal the deeper implications of changes in the job market. To overcome this challenge, the employment structure data correlation analysis submodule employs association analysis techniques to perform in-depth processing and analysis of extensive employment data, identifying frequent itemsets in the employment data time series and revealing the intrinsic connections between different employment data, such as the relationship between specific industry demand growth and the increase in employment rates of graduates from specific majors.
Employment data for college graduates typically appears as continuous attributes, such as changes in employment rates and fluctuations in salary levels. These data need to be effectively discretized to reveal the intrinsic associations between different employment indicators. Drawing on methods used for processing cloud platform monitoring data, this paper classifies employment data according to different employment statuses such as employed, job-seeking, continuing education, etc., and different employment quality factors such as match level and salary level, thus converting continuous data into well-defined discrete states. Additionally, for specific job market analysis needs, employment data from particular industries or majors can be selected, focusing on data analysis at key time points to enhance the specificity and effectiveness of the correlation analysis.
From the results processed in Table 1, it is evident that this study successfully organized the employment data of college graduates into structured information, encompassing multiple dimensions including, but not limited to, educational level, field of study, industry classification, city of residence, academic performance, and internship experience. This structured processing of data provides a solid foundation for subsequent analyses. Particularly, by introducing the "employment intention" indicator, the study is able to more intricately explore the relationship between graduates' employment preferences and market demands. Utilizing the Spark-IRF algorithm to handle these large-scale datasets not only demonstrates the capability to manage large data sets but also ensures the efficiency and accuracy of the analysis, thereby making predictive analysis of the employment structure of college graduates possible. The experimental results show that through the application of the cloud computing service model and Spark-IRF algorithm, the study effectively quantifies the impact of various factors on the employment structure of college graduates and reveals the complex connections between educational backgrounds, professional skills, and job market demands.
Table 2 and Figure 4 present the Mean Decrease Accuracy (MDA) and Mean Decrease Gini (MDG) metrics for variables affecting the employment structure of college graduates, as analyzed using the proposed method. The data indicate that academic performance, field of study, internship experience, and graduation degree are the main factors affecting employment structure. Academic performance shows the highest importance in both MDA and MDG metrics, indicating that graduates with excellent academic records are more likely to secure better employment opportunities. The importance of the field of study ranks second, reflecting significant differences in job market demands across different fields. Internship experience is also an important factor, suggesting that practical experience significantly enhances graduates' employment competitiveness. The impact of graduation degree on employment structure is also significant but relatively lower in importance. Employment intention, skills and abilities, city, and job market conditions have relatively minor impacts, but are still not to be ignored. These experimental results emphasize the effectiveness of the cloud computing service model used in this paper for quantifying the analysis of factors influencing the employment structure of college graduates. By processing large-scale job market data using the proposed methods, not only are the key drivers of changes in employment structure revealed, but also deeper insights into subtle changes in the job market are provided.
Table 1. Results after data preprocessing
|
Exposed Key |
Graduate ID |
Education Level |
Field of Study |
Industry Classification |
City |
Academic Performance |
Internship Experience |
Employment Intention |
|
EPK1001 |
G00000001 |
Bachelor |
INF1001 |
IND1001 |
WP0001 |
12130 |
114000 |
N |
|
EPK1002 |
G00000002 |
Bachelor |
INF1002 |
IND1002 |
WP0002 |
12130 |
114002 |
Y |
|
........ |
|
|
|
|
|
|
|
|
Table 2. MDA and MDG of variables affecting the employment structure of college graduates using the methodology in this study
|
Variable |
Mean Decrease Accuracy |
Mean Decrease Gini |
|
Field of Study |
0.6125485 |
131.254589 |
|
Graduation Degree |
0.5231654 |
54.6254152 |
|
Academic Performance |
0.7154852 |
177.2354892 |
|
Internship Experience |
0.5231256 |
68.524156 |
|
Employment Intention |
0.4859625 |
25.3256412 |
|
Skills and Abilities |
0.4751236 |
22.3256158 |
|
City |
0.3789542 |
21.235841 |
|
Job Market Conditions |
0.3326589 |
14.235874 |
(Note: MDA - Mean Decrease Accuracy, MDG - Mean Decrease Gini)
Figure 4. Importance ranking chart of independent variables in employment structure data of college graduates using the proposed method
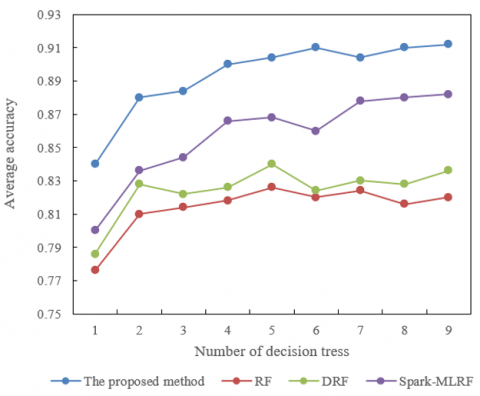
Figure 5. Average accuracy of different predictive methods for college graduate employment structure under varying numbers of decision trees
Figure 5 demonstrates the average accuracy of different predictive methods, including the proposed method, traditional Random Forest (RF), Improved Random Forest (DRF), and Spark Machine Learning Random Forest (Spark-MLRF), in predicting the employment structure of college graduates as the number of decision trees changes. The data show that as the number of decision trees increases, the predictive accuracy of all methods improves, but the proposed method consistently outperforms the others. Particularly when the number of decision trees reaches 9, the accuracy of the proposed method reaches 0.912, while the accuracies of RF, DRF, and Spark-MLRF are 0.82, 0.836, and 0.882, respectively. This indicates that increasing the number of decision trees can enhance predictive performance, but the proposed method demonstrates higher accuracy at each decision tree count level. These experimental results fully confirm the effectiveness and superiority of the Spark-IRF algorithm proposed in this paper for the predictive analysis of the employment structure of college graduates. By comparing with RF, DRF, and Spark-MLRF, the proposed method not only shows efficient processing capability when dealing with large data sets but also has significant advantages in predictive accuracy. This high-performance predictive analysis capability highlights the strong potential of cloud computing technology in data processing and analysis, particularly in understanding and predicting complex changes in employment structures.
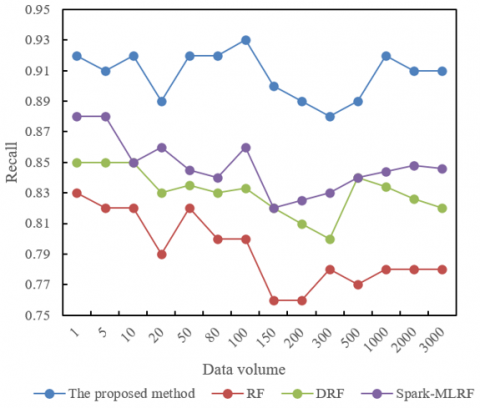
Figure 6. Recall rates of different predictive methods for college graduate employment structure under varying data volumes
Figure 6 shows the comparison of recall rates of different predictive methods for college graduate employment structure as the data volume increases. The Spark-IRF algorithm proposed in this paper exhibits significant stability and superior performance, especially when the data volume exceeds 100 records, maintaining a recall rate above 0.89. Compared to other methods, particularly at higher data volumes (such as 2000 and 3000 records), this method's recall rate remains around 0.91, showing high stability and accuracy. In contrast, the recall rates of RF and DRF fluctuate more across different data volumes and overall perform less effectively than the proposed method. The Spark-MLRF performs similarly to the proposed method at smaller data volumes (1 to 50 records) but begins to decrease in recall rate as data volume increases, especially underperforming at larger data volumes. By demonstrating high recall rates at different data volumes, the proposed method not only effectively processes and analyzes large volumes of employment market data but also ensures the accuracy and reliability of the predictive results.
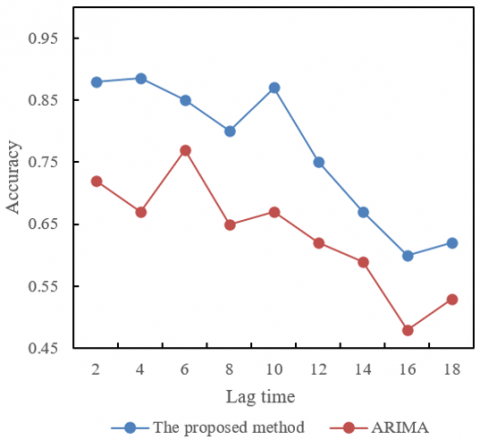
Figure 7. Accuracy of different college graduate employment structure prediction methods under various lag times
Figure 7 displays the comparison of accuracy between the proposed method and the ARIMA model in predicting the employment structure of college graduates at different lag times. The proposed method exhibits higher accuracy at lower lag times (2 to 10), particularly peaking at a lag time of 4 with an accuracy of 0.885. However, as the number of lags increases, the accuracy of the proposed method shows a decreasing trend, particularly when the lag exceeds 12, with the accuracy significantly dropping to 0.62 at 18 lags. In contrast, the ARIMA model shows generally lower accuracy across all lag times and experiences greater fluctuations, though it peaks at a lag of 6 with an accuracy of 0.77, subsequently decreasing as the number of lags increases. These results indicate that the proposed algorithm, especially at lower lag times, provides higher prediction accuracy compared to the traditional ARIMA model, demonstrating its effectiveness and superiority in predicting the employment structure of college graduates. Although the accuracy of the proposed method declines with increasing lag times, it still maintains a relatively high level, possibly due to the Spark-IRF algorithm's better capability to handle and analyze complex relationships in time series data, thereby mitigating the impact of lag effects to some extent.
This study effectively fills the research gap in the predictive analysis of college graduate employment structures by introducing the Spark-IRF algorithm. Combining Spark's big data processing capabilities with the high accuracy of the improved random forest algorithm, it demonstrates efficiency and predictive precision when handling large-scale employment market data. The research findings, through multi-dimensional data analysis—including data preprocessing, variable importance analysis, average accuracy under different numbers of decision trees, recall rates under different data volumes, and accuracy analysis at various lag times—comprehensively exhibit the effectiveness and superiority of the Spark-IRF algorithm in predicting the employment structure of college graduates.
The comprehensive conclusions indicate that this study not only enhances the accuracy of employment structure predictions but also delves into the impact of cloud computing technology on employment structure adjustments and changes in employment skill demands, providing robust data support and decision-making tools for universities, policymakers, and labor market analysts. However, the study also has its limitations, such as potential impacts on algorithm performance and accuracy when handling extremely large data sets or highly complex employment market structures. Additionally, the model's predictive capability decreases at high lag times, requiring further optimization.
Future research directions could consider deepening and expanding in several areas: First, exploring more data features and complex models to improve the accuracy and robustness of employment structure predictions; second, extending the research to a broader range of labor markets and different regional employment structures to validate the model's universality and adaptability; and lastly, future efforts could focus on algorithm optimization, especially enhancing efficiency and accuracy when handling large data volumes and high lag times. Through these studies, the application value and impact of cloud computing in the field of labor market analysis could be further enhanced.
[1] Zhang, Y., Li, X., Sun, T., Zhang, Y., Cheng, Y., Li, J. (2022). Design of college student employment service platform based on cloud computing. In 2022 Euro-Asia Conference on Frontiers of Computer Science and Information Technology (FCSIT), Beijing, China, pp. 191-197. https://doi.org/10.1109/FCSIT57414.2022.00047
[2] Jiang, C. (2021). Research and implementation of intelligent platform for targeted employment poverty alleviation based on cloud computing and big data. In 2021 International Conference on Computer Information Science and Artificial Intelligence (CISAI), Kunming, China, pp. 500-504. https://doi.org/10.1109/CISAI54367.2021.00102
[3] Xie, T. (2023). Campus IoT system and students’ employment education innovation based on mobile edge computing. Soft Computing, 27(14): 10263-10272. https://doi.org/10.1007/s00500-023-08288-5
[4] Al-Mousa, A. (2022). Cloud computing: Bridging the link between industry and the classroom. The International Journal of Electrical Engineering & Education, 59(4): 329-349. https://doi.org/10.1177/0020720919857636
[5] Wang, F., Huang, Y., Ma, Q. (2022). Personalized recommendation system of college students’ employment education resources based on cloud platform. In International Conference on E-Learning, E-Education, and Online Training, Harbin, China, pp. 318-333. https://doi.org/10.1007/978-3-031-21164-5_25
[6] He, Z.Q., Meng, D.X., Zhao, X.M. (2014). University employment information integration model based on cloud computing. Applied Mechanics and Materials, 599: 1807-1811. https://doi.org/10.4028/www.scientific.net/AMM.599-601.1807
[7] Kalpravidh, P., Nunes, B., Gholami, R. (2020). Toward a conceptual model for cloud computing affordance. In 26th International Association for Management of Technology Conference, IAMOT 2017, Vienna, Austria, pp. 1290-1309. IAMOT & University of Pretoria.
[8] Gyanwali, S., Karmacharya, B., Tiwari, G. (2023). Impact of employability skills on employee performance of business graduates in Nepal: Structural equation modeling approach. In International Conference on Intelligent Computing & Optimization, Hua Hin, Thailand, pp. 141-152. https://doi.org/10.1007/978-3-031-50151-7_14
[9] Pott, R.W., de Jager, M. (2021). A decade of chemical engineering graduates: Their roles and skills in the world of work. In 2021 World Engineering Education Forum/Global Engineering Deans Council (WEEF/GEDC), Madrid, Spain, pp. 124-131. https://doi.org/10.1109/WEEF/GEDC53299.2021.9657218
[10] Sjawie, F., Ardi, R. (2021). The impact of employability skills on employers' satisfaction: a conceptual model for fresh graduates of engineering. In Proceedings of the 4th Asia Pacific Conference on Research in Industrial and Systems Engineering, Depok Indonesia, pp. 200-206. https://doi.org/10.1145/3468013.3468332
[11] Osman, K., Proches, C.N.G. (2020). Engineering graduates at a South African university and their prospective employers–expectations and reality. In 2020 IFEES World Engineering Education Forum-Global Engineering Deans Council (WEEF-GEDC), Cape Town, South Africa, pp. 1-6. https://doi.org/10.1109/WEEF-GEDC49885.2020.9293659
[12] Shen, J. (2023). A bilateral employment situation prediction model for college students using GCN and LSTM. PeerJ Computer Science, 9: e1494. https://doi.org/10.7717/peerj-cs.1494
[13] Filippi, E., Banno, M., Trento, S. (2023). Automation technologies and their impact on employment: A review, synthesis and future research agenda. Technological Forecasting and Social Change, 191: 122448. https://doi.org/10.1016/j.techfore.2023.122448
[14] Jonsson, R., Rinaldi, F., Pilli, R., Fiorese, G., Hurmekoski, E., Cazzaniga, N., Camia, A. (2021). Boosting the EU forest-based bioeconomy: Market, climate, and employment impacts. Technological Forecasting and Social Change, 163: 120478. https://doi.org/10.1016/j.techfore.2020.120478
[15] Casale, G. (2023). Performance evaluation teaching in the age of cloud computing. ACM SIGMETRICS Performance Evaluation Review, 51(2): 45-49. https://doi.org/10.1145/3626570.3626588
[16] Paterson, J.H., Adams, J., Foster, D., Baghban Karimi, O., Kazmi, Z., Lennon, R.G., White, L. (2022). Motivation and strategies for effective inclusion of cloud solution provider certifications in computing curricula. In Proceedings of the 2022 Working Group Reports on Innovation and Technology in Computer Science Education, pp. 235-260. https://doi.org/10.1145/3571785.3574128
[17] Cheng, Y. (2021). Research on the construction of smart employment service platform based on internet plus initiative. In 2021 2nd International Conference on Information Science and Education (ICISE-IE), Chongqing, China, pp. 1188-1192. https://doi.org/10.1109/ICISE-IE53922.2021.00268