Sanjay Tanaji Sanamdikar*![]() | Satish Akaram Patil
| Satish Akaram Patil![]() | Deepak Onkar Patil
| Deepak Onkar Patil![]() | Madhuri Pravin Borawake
| Madhuri Pravin Borawake![]()
© 2023 IIETA. This article is published by IIETA and is licensed under the CC BY 4.0 license (http://creativecommons.org/licenses/by/4.0/).
OPEN ACCESS
Diabetic Retinopathy (DR), a microvascular complication, stands as one of the leading causes of vision impairment among diabetic populations globally. This pathology is characterized by the occlusion of retinal vessels, thereby depriving the retinal tissue of essential nutrients. Given the progressive nature of DR and its potential to culminate in irreversible blindness, timely and accurate diagnosis is paramount for effective intervention. Conventionally, the detection of DR relies heavily on the expertise of ophthalmologists, a resource-intensive process that may be prohibitive in terms of cost and time. To address these limitations, automated detection systems have been developed, aiming to hasten diagnostic processes and democratize access to these crucial services. Nevertheless, the performance of such systems has been historically hampered by the scarcity of reliable data sources and medical records for this condition. In response to these challenges, this study explores an ensemble machine learning approach that synergizes multiple established classifiers into a cohesive diagnostic model. The proposed methodology demonstrates superior performance in accuracy compared to prevalent classification algorithms. Utilizing the Messidor dataset, the top-performing five and ten features were isolated into four sub-datasets through InfoGainEval and WrapperSubsetEval methods. The accuracy achieved for the top five features via InfoGainEval was 70.7%, while for the complete feature set, it reached 75.1%. The employment of ensemble machine learning techniques in diagnosing DR represents a significant application of artificial intelligence within the medical domain, conferring advantages such as enhanced accuracy, robustness, efficient feature selection, early detection, scalability, and a reduction in human error, all while ensuring cost-efficiency and enabling continuous monitoring for improved patient outcomes. However, the approach is not without limitations. These include the quantity and quality of data, clinical variability, ethical and privacy concerns, scalability challenges, potential overfitting, intricate feature selection and engineering, bias in data collection, and issues related to cost and accessibility. The findings underscore the efficacy of the sub-datasets, which facilitate a less cumbersome classification process as compared to the full Messidor dataset, thereby streamlining the diagnostic pathway.
machine learning, ensemble learning, deep learning and retinopathy in diabetics, deep convolutional neural networks (DCNNs), Messidor dataset
Diabetic Retinopathy (DR), a major microvascular complication of diabetes mellitus, manifests as damage to the retinal vasculature, resulting in characteristic macular changes such as exudates, aneurysms, and hemorrhages. The earliest recorded observation of macular anomalies in diabetic patients can be attributed to Eduard Jaeger in 1856. However, the definitive correlation between these anomalies and diabetes was not established until 1872 when Jaeger presented histopathological evidence of retinal destruction attributed to cystoid processes in diabetic individuals. Proliferative Diabetic Retinopathy was first identified by Wilhelm Manz in 1876, marking a significant advancement in the understanding of DR [1].
Symptoms of DR, as described by the Mayo Clinic [2], often include vision spots, fluctuating visual acuity, chromatic aberrations, and in severe cases, complete vision loss in one or both eyes. These manifestations are the result of progressive occlusion of the retinal microvessels, which are essential for the nourishment of the retina. Consequently, automated diagnostic methods for detecting diabetic retinal damage are increasingly recognized as critical. While deep learning techniques have yielded high accuracy in binary classifications of DR, their efficacy in multi-class categorizations, especially in early-stage disease diagnosis, remains suboptimal.
The necessity for expedited clinical assessments and decisions is underscored by factors such as high patient throughput or emergent care scenarios. Furthermore, the provision of affordable treatment is a fundamental healthcare objective, yet in numerous low-income regions, access to adequate healthcare and affordable interventions is often lacking. This disparity leads to a heightened risk of vision loss among underserved populations. The incorporation of artificial intelligence (AI) in healthcare has expanded to include applications in radiology, screening, and disease diagnosis, with notable systems developed by the UK's National Health Service and the Mayo Clinic in the US, alongside contributions from tech giants such as Google and IBM [3].
In this context, the current study introduces a novel automated detection model for Diabetic Retinopathy that leverages an optimal ensemble of AI techniques to achieve high diagnostic precision. Attention has also been given to achieving this accuracy with minimal computational overhead, ensuring efficiency and reduced storage demands.
The remainder of this paper is organized as follows: Section 2 presents a review of pertinent literature and discusses prior research on automated Diabetic Retinopathy screening. Section 3 delineates the experimental dataset and the methodologies employed, followed by an in-depth exposition of the proposed diagnostic model. The concluding section offers a synthesis of the work and reflects on potential future research directions that could contribute to advancements in healthcare technology, with specific attention to DR [4].
Numerous research has been done on the reliability, efficiency, and maintainability of the DR's automatic identification. A DR detection technique entirely dependent on red retinal lesions being found utilizing analysis and image processing was proposed by Jelinek et al. in 2006 [5]. However, an accuracy and sensitivity thresholds demanded by ophthalmologists were not fulfilled by the earlier suggested systems.
Over the years that followed, further study was done. Adding more characteristics that may be gleaned from a retina fundus copy was one of the suggestions made to enhance the DR detection algorithms. Retinal pictures with poor resolution may certainly enhance the likelihood of forming FP and FN predictions, for example, since picture excellence was shown to have a major impact based on the final forecast. The suggested approach by Antal and Hajdu [6] combines a number of comparison elements utilized in earlier publications, including image quality, lesion-specific elements.
Basically, a classifier is included in the system if it delivers a greater overall accuracy; otherwise, it is not. The authors proposed using a backward ensemble search strategy, in which all classifiers are initially considered to be every classifier undergoes evaluation after becoming a member of the ensemble. to see whether removal improves accuracy. The combined system of Antal and Hajdu attained an excellent precision of 90%, sensitiveness of 90%, and universality of 91% in situations with and without disease. Deep convolutional neural networks (DCNNs), which have multiple layers of filtering and every of which generates the total of the findings of the preceding layer, make up the majority of the approach proposed by Gargeya and Leng [7]. Deep feature extraction techniques, as well as crisp image preparation procedures, were enhanced by focusing significantly on fundus picture preprocessing. In besides analyzing the system they developed using the mean Region Below the Receiver Operating Characteristics Curve (AUROC), Gargeya et al. also employed Sensitivity and Specificity measures. The approach was assessed in two scenarios: classifying the existence of disease regardless of phase vs its normal retinal state, and identifying the occurrence of the condition in its earliest phases with only a few mild symptoms vs. its absence. A heat map was used to show the findings. When evaluated using the publicly available MESSIDOR-2 dataset, the overall prediction results were somewhat comparable to those of the Antal et al. model. Additionally, the algorithm's inexperience with the MESSIDOR dataset, which was a result of its training according to Bande et al. [8]. The typical method used in earlier developments was to train the algorithm was trained once on certain photos from a set of pictures. In order to prepare the photographs, the writers normalized, resized, and cropped them into a rectangular form. Brightness, contrast, and colour intensities were altered in the photos using the Gaussian Smoothing Kernel. Images were scaled down to match the 384 pixel FOV. In order to guarantee that the image's brilliant borders were removed, cropping was done. In the learning on a single scale. Suspicious patches were gathered and individually examined to determine how likely they were to be DR lesions using a patch-level classifier that was based on CNN and pre-trained AlexNet [9]. The estimates for each and every patch in a single picture are input into an algorithm for global gathering, which, using a constructed DR map, calculates the likelihood that the picture (the source from which fixes were made) represents a DR instance. Because the wrong patch was chosen while utilising the pre-trained CNN's default startup, the stated adjustments were made. Keerhiveena et al. [10] 's recommendation to train GoogLeNet and AlexNet CNNs for accurate DR grading at the two, three, and four ary levels.
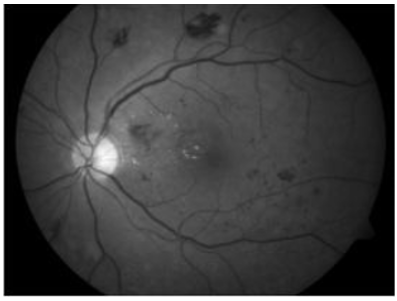
(a)
(b)
Figure 1. Fundus picture (before and after CLAHE application)
As mentioned in Gargeya and Leng's method, these models solved past problems in correctly detecting the condition in its early stages. Several image pre-processing methods, data augmentation methods, and multi-class model training were employed to improve the algorithm's responsiveness to fundal pictures with early-stage DR. Using a mix of Low-dimensional embedding and filters of various sizes, the more complex layered CNNs performed well, indicating that the model is capable of acquiring more intricate characteristics from the datasets used for training. Figure 1 shows a fundus picture (before and after CLAHE application) [11].
The aforementioned models failed to increase the accuracy of multi-class DR identification, however, because more sensitive and specialized techniques had already been established. However, by increasing image preprocessing for delicate feature extraction, our trials demonstrated promising prospects for higher accuracy thresholds for DR identification early on with extremely faint signals. The architecture was first presented by Ali et al. [12] with the primary goal of achieving a reliable classification for novel and diverse datasets. They used the Kaggle/EYEPACS dataset to train their algorithm. It incorporates image preprocessing and augmentation. Furthermore, the Hough transform, a feature removal technique used in image analysis and digital presentation, was used whenever an image notch was found following the transformation to monochrome. Histogram adjustment was used to create all photos. 256-neuron dense layer, softmax layer, and modified Inception v3 layer were added after that, each having two output probabilities from the two classifiers. The suggested model fared better than numerous other models in grading various DR phases when based on analysis of the MESSIDOR collection. It attained an AUC of 0.93, 97% accuracy, 87.26% sensitivity, and 91.15% specificity [13].
On a GeForce GTX 1050Ti GPU, the lesion-localization procedure sped up the process' processing time from 20 minutes to just 48 seconds for each picture. The provided method demonstrated that the proposed model significantly reduces the model's complexity while still achieving a ninety percent sensitivity, eighty-seven specificities, and a 0.944 AUC. This suggests significant simplification potential for image processing techniques. One of the best tools for copy analysis is the Image-enhancement technique CLAHE, which is used to escalation image quality and make deep and obscure details more obvious. This shows improved results by using both HE and CLAHE on the dataset pictures. Before being divided into 3 separate pictures, Red, Green, and Blue, each picture in the collection was initially blown up to 150 by 255 pixels, Multicolour format conversion, and then used. The three photos are then subjected to HE, CLAHE, and edge sharpening in order to decrease image sound. The final better picture is created by combining the three earlier ones. Figure 2 shows the Critical region subsampling approach using strides [14].
The stride function was further employed by the authors to choose the step size inside the max-pooling layer through learning, this reduces the information as well in order to avoid excessive fitting. The classification accuracy of the current model is 97%, with 94% sensitivity and 98% specificity. This work has shown that processing pictures with HE and CLAHE simultaneously results in a considerable improvement in image quality for feature extraction. An interesting SDL-based categorization approach was proposed by Antal et al. [15]. In order to determine what a picture represents, a dual DCNN complex network compares the two input pictures and generates a synergic signal that indicates whether they belong to the same predicted input group, along with an explanation in the event that an error gesture was generated. The first step in image preparation procedures was to transform the retinal picture to RGB. The most instructive areas of the photos that depict the features of the illness were then chosen using histogram-based classification. An image-augmentation-free technique for assessing fundus copy data was developed by Quellec et al. [16], in contrast to earlier combinations of image pre-processing methods.
The researchers solely utilised CLAHE to enhance colour contrast, a method used to identify lesions associated to vessels from lesions unrelated to vessels. For this diagnostic model, the pre-trained CNNs family, Efficient Nets, was shown to be the most helpful in order to increase the model's accuracy in comparison to Lalithadevi and Krishnaveni [17]. Additionally, demonstrated to be far more precise and time-efficient are pre-trained CNNs. The authors recommended increasing CNN scale to accomplish better accuracy rates, three-dimensional performance, and the settlement, dimension, and breadth of CNN; where the dimension, the amount of inputs in each layer of convolution, and the amount of levels in the overall network are all implied by the settlement, dimension, and breadth of the picture supplied to the CNN, respectively. Pour et al. applied a complete Geometry reduction to the 456x456 pixel picture format used by EfficientNet-B5 in their work. All of the family's earlier models (B0-B4) use smaller pictures, which means that crucial information for the classification process is lost. The breadth and depth indicated by Gulshan et al. [18] were utilized by the authors to scale the network. On MESSIDOR, this framework was assessed, where it attained a sensitivity rate of 92% and a 0.945 AUC, and it was developed using both MESSIDOR-2 and IDRiD datasets.
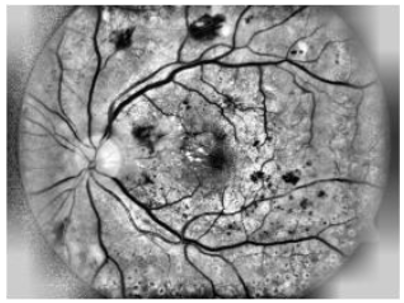
Figure 2. Samples Images of retinal. Two retinal images on the bottom side represent Diabetic Retinopathy, although the top side retinal images represent normal retinal images
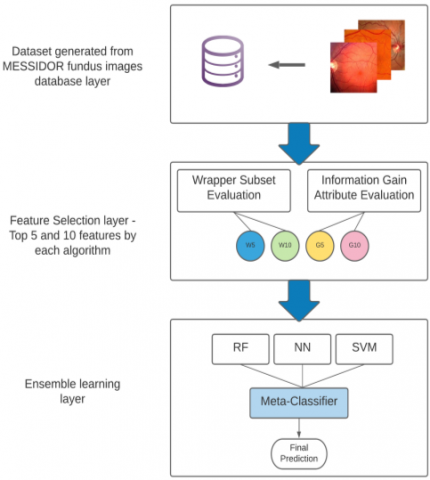
The last two decades have seen the adoption of a variety of Methodologies, classification techniques, and image processing algorithms to develop a trustworthy automated diagnosis Diabetic Retinopathy management system. A modern classifier with increased precision and accuracy is used in this study than earlier constructed models was created employing a variety of ensemble learning approaches. The MESSIDOR public fundus dataset will be used as the training set for this classifying model, and Techniques for removing features and analysis of pictures won't be employed in this study. We offer a potential approach for automated DR detection systems in this model, and we show the outcomes of combining a number of algorithms for classification in a framework based on ensembles. Specific characteristics will be picked out and aggregated using feature selection methods, as shown in Figure 3, and then supplied into the ensemble architecture. During this time a portion of the selected datasets will be used to train the model. To increase the precision of the system's predictions, a number of widely used classification algorithms will be used, including Neural networks for complex mathematical computations Random Forest (RF) for resilient and powerful learning, and the Support Vector Machine (SVM) procedure for producing estimates quickly and efficiently. A Meta-classifier will combine the output of all algorithms in the last step to create the final prediction [19].
Figure 3. Proposed layered framework for diabetic retinopathy detection
3.1 A collection of test data
This study makes use of the UCI (University of California Irvine) dataset about retinopathy caused by diabetes. Features for this dataset were taken from the 1151 patient fundus photos in the publicly accessible MESSIDOR database. Normally, there will be two key phases for the model: learning and evaluation. The cross-validation method will be used to partition the MESSIDOR dataset for usage in both stages. This dataset comprises 1151 records, 540 records of healthy cases (defined as 0) and 611 records of sick multi-stage DR patients (designated as 1). There are 20 characteristics in the dataset. characteristics histograms were created for visualization and additional evaluation in the model's later phases because it was discovered that the incorporated characteristics had variable effects on the final prediction [20].
3.2 Selection of features
The following method should be used to choose features for the proposed model from the original dataset: The first five and ten most useful characteristics are chosen to create two new sub datasets. In this model, two methods of feature selection will be used: evaluation of the information gain attribute and evaluation of the wrapper subset. Entropy assessment, also known as the information gain attribute evaluation technique, determines the amount of information that an attribute offers by assigning it a number between 0 (no information) and 1 (maximum information). In the classification model, the most useful characteristics are chosen for further processing, while the least informative features are ignored. Wrapper Subset Evaluation is a feature selection technique that compares the performance of various subsets of features from the original dataset using a quick-learning yet potent pre-defined algorithm. The subdataset that performed the best among the others is then chosen as the most useful subdataset.
The original dataset's qualities that are thought to be the most informative are found in this sub-dataset. Figure 3 shows the suggested DR detection framework's layered concept [21].
3.3 Collective learning
Ensemble systems, often referred to as several classifiers schemes, are created by merging information gleaned from several contributing models into a single, conclusive judgment. Additionally, a collective reduces the model efficiency and prediction accuracy's spread or dispersion. Three primary classification algorithms Support vector machines, neural networks, and random forests-were incorporated into this model's ensemble. Due to ensembles' excellent effectiveness while used to forecasting, and difficulties with categorization, and extrapolation, they have recently gained popularity in usage for decision-making systems. This kind of information accumulation improves both the system's overall judgement as a whole and the individual decisions made by each model separately. Performance and Robustness are the two primary factors to consider when choosing a model that is based on a collection rather than just one model; an aggregation can provide more accurate predictions as well as perform more effectively than each individual model alone [22].
There are three steps to the assessment process. First, the model and individual classifiers were assessed in order to determine the best individual classifier, the top 5 on InfoGain, and the highest functioning subdataset. The suggested ensemble outperformed the neural networks in this stage when compared to the ideal individual classifier when assessed on the dataset from Messidor. The next step was to test the current ensemble on each of the four subdatasets, it illustrated the importance of the top five InfoGain Eval features. Table 1 displays the exactness results for every dataset that was used to evaluate the proposed model, as well as how well the ensemble performed using a stacking architecture.
On the dataset from Messidor, a comparison of the suggested ensemble with the top single classifier is shown in Table 2 with regard to of AUC, precision, recall, and accuracy. Additionally, Table 3 analyses the presentation of the chosen feature sets in great detail, indicating the top 5 characteristics of InfoGainEval's remarkable capacity. additionally, displays the preciseness rates reached for the top-performing subdataset by every participating algorithm in relation to the recommended stacking ensemble. Improvements in final predictions were inferred by the results of stacking many categorization techniques, including Support vector machines, neural networks, and random forests [23].
In contrast to earlier models, which were trained and evaluated using a variety of manipulation of images besides enhancement techniques on the dataset of fundus pictures used initially for the model's feature removal was entirely qualified using the features that MESSIDOR had already retrieved. Although no image processing or analysis was done for this investigation, it was extremely difficult to get great rates of correctness with so few features.
Table 1. Compares the accuracy rates of the proposed ensemble and single classifiers
|
|
SVM |
NN |
RF |
Proposed |
|
Original Dataset |
0.69 |
0.71 |
0.68 |
0.92 |
|
Wrapper top 5 |
0.55 |
0.78 |
0.7 |
0.93 |
|
Wrapper top 10 |
0.58 |
0.8 |
0.78 |
0.97 |
|
Infogain top 5 |
0.68 |
0.82 |
0.75 |
0.96 |
|
Infogain top10 |
0.68 |
0.82 |
0.79 |
0.97 |
*mean(std)
Table 2. Performance of the suggested ensemble and the best single classifier on the Messidor dataset
|
|
Accuracy |
Recall |
Precision |
AUC |
|
Best Signal Classifier |
0.91 |
0.82 |
0.88 |
0.94 |
|
Proposed Model |
0.97 |
0.8 |
0.82 |
0.93 |
Table 3. Evaluation of the proposed model using a subset of the Messidor dataset
|
|
Accuracy |
Recall |
Precision |
AUC |
|
Wrapper top 10 |
0.96 |
0.8 |
0.9 |
0.90 |
|
Infogain top10 |
0.97 |
0.82 |
0.82 |
0.91 |
|
Infogain top 5 |
0.95 |
0.8 |
0.82 |
0.96 |
|
Wrapper top 5 |
0.93 |
0.82 |
0.88 |
0.89 |
|
Origina1 Dataset |
0.92 |
0.82 |
0.88 |
0.88 |
Data quantity and quality: The training data's quality and quantity have a significant impact on how well ensemble machine learning models perform. Small, unbalanced, noisy, or inconsistent data in the training dataset might provide unsatisfactory results and generalization problems.
Medical datasets are frequently gathered from certain demographics or healthcare organizations, which may introduce bias into the data collection process. The performance of the model could not translate well across a range of patient demographics if the dataset used for training is not representative of the larger population.
Interpretability: It can be difficult to comprehend ensemble machine learning models, particularly sophisticated ones like random forests or gradient boosting. In a medical setting, understanding why a model generates a certain prediction might be essential, and lack of interpretability can be a severe restriction.
Scalability: Certain ensemble approaches, especially those with high computing complexity, could not scale well to handle significant amounts of medical data in real-time, which could restrict their use in clinical settings.
Overfitting: Ensemble models may over fit the training set if they are not adequately regularized and tweaked. On the training set of data, over fit models may excel, but they cannot generalize to new data.
Ethical and privacy issues: Using machine learning models may pose ethical issues with data security and patient permission. Handling medical data needs rigorous respect to privacy standards (such as HIPAA).
Clinical validation: Before being used in clinical practice, these models must undergo thorough validation and testing to guarantee their efficacy. It might take a lot of time and resources to complete this procedure.
Cost and accessibility: Putting machine learning models into practice in healthcare settings could necessitate a large cost outlay for infrastructure, staff training, and continuous upkeep. Some healthcare institutions may have restricted access to this technology.
Compliance with Ethical Standards
Conflict of interest: On behalf of all authors, the corresponding author states that there is no conflict of interest.
Financial and ethical disclosures: This work is not supported fully or partially by any funding organization or agency.
This study highlights prospective technical developments for the pharmaceutical and health care sectors, particularly in the field of early sickness discovery. Every illness, most notably cancer, Diabetic Retinopathy, abnormal cholesterol levels, is best treated when it is still in its early stages. Automatic detection models may be used by any practitioner once they are comfortable with the model's operation and the way that results are presented. They are also time and money efficient, serving a variety of communities and geographies. In the current study, we provide a novel framework for Ensemble Machine Learning-based Diabetic Retinopathy Detection. Additionally, we used a variety of feature engineering techniques in addition to a sizable a culminating Meta-Classifier is added to a stacking of categorization techniques. to close the performance gap left by the inadequate performance of the prior models. This was done to guarantee obtaining the greatest accuracy while putting into practice a trustworthy and reliable diagnosis approach for a variety of patients throughout the world. It should be emphasized that the present outcomes are just preliminary indications; more ensembles are currently being included to improve the model's overall performance. In future scope, we need to improve the quantity and variety of the dataset, preprocess the photos to eliminate noise, standardize resolution, and carry out any necessary data augmentation.
Data quantity: The training data's quality and quantity have a significant impact on how well ensemble machine learning models perform. Small, unbalanced, noisy, or inconsistent data in the training dataset might provide unsatisfactory results and generalization problems.
Medical datasets: are frequently gathered from certain demographics or healthcare organizations, which may introduce bias into the data collection process. The performance of the model could not translate well across a range of patient demographics if the dataset used for training is not representative of the larger population.
Interpretability: It can be difficult to comprehend ensemble machine learning models, particularly sophisticated ones like random forests or gradient boosting. In a medical setting, understanding why a model generates a certain prediction might be essential, and lack of interpretability can be a severe restriction.
Scalability: Certain ensemble approaches, especially those with high computing complexity, could not scale well to handle significant amounts of medical data in real-time, which could restrict their use in clinical settings.
Overfitting: Ensemble models may over fit the training set if they are not adequately regularized and tweaked. On the training set of data, over fit models may excel, but they cannot generalize to new data.
Ethical and privacy issues: Using machine learning models may pose ethical issues with data security and patient permission. Handling medical data needs rigorous respect to privacy standards (such as HIPAA).
Clinical validation: Before being used in clinical practice, these models must undergo thorough validation and testing to guarantee their efficacy. It might take a lot of time and resources to complete this procedure.
Cost and accessibility: Putting machine learning models into practice in healthcare settings could necessitate a large cost outlay for infrastructure, staff training, and continuous upkeep. Some healthcare institutions may have restricted access to this technology.
Compliance with Ethical Standards: (1) Conflict of Interest: On behalf of all authors, the corresponding author states that there is no conflict of interest. (2) Financial and Ethical disclosures: This work is not supported fully or partially by any funding organization or agency.
[1] Kalantzis, G., Angelou, M., Poulakou-Rebelakou, E. (2006). Diabetic Retinopathy: An historical assessment. Hormones, 5(1): 72-75.
[2] Ross, C., Brodwin, E. (2019). At Mayo Clinic, AI engineers face an ‘acid test’-STAT. https://www.statnews.com/2019/12/18/mayo-clinic-artificial-intelligenc e-acid-test/, accessed Jan. 03, 2021.
[3] Abràmoff, M.D., Reinhardt, J.M., Russell, S.R., Folk, J.C., Mahajan, V.B., Niemeijer, M., Quellec, G. (2010). Automated early detection of Diabetic Retinopathy. Ophthalmology, 117(6): 1147-1154. https://doi.org/10.1016/j.ophtha.2010.03.046.
[4] Scanlon, P. H., Sallam, A., & Van Wijngaarden, P. (Eds.). (2017). A practical manual of Diabetic Retinopathy management. John Wiley & Sons.
[5] Jelinek, H.J., Cree, M.J., Worsley, D., Luckie, A., Nixon, P. (2006). An automated microaneurysm detector as a tool for identification of Diabetic Retinopathy in rural optometric practice. Clinical and Experimental Optometry, 89(5): 299-305. https://doi.org/10.1111/j.1444-0938.2006.00071.x
[6] Antal, B., Hajdu, A. (2012). An ensemble-based system for microaneurysm detection and Diabetic Retinopathy grading. IEEE Transactions on Biomedical Engineering, 59(6): 1720-1726. https://doi.org/10.1109/TBME.2012.2193126
[7] Gargeya, R., Leng, T. (2017). Automated identification of Diabetic Retinopathy using deep learning. Ophthalmology, 124(7): 962-969. https://doi.org/10.1016/j.ophtha.2017.02.008
[8] Bande Bandello, F., Zarbin, M.A., Lattanzio, R., Zucchiatti, I. (2016). Clinical strategies in the management of Diabetic Retinopathy. A step-by-step Guide for Ophthalmologists. https://doi.org/10.1007/978-3-642-54503-0
[9] Scotland, G. S., McNamee, P., Fleming, A. D., Goatman, K. A., Philip, S., Prescott, G. J., Sharp, P.F., Williams, G.J., Wykes, W., Leese, G.P., Olson, J. A. (2010). Costs and consequences of automated algorithms versus manual grading for the detection of referable Diabetic Retinopathy. British Journal of Ophthalmology, 94(6): 712-719. https://doi.org/10.1136/bjo.2008.151126
[10] Keerthiveena, B., Esakkirajan, S., Subudhi, B.N., Veerakumar, T. (2021). A hybrid BPSO-SVM for feature selection and classification of ocular health. IET Image Processing, 15(2): 542-555. https://doi.org/10.1049/ipr2.12047
[11] Zhao, Y.Q., Wang, X.H., Wang, X.F., Shih, F.Y. (2014). Retinal vessels segmentation based on level set and region growing. Pattern Recognition, 47(7): 2437-2446. https://doi.org/10.1016/j.patcog.2014.01.006
[12] Ali, A., Qadri, S., Khan Mashwani, W., Kumam, W., Kumam, P., Naeem, S., Sulaiman, M. (2020). Machine learning based automated segmentation and hybrid feature analysis for Diabetic Retinopathy classification using fundus image. Entropy, 22(5): 567. https://doi.org/10.3390/e22050567
[13] Majumder, S., Kehtarnavaz, N. (2021). Multitasking deep learning model for detection of five stages of Diabetic Retinopathy. IEEE Access, 9: 123220-123230. https://doi.org/10.1109/ACCESS.2021.3109240
[14] Saha, R., Chowdhury, A.R., Banerjee, S. (2016). Diabetic Retinopathy related lesions detection and classification using machine learning technology. In Artificial Intelligence and Soft Computing: 15th International Conference, ICAISC 2016, Zakopane, Poland, pp. 734-745. https://doi.org/10.1007/978-3-319-39384-1_65
[15] Antal, B., Lázár, I., Hajdu, A., Török, Z., Csutak, A., Pető, T. (201). A multi-level ensemble-based system for detecting microaneurysms in fundus images. In 4th International Workshop on Soft Computing Applications, Arad, Romania, pp. 137-142. 10.1109/SOFA.2010.5565609
[16] Quellec, G., Lamard, M., Cazuguel, G., Cochener, B., Roux, C. (2010). Wavelet optimization for content-based image retrieval in medical databases. Medical image analysis, 14(2): 227-241. https://doi.org/10.1016/j.media.2009.11.004
[17] Lalithadevi, B., Krishnaveni, S. (2022). Detection of Diabetic Retinopathy and related retinal disorders using fundus images based on deep learning and image processing techniques: A comprehensive review. Concurrency and Computation: Practice and Experience, 34(19): e7032. https://doi.org/10.1002/cpe.7032
[18] Gulshan, V., Peng, L., Coram, M., Stumpe, M. C., Wu, D., Narayanaswamy, A., Venugopalan, S., Widner, K., Mend, T.M., Cuadros, J., Kim, R., Raman, R., Nelson, P., Mega, J.L., Webster, D.R. (2016). Development and validation of a deep learning algorithm for detection of Diabetic Retinopathy in retinal fundus photographs. Jama, 316(22): 2402-2410. https://doi.org/10.1001/jama.2016.17216
[19] Abbas, Q., Fondon, I., Sarmiento, A., Jiménez, S., Alemany, P. (2017). Automatic recognition of severity level for diagnosis of Diabetic Retinopathy using deep visual features. Medical & biological engineering & computing, 55:959-1974. https://doi.org/10.1007 s11517 -017-1638-6
[20] Chandrakumar, T., Kathirvel, R. (2016). Classifying Diabetic Retinopathy using deep learning architecture. Int J Eng Res Technol, 5(6): 19-24.
[21] Tajudin, N.M.A., Kipli, K., Mahmood, M.H., Lim, L.T., Awang Mat, D.A., Sapawi, R., Hoque, M.E. (2022).Deep learning in the grading of Diabetic Retinopathy: A review. IET Computer Vision, 16(8): 667-682. https://doi.org/10.1049/cvi2.12116
[22] Deshmukh, S.V., Roy, A., Agrawal, P. (2023). Retinal image segmentation for Diabetic Retinopathy detection using U-Net architecture. International Journal of Image, Graphics and Signal Processing, 13(1): 79-92. https://doi.org/10.5815/ijigsp.2023.01.07
[23] Kumar, G., Chatterjee, S., Chattopadhyay, C. (2021). DRISTI: A hybrid deep neural network for Diabetic Retinopathy diagnosis. Signal, Image and Video Processing, 15(8): 1679-1686. https://doi.org/10.1007/s11760-021-01904-7