Alam Rahmatulloh![]() | Galih Tegar Supriatna
| Galih Tegar Supriatna![]() | Nur Widiyasono
| Nur Widiyasono![]() | Irfan Darmawan*
| Irfan Darmawan*![]()
© 2023 IIETA. This article is published by IIETA and is licensed under the CC BY 4.0 license (http://creativecommons.org/licenses/by/4.0/).
OPEN ACCESS
Water service providers are confronted with multifaceted challenges ranging from ensuring service quality to addressing technical issues such as pipeline leaks. Manifestations of such leaks are often detected through diminished water pressure, yet the monitoring systems employed by these providers remain suboptimal. Traditional methodologies for identifying and inspecting distribution issues rely heavily on manual, analog procedures. This study seeks to harness the Internet of Things (IoT) for the development of an enhanced water distribution monitoring system. Employing a quantitative experimental methodology, the proposed system integrates an Arduino Uno microcontroller with sensors for water pressure, flow, and GPS location. Data captured by these sensors is synchronized with the Thinger.io platform via an ESP-32 module, facilitating real-time monitoring. Upon evaluation, it was observed that IoT implementation via Thinger.io could effectively track fluctuations in water discharge and pressure. Recorded data revealed a maximum water discharge of 303 liters, with water pressure values ranging from a low of 0.30 bar to a high of 4.07 bar. The outcome of this research is a visual monitoring framework that provides a dynamic assessment of water discharge and pressure, enabling water service providers to conduct routine evaluations with enhanced precision. This IoT-based approach not only streamlines the monitoring process but also introduces a level of automation that could significantly improve service reliability for drinking water infrastructures.
device integration, distribution, monitoring, Thinger.io, water pressure
Potable water, processed to satisfy health standards and suitable for consumption, remains a critical resource managed by water service providers [1]. These providers confront persistent challenges, including maintaining service quality and resolving technical complications such as pipeline leaks [2]. Manifestations of such leaks are typically indicated by reduced water pressure, a phenomenon underpinned by Bernoulli's principle, which elucidates the inverse relationship between fluid flow velocity and pressure [3].
Current monitoring systems for water distribution employed by drinking water providers are suboptimal, reliant on manual inspections and conventional tools—namely, analog manometers for pressure measurement and flow meters for gauging water discharge [4]. This manual approach, while traditional, proves inefficient, as it necessitates locating checkpoint areas and is susceptible to human error during routine checks.
Concurrently, the Internet of Things (IoT) has emerged as a rapidly advancing concept, revolutionizing connectivity and data exchange across various applications [5, 6]. In the realm of water monitoring [7-10], IoT devices have demonstrated their utility in communication, information sharing, and the coordination of decisions through network-integrated data analysis [11]. Prior studies have introduced IoT-based water monitoring systems incorporating components such as the SEN-HZ21WA water flow sensor, Arduino Uno, and wireless communications [12-15].
Despite these advances, existing research has not fully explored the integration of water pressure sensors, water flow sensors, and the Global Positioning System (GPS) within a singular IoT-based monitoring framework. Pressure sensors are vital for assessing a range of pressures, while water flow sensors quantify fluid discharge, and GPS modules provide precise location tracking [16-18]. Such GPS data are instrumental in pipeline network development, mapping, and rapid problem resolution, with technical pipeline construction also considering geographical elevations [19, 20]. Pressure mapping, therefore, becomes a critical process for monitoring at various points within water distribution lines, particularly where pressure fluctuations are most pronounced [21, 22].
This study aims to develop a system capable of optimizing water distribution monitoring through the application of IoT technology, incorporating I2C LCD components, buzzers, a GPS module, water pressure sensors, water flow sensors, and the Arduino Uno microcontroller as the central control unit. The novelty of this research lies in its application of GPS technology to enhance the precision of monitoring locations. The ESP-32 WLAN module is selected for its SoC integration and WiFi connectivity, facilitating internet access [23-25]. The Thinger.io IoT cloud platform serves as the dashboard interface, displaying real-time sensor data and simplifying the monitoring process in systems utilizing IoT [26]. The proposed device will be strategically placed at critical points within the distribution network, where pressure fluctuations are most severe, to enable efficient identification of issues and facilitate routine assessments by water service providers.
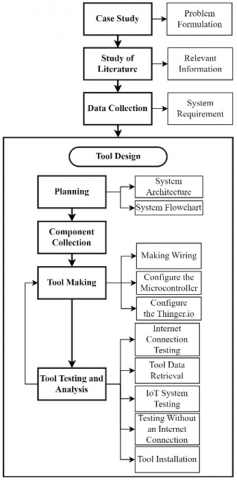
Internet of Things-based water distribution monitoring using Thinger.io was developed using Arduino's microcontroller. Arduino receives input from sensors reading water pressure and water flow. Arduino will process input values into data that can be displayed. Then, the data is synchronized through the ESP-32 communication module to the Thinger.io IoT cloud platform so that water distribution information can be monitored via the Thinger.io dashboard in real time and can be done remotely via desktop or mobile. Therefore, it takes several steps to design this tool, including the tool design, the components needed, configuration, and the tool's testing stage so that the tool's results and performance follow the planned plan. The research stages must be sequential, from the case study to drawing conclusions so that the results can be obtained according to the plan; the research stages are shown in Figure 1.
Figure 1. Research stages
2.1 Case study
The case study in this research began with a drinking water supply company called "Perumda Air Drinking Tirta Sukapura, Tasikmalaya Regency," which needed a digital water distribution monitoring tool that could monitor water distribution information in real-time and be accessed from anywhere.
2.2 Tool design
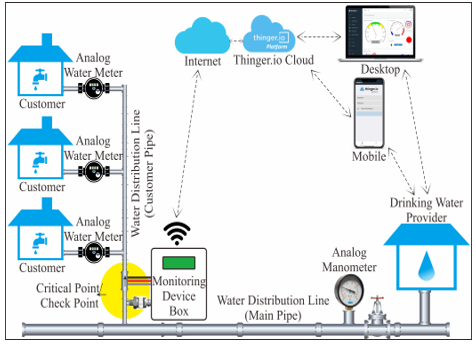
The stages for tool design are the system architecture diagram of water distribution monitoring aimed in Figure 2.
Figure 2. System architecture diagram of water distribution monitoring
Testing and analysis are essential stages in building a system. The test aims to determine the system's performance, including testing internet connections and sensors. Based on the testing results, the system's deficiencies can be identified so that evaluation can help improve the system.
3.1 Water distribution monitoring functional diagram
The functional diagram details the component flow diagram of the system architecture that was previously made; the functional diagram is used as an example of tool implementation, and a functional diagram for monitoring water distribution is created, as shown in Figure 3.
Figure 3. Functional diagram of water distribution monitoring
3.2 Tool components of water distribution monitoring
The components used in making the water distribution monitoring tool are shown in Table 1.
Table 1. Water distribution monitoring tool components
|
Component |
Amount |
Function |
|
Arduino Uno |
One piece |
Microcontroller |
|
ESP-32 |
Two pieces |
Microcontroller and Communications |
|
LCD 16x2 I2C |
One piece |
Displays |
|
Water Pressure Sensor |
One piece |
Inputs |
|
Water Flow Sensor |
One piece |
Inputs |
|
Buzzer |
One piece |
Alarm Outputs |
|
Cable |
Enough |
Connector |
3.3 Tool components of water distribution monitoring
The results of the tool configuration based on the previously planned designs are as follows:
(1) Making the wiring is the stage of wiring each component to be used. The wiring diagram for each connected component is shown in Figure 4.
(2) Tool configuration is the stage after all components are combined and configured so that the tool can function according to plan. The configuration of the tool is as follows:
a. Microcontroller configuration using Arduino IDE
The microcontroller configuration stage, namely programming the Arduino Uno and ESP-32 devices through the Arduino IDEs software.
b. Thinger.io configuration
The Thinger.io configuration stage aims to synchronize the water distribution monitoring tool with the Thinger.io server. Configuration is done by registering the device on Thinger.io.
Figure 4. Wiring diagram of water distribution monitoring
3.4 Tool testing results
Testing is done by testing the function of the entire system. The series of tests that have been carried out are as follows.
(1) Results of water pressure sensor and analog manometer readings
Table 2 shows that the results of testing the water pressure sensor readings show that the average error value of this comparison is ± 0.01%. The average error value in the water pressure sensor test is still within the range of the maximum error limit, which is ± 1% based on the reference from ASME B40.100.
(2) Water flow sensor test results
Based on Table 3, the results of testing the water flow sensor readings show that the average error value of this comparison is 0.058%. The average error value in the water flow sensor test is still within the range of the maximum error limit, which is ± 5% based on the reference from SNI 2547 2008.
(3) GPS sensor testing results
Based on Table 4. the results of testing the GPS sensor readings show that the average error value of this comparison is 5 meters. Testing the GPS module requires ± 10-15 minutes to lock the signal from the satellite.
(4) Test results for ESP-32 connection to Thinger.io server
The ESP-32 connection determines whether the ESP-32 has been connected to the Thinger.io server. Monitoring the connection status of the ESP-32 device with Thinger.io can be done by observing the status on the Devices tab menu and then selecting the device to watch.
Based on Figure 5, which is a display of the status of Internet of Things devices on Thinger.io, it can be concluded that the status of the device has been connected based on an indicator in the form of a green box that reads “Online.”
(5) Results of water pressure sensor data synchronization test with Thinger.io
The water pressure sensor data synchronization test determines whether the water pressure sensor input is synchronized with the dashboard Thinger.io. The trial begins with measuring the speed of receiving water pressure data on the ESP-32 from Arduino Uno; the results of testing the speed of receiving water pressure data on Thinger.io from ESP-32 are shown in Table 5.
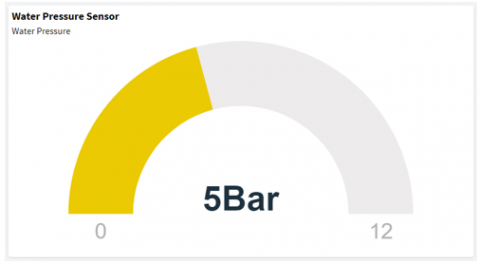
Based on Table 5, the results of the speed of receiving water pressure data on Thinger.io from ESP-32 show that the average latency value is 1380 milliseconds or 1.3 seconds. Monitoring the water pressure sensor data synchronized with Thinger.io can be done by observing the dashboard on the dashboard tab menu and selecting the device to watch. The water pressure data dashboard on Thinger.io is shown in Figure 6.
(6) Results of water flow sensor data synchronization test with Thinger.io
The water flow sensor data synchronization test determines whether the water discharge from the water flow sensor input has been synchronized with the dashboard Thinger.io. The first test, namely testing the speed of receiving water discharge data on Thinger.io from ESP-32, shows results in Table 6.
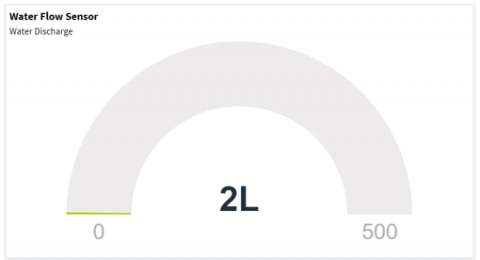
Table 6 shows that the speed of receiving water discharge data on Thinger.io from ESP-32 shows that the average latency value is 1357.7 milliseconds or 1.3 seconds. Monitoring water discharge data from a water flow sensor synchronized with Thinger.io can be done by observing the dashboard on the dashboard tab menu and selecting the device to watch. The water discharge data dashboard on Thinger.io is shown in Figure 7.
(7) GPS sensor data synchronization test results with Thinger.io
The GPS sensor data synchronization test determines whether the water pressure sensor input has been synchronized with the dashboard Thinger.io. The test that was first, namely measuring the speed of receiving GPS sensor data on Thinger.io from ESP-32, the test results are shown in Table 7.
Table 7 shows that the speed of receiving GPS coordinate data on Thinger.io from ESP-32 shows that the average latency value is 1157.3 milliseconds or 1.1 seconds.
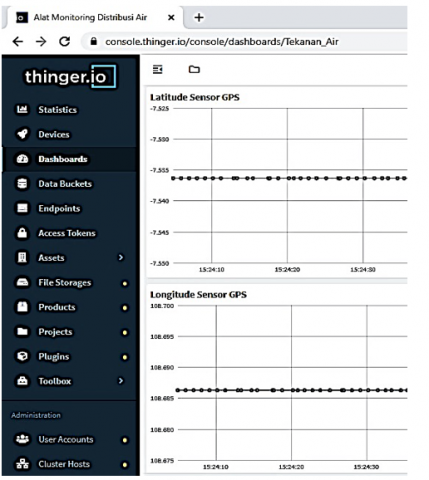
GPS coordinate data synchronized with Thinger.io can be done by observing the dashboard on the dashboard tab menu and selecting the device to monitor. The GPS coordinates dashboard on Thinger.io is shown in Figure 8.
(8) Thinger.io storage test results
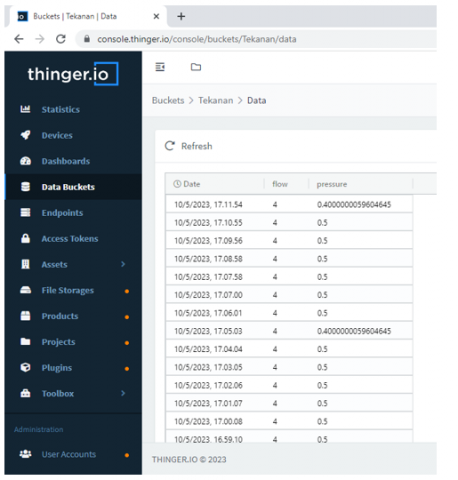
Storage testing on Thinger.io is conducted to determine whether the storage system on Thinger.io can store data. The storage feature on Thinger.io is called Data Buckets, which you can open the Data Buckets tab menu and then select the device to view.
Based on Figure 9. it can be concluded that the Databuckets Thinger.io feature has stored the data and the time series. The data stored on Databuckets is the same data that is displayed on the Thinger.io Dashboard. The data buckets storage system saves data in 1-minute intervals and can be exported in multiple formats for offline processing.
Table 2. Results of water pressure sensor and analog manometer readings
|
No. of Tests |
Water Pressure Sensor Reading (Bar) |
Analog Manometer Reading (Bar) |
Errors (%) |
|
1 |
1.6 |
1.5 |
0.10 |
|
2 |
1.7 |
1.7 |
0.00 |
|
3 |
1.8 |
1.9 |
0.10 |
|
4 |
1.9 |
1.9 |
0.00 |
|
5 |
1.9 |
1.8 |
0.10 |
|
6 |
2 |
2 |
0.00 |
|
7 |
2 |
2 |
0.00 |
|
8 |
2 |
2.1 |
0.10 |
|
9 |
2.1 |
2.1 |
0.00 |
|
10 |
2.2 |
2.3 |
0.10 |
|
Error rate |
0.01 |
||
Table 3. Results of water flow sensor and measuring cup readings
|
No. of Tests |
Water Flow Sensor Reading (Liters) |
Reading Measuring Cup (Liters) |
Errors (%) |
|
1 |
0.16 |
0.15 |
0.01 |
|
2 |
0.22 |
0.2 |
0.02 |
|
3 |
0.36 |
0.3 |
0.06 |
|
4 |
0.49 |
0.45 |
0.04 |
|
5 |
0.56 |
0.5 |
0.06 |
|
6 |
0.66 |
0.6 |
0.06 |
|
7 |
0.75 |
0.7 |
0.05 |
|
8 |
0.9 |
0.8 |
0.1 |
|
9 |
0.98 |
0.9 |
0.08 |
|
10 |
1.1 |
1 |
0.1 |
|
Error rate |
0.058 |
||
Table 4. GPS sensor reading results on the device and GPS sensor on smartphone
|
No. of Tests |
GPS Sensor Location Coordinates |
Smartphone GPS Sensor Location Coordinates |
Errors (meters) |
||
|
Latitudes |
Longitude |
Latitudes |
Longitude |
||
|
1 |
-7.536309 |
108.686302 |
-7.5363013 |
108.6862438 |
5 |
|
2 |
-7.536309 |
108.686302 |
-7.5363013 |
108.6862438 |
5 |
|
3 |
-7.536309 |
108.686302 |
-7.5363013 |
108.6862438 |
5 |
|
4 |
-7.536309 |
108.686302 |
-7.5363013 |
108.6862438 |
5 |
|
5 |
-7.536309 |
108.686302 |
-7.5363013 |
108.6862438 |
5 |
|
6 |
-7.536309 |
108.686302 |
-7.5363013 |
108.6862438 |
5 |
|
7 |
-7.536309 |
108.686302 |
-7.5363013 |
108.6862438 |
5 |
|
8 |
-7.536309 |
108.686302 |
-7.5363013 |
108.6862438 |
5 |
|
9 |
-7.536309 |
108.686302 |
-7.5363013 |
108.6862438 |
5 |
|
10 |
-7.536309 |
108.686302 |
-7.5363013 |
108.6862438 |
5 |
|
Average |
5 |
||||
Table 5. Results of testing the speed of receiving water pressure data on Thinger.io from ESP-32
|
No. of Tests |
Water Pressure Data (bar) |
Data Transfer Time on the ESP-32 (24-Hour Time Format) GMT+7 |
Data Receiving Time on Thinger.io (24-Hour Time Format) GMT+7 |
Latency (ms) |
|
1 |
5.5 |
18:06:37,534 |
18:06:39.391 |
1857 |
|
2 |
5.4 |
18:06:38,520 |
18:06:39.427 |
907 |
|
3 |
5.4 |
18:06:39,519 |
18:06:40.429 |
910 |
|
4 |
5.5 |
18:06:40,506 |
18:06:41.398 |
892 |
|
5 |
5.4 |
18:06:41.515 |
18:06:43.379 |
1864 |
|
6 |
5.4 |
18:06:42,518 |
18:06:43.889 |
1371 |
|
7 |
5.2 |
18:06:43.534 |
18:06:45.406 |
1872 |
|
8 |
5.3 |
18:06:44,518 |
18:06:45.846 |
1328 |
|
9 |
5.2 |
18:06:45.505 |
18:06:46.410 |
905 |
|
10 |
5.2 |
18:06:46.521 |
18:06:48.415 |
1894 |
|
Average |
1380 |
|||
Table 6. Results of testing the speed of receiving water discharge data on Thinger.io from ESP-32
|
No. of Tests |
Water Debit Data (Liters) |
Data Transfer Time on the ESP-32 (24-Hour Time Format) GMT+7 |
Data Receiving Time on Thinger.io (24-Hour Time Format) GMT+7 |
Latency (ms) |
|
1 |
1.08 |
18:06:37.534 |
18:06:39.391 |
1857 |
|
2 |
1.08 |
18:06:38.549 |
18:06:39.427 |
878 |
|
3 |
1.08 |
18:06:39.550 |
18:06:40.429 |
879 |
|
4 |
1.08 |
18:06:40.539 |
18:06:41.398 |
859 |
|
5 |
1.08 |
18:06:41.547 |
18:06:43.379 |
1832 |
|
6 |
1.08 |
18:06:42.550 |
18:06:43.889 |
1339 |
|
7 |
1.08 |
18:06:43.534 |
18:06:45.406 |
1872 |
|
8 |
1.08 |
18:06:44.550 |
18:06:45.846 |
1296 |
|
9 |
1.08 |
18:06:45,539 |
18:06:46.410 |
871 |
|
10 |
1.08 |
18:06:46.521 |
18:06:48.415 |
1894 |
|
Average |
1357,7 |
|||
Table 7. Results of testing the speed of receiving GPS coordinate data on Thinger.io from ESP-32
|
No. of Tests |
GPS Sensor Location Coordinates |
Data Sending Time on ESP-32 (24-Hour Time Format) GMT+7 |
Data Receiving Time on Thinger.io (24-Hour Time Format) GMT+7 |
Latency (milliseconds) |
|
|
Latitudes |
Longitude |
||||
|
1 |
-7.536309 |
108.686302 |
15:24:11.241 |
15:24:12.814 |
1573 |
|
2 |
-7.536309 |
108.686302 |
15:24:12.248 |
15:24:13.198 |
950 |
|
3 |
-7.536309 |
108.686302 |
15:24:13.278 |
15:24:14.336 |
1058 |
|
4 |
-7.536309 |
108.686302 |
15:24:14.340 |
15:24:15.670 |
1330 |
|
5 |
-7.536309 |
108.686302 |
15:24:15,386 |
15:24:16.468 |
1082 |
|
6 |
-7.536309 |
108.686302 |
15:24:16.440 |
15:24:17.504 |
1064 |
|
7 |
-7.536309 |
108.686302 |
15:24:17.535 |
15:24:18.753 |
1218 |
|
8 |
-7.536309 |
108.686302 |
15:24:18,540 |
15:24:19.404 |
864 |
|
9 |
-7.536309 |
108.686302 |
15:24:19,604 |
15:24:20.568 |
964 |
|
10 |
-7.536309 |
108.686302 |
15:24:20.652 |
15:24:22.122 |
1470 |
|
Average |
1157,3 |
||||
Table 8. Email notification test results from Thinger.io
|
No. of Tests |
Water Pressure (Bars) |
Condition of Water Faucet Switch |
Email Notifications |
|
1 |
0.7 |
Open |
Not Received |
|
2 |
0.4 |
Closed |
Received |
|
3 |
0.6 |
Open |
Not Received |
|
4 |
0.3 |
Closed |
Received |
|
5 |
0.7 |
Open |
Not Received |
|
6 |
0.2 |
Closed |
Received |
|
7 |
0.7 |
Open |
Not Received |
|
8 |
0.4 |
Closed |
Received |
|
9 |
0.8 |
Open |
Not Received |
|
10 |
0.3 |
Closed |
Received |
Figure 5. Devices status on Thinger.io
Figure 6. Water pressure data dashboard on Thinger.io
Figure 7. Water discharge data dashboard on Thinger.io
Figure 8. GPS coordinate data dashboard on Thinger.io
(9) Email notification test results from Thinger.io
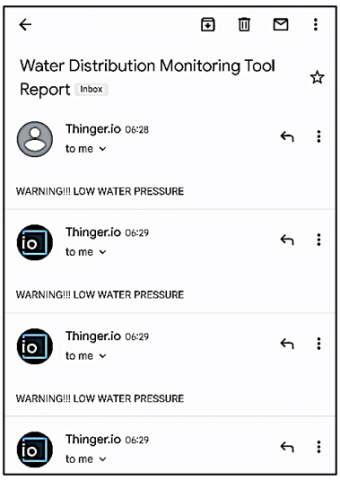
Email notification testing was conducted to see if Thinger.io can send email notifications. The notification feature on Thinger.io is called Endpoints; this feature allows Thinger.io to send messages in the form of email or social media messages. In this test, Thinger.io email notifications are configured to detect a drop in water pressure. For example, a water pressure drop warning is set at 0.5 bar. Then, if the water pressure is below 0.5 bar, Thinger.io will email the personal email address that has been determined.
The water pressure drop detection test is done by closing and opening the water faucet switch that goes to the water pressure sensor to ensure email can be sent. The condition of the water faucet switch in open and closed conditions is shown in Figure 10 and Figure 11.
Then, the table is recorded following the tests; the results of the email notification test are shown in Table 8. Table 8 shows that email is received when Thinger.io detects a drop in water pressure below 0.5 bar, while email is not received when water pressure is above 0.5 bar. The results of email notifications received from Thinger.io endpoints are shown in Figure 12.
Figure 9. Data buckets storage on Thinger.io
(10) Water distribution monitoring equipment
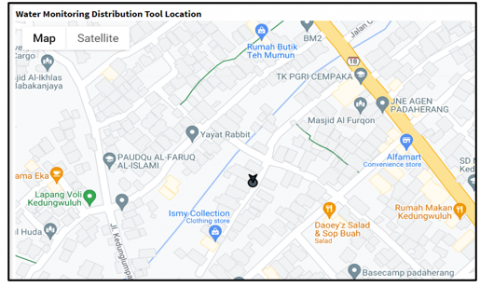
This test is the main objective of this research, namely the application of the Internet of Things concept to the water distribution monitoring tool. This testing process includes data collection according to the sensor installation location from the water distribution monitoring device; data collection is carried out for 24 hours and then analyzed to determine the total water discharge and rising water pressure at certain hours. Fluctuations in water pressure are related to the intensity of water use for each customer; the higher the water user, the lower the water pressure value will decrease, and when the water user decreases, the water pressure value will increase again. Installation of devices on water distribution lines, especially at critical points or checkpoints with monitoring parameters of water pressure, water discharge, and location, aims to make it easier for drinking water providers or Regional Drinking Water Company (PDAM) to ensure water availability for their customers. Figure 13 is the location of the monitoring device installation based on the coordinates of the device's GPS sensor.
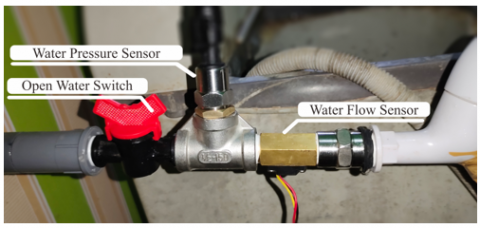
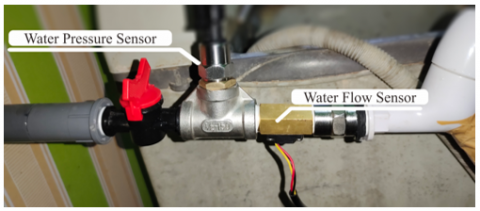
Based on Figure 13, the device is installed by the location of the sensor, namely the author's residence, as an example of a critical point or checkpoint area. Figure 14 is a form of installation of the water pressure and airflow sensors. Then the test results are displayed in Table 9.
Based on Table 9. it can be concluded that the lowest water pressure value occurs at 16:38 GMT+7 to 17:38 GMT+7 with water pressure at 0.30 bar, while the highest water pressure occurs at 01:38 GMT +7 to 02:38 GMT +7 with water pressure at 4.07 bar.
Based on several tests that have been carried out, these results align with this research's aim, namely monitoring water distribution and the location of its application. The test results for the average latency value show the data transfer speed, which is included in real-time communication. This greatly influences the tool's ability to monitor; the faster the data transfer time, the faster the monitoring response will be produced.
Figure 10. Condition of open water faucet switch
Figure 11. Condition of closed water faucet switch
Figure 12. Email notifications from endpoints Thinger.io
Figure 13. Location of water distribution monitoring tool installer
Figure 14. Installation of water pressure sensor and water flow sensor
Table 9. Test results for installing water distribution monitoring equipment
|
No. |
Test Date |
Testing Time (24-Hour Time Format) GMT+7 |
Water Pressure (bars) |
Water Discharge (liters) |
|
1 |
10/05/2023 |
15:38-16:38 |
0.68 |
4 |
|
2 |
10/05/2023 |
16:38-17:38 |
0.30 |
8 |
|
3 |
10/05/2023 |
17:38-18:38 |
1.39 |
10 |
|
4 |
10/05/2023 |
18:38-19:38 |
2.54 |
10 |
|
5 |
10/05/2023 |
19:38-20:38 |
2.89 |
12 |
|
6 |
10/05/2023 |
20:38-21:38 |
3.44 |
13 |
|
7 |
10/05/2023 |
21:38-22:38 |
3.72 |
13 |
|
8 |
11/05/2023 |
22:38-23:38 |
3.87 |
13 |
|
9 |
11/05/2023 |
23:38-00:38 |
3.95 |
13 |
|
10 |
11/05/2023 |
00:38-01:38 |
4.05 |
14 |
|
11 |
11/05/2023 |
01:38-02:38 |
4.07 |
14 |
|
12 |
11/05/2023 |
02:38-03:38 |
3.93 |
14 |
|
13 |
11/05/2023 |
03:38-04:38 |
3.01 |
14 |
|
14 |
11/05/2023 |
04:38-05:38 |
1.12 |
23 |
|
15 |
11/05/2023 |
05:38-06:38 |
0.43 |
23 |
|
16 |
11/05/2023 |
06:38-07:38 |
0.69 |
23 |
|
17 |
11/05/2023 |
07:38-08:38 |
1.18 |
23 |
|
18 |
11/05/2023 |
08:38-09:38 |
1.09 |
24 |
|
19 |
11/05/2023 |
09:38-10:38 |
1.54 |
237 |
|
20 |
11/05/2023 |
10:38-11:38 |
2.05 |
269 |
|
21 |
11/05/2023 |
11:38-12:38 |
1.83 |
269 |
|
22 |
11/05/2023 |
12:38-13:38 |
1.74 |
269 |
|
23 |
11/05/2023 |
13:38-14:38 |
2.22 |
269 |
|
24 |
11/05/2023 |
14:38-15:38 |
1.29 |
303 |
The application of the Internet of Things basis allows information on water pressure and water debit values from checkpoints to be known from anywhere, especially from the office of the drinking water provider, because the Thinger.io platform can display the water debit value via the Internet. The lowest water pressure value is obtained at 0.30 bar, while the highest water pressure value is obtained at 4.07 bar when testing. The calculated water discharge value at the time of testing is 303 liters. This value is obtained from the Thinger.io storage feature. Critical points or checkpoints can be monitored remotely.
This research still has various limitations, including device connectivity, which is still limited to the existing wireless network; further research can add data connections, such as using a SIM 7600 to use cellular data for internet connectivity. Apart from that, more in-depth research is needed regarding tool packaging to make it more practical.
[1] Tsoukalas, D.S., Tsitsifli, S. (2018). A critical evaluation of Water Safety Plans (WSPs) and HACCP implementation in water utilities. Proceedings, 600. https://doi.org/10.3390/proceedings2110600
[2] Korlapati, N.V.S., Khan, F., Noor, Q., Mirza, S., Vaddiraju, S. (2022). Review and analysis of pipeline leak detection methods. Journal of Pipeline Science and Engineering, 2(4): 100074. https://doi.org/10.1016/j.jpse.2022.100074.
[3] Abidin, K., Wagiani, S. (2013). Studi analisis perbandingan kecepatanaliran air melalui. Jurnal Dinamika, 4(1): 62-78.
[4] Iyengar, R.R. (2016). The water flow monitoring module. International Journal of Engineering Research and General Science, 4(3): 106-113.
[5] Rahmatulloh, A., Gunawan, R., Sulastri, H., Pratama, I., Darmawan, I. (2021). Face mask detection using haar cascade classifier algorithm based on internet of things with telegram bot notification. In 2021 International Conference Advancement in Data Science, E-learning and Information Systems (ICADEIS), Bali, Indonesia, pp. 1-6. https://doi.org/10.1109/ICADEIS52521.2021.9702065
[6] Widiyasono, N., Rahmatulloh, A., Firmansah, H. (2020). Automatic email alert on the internet of things-based smart motion detection system. In ICONISTECH-1 2019: Selected Papers from the 1st International Conference on Islam, Science and Technology, Bandung, Indonesia, pp. 133. https://doi.org/10.4108/eai.11-7-2019.2297829
[7] Rahmatulloh, A., Wahyudin, D., Widiyasono, N., Darmawan, I. (2022). IoT-based temperature monitoring system for smart cage. In 2022 International Conference on Advanced Creative Networks and Intelligent Systems (ICACNIS), Bandung, Indonesia, pp. 1-6. https://doi.org/10.1109/ICACNIS57039.2022.10055769
[8] Rahmatulloh, A., Sari, D.W., Shofa, R.N., Darmawan, I. (2021). Microservices-based IoT monitoring application with a domain-driven design approach. In 2021 International Conference Advancement in Data Science, E-learning and Information Systems (ICADEIS), Bali, Indonesia, pp. 1-8. https://doi.org/10.1109/ICADEIS52521.2021.9701966
[9] Rahmatulloh, A., Nursuwars, F.M., Darmawan, I., Febrizki, G. (2020). Applied internet of things (IoT): The prototype bus passenger monitoring system using PIR sensor. In 2020 8th International Conference on Information and Communication Technology (ICoICT), Yogyakarta, Indonesia, pp. 1-6. https://doi.org/10.1109/ICoICT49345.2020.9166420
[10] Nursuwars, F.M.S., Rahmatulloh, A. (2019). RFID for nurse activity monitoring in the hospital’s nurse call system with Internet of Thing (IoT) concept. In IOP Conference Series: Materials Science and Engineering, 550(1): 012025. https://doi.org/10.1088/1757-899x/550/1/012025
[11] Serpanos, D., Wolf, M. (2017). Internet-of-things (IoT) systems: Architectures, algorithms, methodologies. Springer. https://doi.org/10.1007/978-3-319-69715-4
[12] Wiryadinata, R., Butar-butar, B.F. (2018). Rancang bangun alat meteran air digital menggunakan sensor aliran air SEN-HZ21WA. VOLT: Jurnal Ilmiah Pendidikan Teknik Elektro, 3(1): 26-36. https://doi.org/10.30870/volt.v3i1.3585
[13] Kusuma, H.A., Purbakawaca, R., Pamungkas, I.R., Fikry, L.N., Maulizar, S.S. (2021). Design and implementation of IoT-based water pipe pressure monitoring instrument. Jurnal Elektronika dan Telekomunikasi, 21(1): 41-47. https://doi.org/10.14203/jet.v21.41-44
[14] Hamdi, M., Rehman, A., Alghamdi, A., Nizamani, M.A., Missen, M.M.S., Memon, M.A. (2021). Internet of things (IoT) based water irrigation system. International Journal of Online & Biomedical Engineering, 17(5): 22081. https://doi.org/10.3991/ijoe.v17i05.22081
[15] Pérez-Padillo, J., García Morillo, J., Ramirez-Faz, J., Torres Roldán, M., Montesinos, P. (2020). Design and implementation of a pressure monitoring system based on iot for water supply networks. Sensors, 20(15): 4247. https://doi.org/10.3390/s20154247
[16] Hartanto, E.T., Widodo, E., Prabowo, A.R., Sulaiman, S. (2020). Design of pressure measurement in the exercise smart mine using a pressure sensor. Journal Asro, 11(2): 166. https://doi.org/10.37875/asro.v11i2.279
[17] Hakim, D.P.A.R., Budijanto, A., Widjanarko, B. (2018). Sistem monitoring penggunaan air PDAM pada rumah tangga menggunakan mikrokontroler Nodemcu Berbasis Smartphone Android. Jurnal Iptek, 22(2): 9-18. https://doi.org/10.31284/j.iptek.2018.v22i2.259
[18] Yuniati, Y., Ulvan, M. (2017). Implementasi modul global positioning system (GPS) pada sistem tracking bus rapid transit (BRT) lampung menuju smart transportation. Jurnal Sains, Teknologi dan Industri, 14(2): 150-156.
[19] Ardiansyah, A., Kardono, K. (2017). Sistem informasi geografis (sig) pemetaan jaringan pipa dan titik properti pelanggan di pt aetra air Tangerang. Jurnal Ilmiah FIFO, 9(1): 81-89. https://doi.org/10.22441/fifo.v9i1.1445
[20] Kusuma, A.B. (2018). Pemanfaatan sistem informasi geografis dalam evaluasi kinerja penyediaan air minum perpipaan (Studi kasus sistem lendah kabupaten kulon Progo). Jurnal Geografi, 10(1): 14-25. https://doi.org/10.24114/jg.v10i1.8629
[21] Pamungkas, P., Musfiroh, I. (2023). Pemetaan suhu chiller penyimpanan produk rantai dingin pada salah satu PBF (Pedagang besar farmasi) di Jakarta. Majalah Farmasetika, 8(4): 373-385. https://doi.org/10.24198/mfarmasetika.v8i4.46676
[22] Ambarwati, W., Johan, Y. (2016). Sejarah dan perkembangan ilmu pemetaan. Jurnal Enggano, 1(2): 80-82. https://doi.org/10.31186/jenggano.1.2.80-82
[23] El-saba, M.H. (2022). Introduction to microcontrollers & embedded systems. https://www.researchgate.net/profile/Muhammad-El-Saba/publication/349812349_Introduction_to_Microcontrollers_Embedded_Systems/links/6148a125a3df59440b9d3bee/Introduction-to-Microcontrollers-Embedded-Systems.pdf
[24] Zlatanov, N. (2016). Arduino and open source computer hardware and software. Journal of Water, Sanitation and Hygiene for Development, 10(11): 1–8. https://doi.org/10.13140/RG.2.1.1071.7849
[25] Wagyana, A. (2019). Prototipe modul praktik untuk pengembangan aplikasi internet of things (IoT). Setrum: Sistem Kendali-Tenaga-elektronika-telekomunikasi-komputer, 8(2): 238-247. https://doi.org/10.36055/setrum.v8i2.6561
[26] WP, P.N.S., Nama, G.F., Komarudin, M. (2022). Sistem pengendalian kadar ph dan penyiraman tanaman hidroponik model wick system. Jurnal Informatika dan Teknik Elektro Terapan, 10(1): 17-23. https://doi.org/10.23960/jitet.v10i1.2260