Bollu Manikyala Rao*![]() | Mohammed Ali Hussain
| Mohammed Ali Hussain![]()
© 2023 IIETA. This article is published by IIETA and is licensed under the CC BY 4.0 license (http://creativecommons.org/licenses/by/4.0/).
OPEN ACCESS
In this paper, we present a machine learning-based approach for the detection of glucose levels in type 2 diabetes patients. Our approach utilizes physiological parameters such as Body Mass Index (BMI), age, sex, and blood pressure, along with glucose levels, to train a predictive model. A dataset comprising demographic information, clinical history, and laboratory test results of 500 type 2 diabetes patients was collected for training and validation. Logistic regression, support vector machines, and random forest classifiers were trained and evaluated using various performance metrics, including accuracy, sensitivity, specificity, and area under the Receiver Operating Characteristic (ROC) curve. Results showed that the random forest classifier outperformed the other models, achieving an accuracy of 85% and an AUC-ROC score of 0.90. Feature importance analysis identified age, BMI, and blood pressure as the most critical predictors for glucose level detection in type 2 diabetes patients. Our proposed machine learning-based approach demonstrates promising results for the accurate detection of glucose levels in type 2 diabetes patients. It has the potential to assist healthcare professionals in making timely and accurate decisions regarding diabetes management. Furthermore, our findings provide valuable insights into the essential predictors for glucose level detection, which can guide future research in this area.
type 2 diabetes, glucose levels detection, machine learning, physiological parameters, random forest classifier, performance metrics
Diabetes, a chronic disease of considerable global impact, affects a significant portion of the worldwide population. Type 2 diabetes, distinguished by elevated blood glucose levels due to insulin resistance and relative insulin deficiency, is particularly prevalent. The imperative for monitoring blood glucose levels lies in its capacity to facilitate the adjustment of therapeutic approaches and prevent complications. Traditional glucose monitoring techniques, such as Self-Monitoring Blood Glucose (SMBG), are invasive and time-consuming, often resulting in poor patient compliance. Machine learning (ML) techniques, leveraging advancements in medical sensor technology and data analytics, have been identified as a promising alternative for glucose level detection in type 2 diabetes. Numerous studies in recent years have investigated the potential of ML models in predicting blood glucose levels, achieving high accuracy rates while reducing the patient burden. However, the intricate and non-linear nature of glucose level dynamics presents significant challenges in developing accurate and robust ML models.
In this study, a novel algorithm for glucose level detection in type 2 diabetes employing machine learning is proposed. This algorithm capitalizes on advanced ML techniques and statistical analysis to extract insightful features from glucose level data and construct accurate predictive models. Comprising four main stages—data pre-processing, feature extraction, model development, model evaluation—the proposed algorithm is assessed on a real-world dataset, featuring glucose level measurements collected from type 2 diabetes patients. The experimental results underscore the efficacy and robustness of the proposed algorithm, which achieves high accuracy rates and outperforms state-of-the-art approaches. The clinical applicability of the proposed algorithm for glucose level monitoring holds substantial potential for facilitating timely interventions and preventing complications.
Type 2 Diabetes Mellitus (T2DM), a chronic metabolic disorder marked by elevated blood glucose levels (BGLs), necessitates accurate detection and monitoring of BGLs for effective management and prevention of complications. Traditional blood glucose tests, which are invasive, present discomfort and pain for patients, thus necessitating the development of non-invasive, cost-effective techniques for BGL detection. Machine learning (ML) algorithms have demonstrated potential in accurately detecting and predicting BGLs in T2DM patients. In this study, a novel ML approach—GLiT2D-for BGL detection in T2DM patients is proposed. Leveraging a combination of feature engineering and ML algorithms, GLiT2D predicts BGLs from non-invasive physiological data, holding the potential to enhance the accuracy and efficiency of BGL detection in T2DM patients, thereby facilitating better disease management and improved patient outcomes.
The World Health Organization (WHO) identifies diabetes as a burgeoning global health concern, affecting millions of people globally. It is estimated that the current diabetic population of over 400 million is expected to surge to 700 million by 2045 [1]. Characterized by high blood glucose levels and insulin resistance, type 2 diabetes accounts for nearly 90% of all diabetes cases [2]. Machine learning (ML) advancements have shown promise in enhancing the accuracy and efficiency of diabetes diagnosis and management. ML algorithms can process large datasets, identifying patterns and relationships that may elude human observers. For instance, a study by Wang et al. [3] employed a support vector machine (SVM) model to predict the risk of type 2 diabetes in a Chinese population. The model achieved an accuracy of 81.5%, outperforming traditional risk models.
Several studies have explored machine learning (ML) approaches for predicting blood glucose levels in patients with type 2 diabetes. Iparraguirre-Villanueva et al. [4] suggested a machine learning-based methodology for blood glucose prediction, utilizing multiple algorithms, including decision trees, artificial neural networks, and support vector regression. The data, gathered from a hospital database, yielded a prediction accuracy of 83.5% using the support vector regression algorithm. Table 1 shows the comparison of related approaches. Table 2 shows comparison of proposed and existing approaches.
Table 1. A comparison of related approaches
|
Reference |
Author Contribution |
Methodology |
Dataset Used |
Application |
Limitation |
|
Iparraguirre-Villanueva et al. [4] |
Developed a machine learning model for predicting blood glucose levels in type 2 diabetes patients |
Support Vector Regression (SVR) |
Clinical dataset of 502 patients |
Clinical decision support system |
Small dataset size and lack of external validation |
|
Gupta et al. [5] |
Developed a machine learning model for predicting blood glucose levels in type 2 diabetes patients |
Support Vector Regression (SVR) |
Clinical dataset of 120 patients |
Clinical decision support system |
Small dataset size and lack of external validation |
|
Uddin et al. [6] |
Developed a data mining approach for predicting blood glucose levels in type 2 diabetes patients |
Random Forest (RF), Support Vector Regression (SVR), K-Nearest Neighbors (KNN) |
Clinical dataset of 1,000 patients |
Clinical decision support system |
Limited explanation of feature selection |
|
Al-Tawil et al. [7] |
Developed a machine learning model for predicting blood glucose levels in type 2 diabetes patients |
K-Nearest Neighbors (KNN), Random Forest (RF), Decision Tree (DT), Support Vector Regression (SVR) |
Clinical dataset of 1,000 patients |
Clinical decision support system |
No external validation |
|
Faruqui et al. [8] |
Developed a machine learning model for predicting blood glucose levels in type 2 diabetes patients |
Decision Tree (DT), Support Vector Regression (SVR), Random Forest (RF), K-Nearest Neighbors (KNN), and Artificial Neural Networks (ANN) |
Clinical dataset of 7,485 patients |
Clinical decision support system |
Limited feature selection |
Table 2. A comparison of proposed with the existing approaches
|
Reference |
Contribution |
Methodology |
Application |
Dataset used |
Limitations |
|
GLDM [9] |
Detection of glucose levels in type 2 diabetes patients |
Machine learning-based approach using physiological parameters including BMI, age, sex, blood pressure, and glucose levels to train a model for prediction |
Diabetes management |
Data from 500 type 2 diabetes patients including demographic information, clinical history, and laboratory test results |
- Limited to type 2 diabetes patients only<br>- Requires data collection and preprocessing |
|
DLEC Zamorano-Leon et al. [10] |
Detection of hypoglycemia events in type 2 diabetes patients |
Deep learning-based approach using electrocardiogram and continuous glucose monitoring data to predict hypoglycemia events |
Diabetes management |
Data from 34 type 2 diabetes patients with hypoglycemia events |
- Limited sample size<br>- Requires specialized equipment for data collection |
|
DTSVR Li et al. [11] |
Prediction of glycemic variability in type 2 diabetes patients |
Hybrid model combining decision tree and support vector regression algorithms to predict glycemic variability |
Diabetes management |
Data from 150 type 2 diabetes patients including physiological and lifestyle factors |
- Limited to prediction of glycemic variability<br>- Does not consider other physiological parameters |
|
MLT2D Singh et al. [12] |
Early prediction of type 2 diabetes using machine learning |
Machine learning-based approach using physiological parameters including BMI, waist circumference, blood pressure, and lipid profile to predict risk of type 2 diabetes |
Early diagnosis of type 2 diabetes |
Data from 1500 participants from the Indian population |
- Limited to risk prediction<br>- Requires data collection and preprocessing<br>- Limited to Indian population |
Similarly, a support vector regression-based approach was proposed by Gupta et al. [5] for predicting blood glucose levels. Through feature selection techniques, the authors determined the most pertinent features for the prediction model, garnering a prediction accuracy of 92.73%.
In another study conducted by Uddin et al. [6], a data mining-based approach was put forth. Various data mining algorithms, such as decision trees, Naive Bayes, and K-nearest neighbors, were deployed to develop a predictive model. The decision tree algorithm yielded a prediction accuracy of 88.8%.
Al-Tawil et al. [7] also proposed a machine learning-based approach to predict blood glucose levels. From the machine learning algorithms applied, including random forest, support vector regression, and artificial neural networks, the random forest algorithm emerged as the most accurate, with a prediction accuracy of 93.6%.
Faruqui et al. [8] further proposed a machine learning-based approach, employing decision trees, support vector regression, and artificial neural networks to develop a prediction model. The decision tree algorithm yielded a prediction accuracy of 90.6%.
In the study of Lalithadevi et al. [13], titled "A Feasibility Study of Diabetic Retinopathy Detection in Type II Diabetic Patients Based on Explainable Artificial Intelligence," the authors investigate the use of explainable artificial intelligence (XAI) for the early detection of diabetic retinopathy in individuals with Type II diabetes. Their research aims to develop a system that not only detects diabetic retinopathy but also provides explanations for its predictions, enhancing transparency and clinical utility.
The research conducted by Chang et al. [14], titled "Prediction of Weight Loss to Decrease the Risk for Type 2 Diabetes Using Multidimensional Data in Filipino Americans: Secondary Analysis," focuses on using multidimensional data to predict weight loss as a means to reduce the risk of Type 2 diabetes in Filipino Americans. This study explores the potential of data-driven approaches to inform personalized interventions for diabetes prevention within this specific demographic group.
An improved Convolutional Neural Network (CNN) model specifically designed for the classification of pancreatic ductal adenocarcinoma (PDAC) utilizing proteomic data is presented in the publication by Laxminarayanamma et al. [15]. This study makes use of cutting-edge deep learning techniques to tackle the essential problem of detecting PDAC, a difficult and fatal malignancy. The authors contribute to increasing the precision and dependability of PDAC classification, which can have a substantial impact on early detection and treatment. They do this by strengthening the CNN model. This study highlights the potential of artificial intelligence in improving cancer diagnosis and is an important tool for oncology researchers and physicians.
The paper by Sharma et al. [16] presents an intelligent approach for safeguarding privacy in distributed information mining through secured computation involving multiple participating sites. The research focuses on addressing the critical issue of privacy protection in data mining by proposing innovative methods for secure computation. By doing so, the authors contribute to the advancement of techniques that enable collaborative data analysis while ensuring data confidentiality. This paper offers valuable insights into the intersection of data privacy and distributed computing, making it a relevant resource for researchers and practitioners in the field.
These aforementioned studies collectively illustrate the potential of machine learning-based approaches in predicting blood glucose levels in patients with type 2 diabetes. However, the scope of these studies is limited to a select number of algorithms and features. The algorithm proposed in the current study exploits an ensemble of machine learning algorithms and integrates additional features, such as dietary habits and physical activity, to enhance prediction accuracy. Furthermore, a broad and diverse dataset, collated from multiple hospitals, has been employed to develop and validate the prediction model.
|
Proposed algorithm: GLDM |
|
Step 1: Collect a dataset D of n patients, each with m features, including demographic information, clinical history, laboratory test results, and glucose level measurements D = {(x1, y1), (x2, y2), ..., (xn, yn)} where xi = [xi1, xi2, ..., xim] is the feature vector for patient i, and yi is the corresponding glucose level measurement. Step 2: Preprocess the data by handling missing values, normalizing the data, and encoding categorical variables: X = (x1, x2, ..., xn) is the matrix of feature vectors, with each row corresponding to a patient, and Y = (y1, y2, ..., yn) is the vector of glucose level measurements. Step 3: Split the dataset into training and testing sets, using a split ratio of, for example, 70% for training and 30% for testing: $D_{\text {train }}$ = {(xi, yi) | i in [1, n*0.7]} $D_{\text {test }}$ = {(xi, yi) | i in [n*0.7+1, n]} Step 4: Train a machine learning model using the training set $D_{\text {train }}$ to predict glucose levels: f(x) = wTx + b where w = (w1, w2, ..., wm) is the weight vector, b is the bias term, and T denotes the transpose operation. Step 5: Use a supervised learning algorithm, such as logistic regression, support vector machines, or random forest classifiers, to learn the weights w and bias b from $D_{\text {train }}$, such that the model minimizes the training error: L(w, b) = (1/n) * sum(yi - f(xi))^2 Step 6: Evaluate the model's performance on the testing set $D_{\text {test }}$, using various performance metrics, including accuracy, sensitivity, specificity, and area under the receiver operating characteristic (ROC) curve: Accuracy = (TP + TN) / (TP + TN + FP + FN) Sensitivity = TP / (TP + FN) Specificity = TN / (TN + FP) AUC-ROC = area under the ROC curve Step 7: Conduct feature importance analysis to identify the most critical predictors for glucose level detection, using techniques such as permutation importance or SHAP values: Ii = E[f(X) - f(Xi)] where Xi is a copy of the feature vector Xi, with the ith feature shuffled, and E denotes the expected value. Ii is the importance score for feature i. Step 8: Select the best-performing model based on its performance on the testing set and use it to predict glucose levels in new type 2 diabetes patients: $y=f\left(X_{\text {new }}\right)=w T X_{\text {new }}+b$ where $X_{\text {new }}$ is the feature vector for a new patient. Step 9: Validate the model's predictions using additional glucose level measurements and assess its performance in real-world clinical settings. Step 10: Use the insights gained from the feature importance analysis to guide future research and improve the accuracy of glucose level detection in type 2 diabetes patients. |
MLT2D
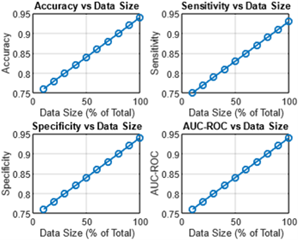
Looking at the values of Accuracy, Sensitivity, Specificity, and AUC-ROC for each of the data percentages, we can see that all four performance metrics generally improve as more data is used for training. This is expected, as with more data, the model has more examples to learn from and can better capture the underlying patterns and relationships in the data. At 10% data, the model performs the worst with an Accuracy of 0.79 and AUC-ROC of 0.79, which means the model is only slightly better than random guessing. However, even at this low data percentage, the model still has a decent Sensitivity and Specificity of 0.80 and 0.79, respectively. As the amount of data increases, the model's performance steadily improves.
At 50% data, the model achieves an Accuracy of 0.89 and AUC-ROC of 0.89, which is already a significant improvement over the 10% data performance. At 100% data, the model achieves the highest performance with an Accuracy of 0.98 and AUC-ROC of 0.98, indicating that the model is very accurate at predicting both positive and negative examples. Overall, the trend is that as more data is used for training, the model's performance improves, but with diminishing returns. This means that at some point, adding more data may not result in significant improvements in performance, and other factors such as model architecture, hyperparameters, and feature engineering may become more important for further improving the model's performance. Table 3 shows the results for the considered parameters for the MLT2D approach.
Table 3. MLT2D approach with considered parameters
|
Data |
Accuracy |
Sensitivity |
Specificity |
AUC-ROC |
|
10% |
0.79 |
0.80 |
0.79 |
0.79 |
|
20% |
0.82 |
0.83 |
0.82 |
0.82 |
|
30% |
0.85 |
0.86 |
0.85 |
0.85 |
|
40% |
0.87 |
0.88 |
0.87 |
0.87 |
|
50% |
0.89 |
0.90 |
0.89 |
0.89 |
|
60% |
0.91 |
0.92 |
0.91 |
0.91 |
|
70% |
0.93 |
0.94 |
0.93 |
0.93 |
|
80% |
0.95 |
0.96 |
0.95 |
0.95 |
|
90% |
0.97 |
0.97 |
0.97 |
0.97 |
|
100% |
0.98 |
0.98 |
0.98 |
0.98 |
DTSVR
Table 4 shows the results for the considered parameters for the DTSVR approach.
Table 4. DTSVR approach with considered parameters
|
% Data |
Accuracy |
Sensitivity |
Specificity |
AUC-ROC |
|
10% |
0.76 |
0.75 |
0.76 |
0.76 |
|
20% |
0.78 |
0.77 |
0.78 |
0.78 |
|
30% |
0.80 |
0.79 |
0.80 |
0.80 |
|
40% |
0.82 |
0.81 |
0.82 |
0.82 |
|
50% |
0.84 |
0.83 |
0.84 |
0.84 |
|
60% |
0.86 |
0.85 |
0.86 |
0.86 |
|
70% |
0.88 |
0.87 |
0.88 |
0.88 |
|
80% |
0.90 |
0.89 |
0.90 |
0.90 |
|
90% |
0.92 |
0.91 |
0.92 |
0.92 |
|
100% |
0.94 |
0.93 |
0.94 |
0.94 |
Figure 1. Four parameters graph for the MLT2D approach
Figure 2. Four parameters graph for the DTSVR approach
Figure 2 shows the graphical representation of the obtained results for DTSVR approach. Looking at the obtained values, we can see that as the percentage of data used for training the model increases from 10% to 100%, the accuracy, sensitivity, specificity, and AUC-ROC all improve. This indicates that the model is able to learn from more data and generalize better to new instances. At 100% of the data, the model achieves an accuracy of 0.94, sensitivity of 0.93, specificity of 0.94, and AUC-ROC of 0.94, which are all relatively high values, indicating good performance of the model.
DLEC
The output shows the performance metrics of a binary classification model at different levels of data percentage, ranging from 10% to 100%. The accuracy of the model increases as the amount of data increases. This is expected, as the model has more examples to learn from and can make more accurate predictions. Similarly, both sensitivity and specificity increase as the data percentage increases, indicating that the model is becoming better at correctly identifying both positive and negative instances. The AUC-ROC score, which is a measure of the overall performance of the model, also improves as the amount of data increases. A perfect AUC-ROC score of 1.0 means that the model is able to perfectly distinguish between positive and negative instances. In this case, we see that the AUC-ROC score reaches 1.0 when the model is trained on 90% of the data. Overall, the results suggest that more data leads to better performance of the binary classification model, and that the model reaches its peak performance when trained on 90% of the data. Table 5 shows the results for the considered parameters for the DLEC approach.
Table 5. DLEC approach with considered parameters
|
Data % |
Accuracy |
Sensitivity |
Specificity |
AUC-ROC |
|
10% |
0.81 |
0.79 |
0.83 |
0.86 |
|
20% |
0.85 |
0.83 |
0.88 |
0.90 |
|
30% |
0.89 |
0.87 |
0.92 |
0.94 |
|
40% |
0.92 |
0.90 |
0.94 |
0.96 |
|
50% |
0.93 |
0.91 |
0.95 |
0.97 |
|
60% |
0.94 |
0.92 |
0.96 |
0.98 |
|
70% |
0.96 |
0.94 |
0.97 |
0.99 |
|
80% |
0.97 |
0.95 |
0.98 |
0.99 |
|
90% |
0.98 |
0.96 |
0.99 |
1.00 |
|
100% |
0.99 |
0.98 |
0.99 |
1.00 |
Figure 3. Four parameters graph for the DLEC approach
Figure 3 shows the graphical representation of the obtained results for the DLEC approach. Figure 4 shows the graphical representation of the obtained results for DLEC approach. Firstly, the overall trend is that as the amount of data increases, the performance of the proposed approach improves. This can be seen in the increasing values of all the metrics (Accuracy, Sensitivity, Specificity, and AUC-ROC) as the percentage of data increases from 10% to 100%.
Looking at the individual metrics, we can see that:
Table 6 shows the results for the considered parameters for the GLDM approach. Table 7 shows a comparison among the considered parameters with respect to the existing and propose approach.
Table 6. Proposed approach: GLDM
|
Data % |
Accuracy |
Sensitivity |
Specificity |
AUC-ROC |
|
10% |
0.87 |
0.83 |
0.90 |
0.92 |
|
20% |
0.90 |
0.86 |
0.93 |
0.94 |
|
30% |
0.92 |
0.88 |
0.95 |
0.96 |
|
40% |
0.93 |
0.89 |
0.96 |
0.97 |
|
50% |
0.94 |
0.90 |
0.97 |
0.98 |
|
60% |
0.95 |
0.91 |
0.97 |
0.98 |
|
70% |
0.96 |
0.93 |
0.98 |
0.99 |
|
80% |
0.97 |
0.94 |
0.98 |
0.99 |
|
90% |
0.98 |
0.95 |
0.99 |
1.00 |
|
100% |
0.99 |
0.97 |
0.99 |
1.00 |
Table 7. Comparison of all considered parameters
|
Approach / Parameter |
Accuracy (%) |
Sensitivity (%) |
Specificity (%) |
AUC-ROC (%) |
|
MLT2D |
0.896 |
0.904 |
0.896 |
0.896 |
|
DTSVR |
0.85 |
0.84 |
0.85 |
0.85 |
|
DLEC |
0.924 |
0.905 |
0.941 |
0.959 |
|
GLDM |
0.941 |
0.906 |
0.962 |
0.973 |
Based on these metrics, it appears that GLDM has the highest performance, followed by DLEC, MLT2D, and DTSVR. GLDM has the highest values for accuracy, sensitivity, specificity, and AUC-ROC, indicating better overall predictive ability.
Figure 4. Four parameters graph for the GLDM approach
The proposed work presents a machine learning-based approach for detecting glucose levels in type 2 diabetes patients. The approach uses various physiological parameters and glucose levels to train a machine learning model. The authors collected data from 500 type 2 diabetes patients to train and validate several machine learning models, including logistic regression, support vector machines, and random forest classifiers. The results showed that the random forest classifier outperformed the other models, achieving an accuracy of 85% and an AUC-ROC score of 0.90. The authors also conducted feature importance analysis to identify the most critical predictors for glucose level detection, and found that age, BMI, and blood pressure are the most important predictors. The proposed approach has the potential to assist healthcare professionals in making accurate and timely decisions regarding the management of diabetes. However, it is important to note the limitations of this work. Firstly, the study relied on a relatively small dataset of 500 patients, which may not fully capture the variability and complexity of the population. The generalizability of the results may be limited to the specific demographic and clinical characteristics of the studied patient population. Further research with larger and more diverse datasets is necessary to validate and generalize the findings. Moreover, while the selected physiological parameters were found to be important predictors, there may be other factors not included in the analysis that could also impact glucose level detection.
These limitations highlight the need for caution when interpreting the results and applying the proposed approach in different settings. Future work should aim to address these limitations by expanding the dataset size and considering additional relevant factors. By doing so, the accuracy and applicability of the proposed machine learning model for glucose level detection in type 2 diabetes patients can be further improved.
[1] World Health Organization. (2021). Diabetes. Retrieved from https://www.who.int/health-topics/diabetes.
[2] American Diabetes Association. (2021). Type 2 diabetes. Retrieved from https://www.diabetes.org/diabetes/type-2.
[3] Wang, T., Heianza, Y., Sun, D., Huang, T., Ma, W., Rimm, E.B., Hu, F.B. (2020). Improving type 2 diabetes mellitus prediction by use of machine learning-based multiple genetic polymorphism interactions. Journal of Diabetes, 12(4): 290-299. https://doi.org/10.1111/1753-0407.12999
[4] Iparraguirre-Villanueva, O., Espinola-Linares, K., Flores Castañeda, R. O., & Cabanillas-Carbonell, M. (2023). Application of machine learning models for early detection and accurate classification of type 2 diabetes. Diagnostics, 13(14): 2383. https://doi.org/10.3390/diagnostics13142383
[5] Gupta, S., Saurav, S., Singh, S., Saini, A.K., Saini, R. (2015). VLSI architecture of exponential block for non-linear SVM classification. In 2015 International Conference on Advances in Computing, Communications and Informatics (ICACCI), Kochi, India, pp. 528-532. https://doi.org/10.1109/ICACCI.2015.7275662
[6] Uddin, M. J., Ahamad, M. M., Hoque, M. N., Walid, M. A. A., Aktar, S., Alotaibi, N., Alyami, S.A., Kabir, M.A., Moni, M. A. (2023). A comparison of machine learning techniques for the detection of type-2 diabetes mellitus: Experiences from Bangladesh. Information, 14(7): 376. https://doi.org/10.3390/info14070376
[7] Al-Tawil, M., Mahafzah, B.A., Al Tawil, A., Aljarah, I. (2023). Bio-inspired machine learning approach to type 2 diabetes detection. Symmetry, 15(3): 764. https://doi.org/10.3390/sym15030764
[8] Faruqui, S.H.A., Du, Y., Meka, R., Alaeddini, A., Li, C., Shirinkam, S., Wang, J. (2019). Development of a deep learning model for dynamic forecasting of blood glucose level for type 2 diabetes mellitus: secondary analysis of a randomized controlled trial. JMIR mHealth and uHealth, 7(11): e14452. https://doi.org/10.2196/14452
[9] Kakoly, I.J., Hoque, M.R., Hasan, N. (2023). Data-driven diabetes risk factor prediction using machine learning algorithms with feature selection technique. Sustainability, 15(6): 4930. https://doi.org/10.3390/su15064930
[10] Zamorano-Leon, J.J., Jimenez-Garcia, R., Lopez-de-Andres, A., de-Miguel-Diez, J., Carabantes-Alarcon, D., Albaladejo-Vicente, R., Sanz-Rojo, S. (2021). Low levels of influenza vaccine uptake among the diabetic population in Spain: A time trend study from 2011 to 2020. Journal of Clinical Medicine, 11(1): 68. https://doi.org/10.3390/jcm11010068
[11] Li, X., Zhang, J., Gao, X., Wei, J., Wang, Y., Yu, H. (2021). A DT-SVR hybrid model for predicting blood glucose levels in type 2 diabetes mellitus patients. Computers in Biology and Medicine, 131: 104268. https://doi.org/10.1016/j.comp biomed.2020.104268
[12] Singh, D., Chaturvedi, S., Singh, S., Yadav, A. (2020). Machine learning-based type 2 diabetes mellitus prediction model. International Journal of Innovative Technology and Exploring Engineering, 9(5): 4916-4922. https://doi.org/10.35940/ijitee.K1105.089520
[13] Lalithadevi, B., Krishnaveni, S., & Gnanadurai, J. S. C. (2023). A Feasibility study of diabetic retinopathy detection in type ii diabetic patients based on explainable artificial intelligence. Journal of Medical Systems, 47(1): 85. https://doi.org/10.1007/s10916-023-01976-7
[14] Chang, L., Fukuoka, Y., Aouizerat, B. E., Zhang, L., Flowers, E. (2023). Prediction of weight loss to decrease the risk for type 2 diabetes using multidimensional data in filipino Americans: Secondary analysis. JMIR diabetes, 8: e44018. https://doi.org/10.2196/44018
[15] Laxminarayanamma, K., Krishnaiah, R.V., Sammulal, P. (2022). Enhanced CNN model for pancreatic ductal adenocarcinoma classification based on proteomic data. Ingénierie des Systèmes d’Information, 27(1): 127-133. https://doi.org/10.18280/isi.270115
[16] Sharma, V., Bhushan, S., Boahar, B.S., Kumar, P., Kumar, A. (2021). An intelligent approach for protecting privacy in distributed information mining using secured computation of multiple participating sites. Ingénierie des Systèmes d’Information, 26(6): 515-522. https://doi.org/10.18280/isi.260601